Video Vortex Reader II: moving images beyond YouTube
Video Vortex Reader II: moving images beyond YouTube
Video Vortex Reader II: moving images beyond YouTube

Create successful ePaper yourself
Turn your PDF publications into a flip-book with our unique Google optimized e-Paper software.
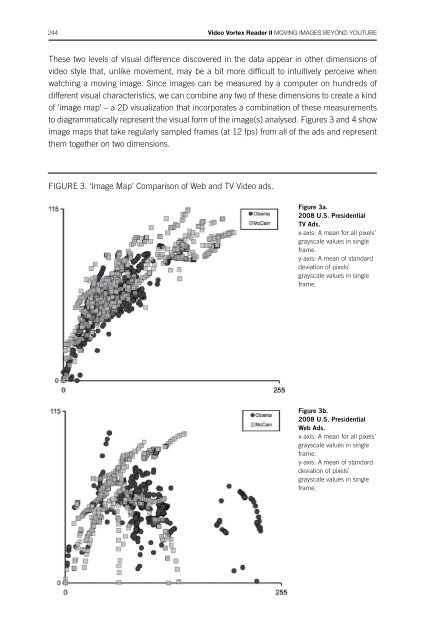
244 <strong>Video</strong> <strong>Vortex</strong> <strong>Reader</strong> <strong>II</strong> Moving Images Beyond Youtubetechnological approaches245These two levels of visual difference discovered in the data appear in other dimensions ofvideo style that, unlike movement, may be a bit more difficult to intuitively perceive whenwatching a <strong>moving</strong> image. Since <strong>images</strong> can be measured by a computer on hundreds ofdifferent visual characteristics, we can combine any two of these dimensions to create a kindof ‘image map’ – a 2D visualization that incorporates a combination of these measurementsto diagrammatically represent the visual form of the image(s) analysed. Figures 3 and 4 showimage maps that take regularly sampled frames (at 12 fps) from all of the ads and representthem together on two dimensions.In Figure 3, the mean (average) grayscale values of all video frames are mapped against thestandard deviation of these values. In other words, the x-axis represents the average brightnessof an image, while the y-axis represents the range of all grey tones in an image, so thateach point on the graph marks the intersection of these two measurements. Again, we canuse simple digital image analysis to measure these visual characteristics, but what can acomparison of the numbers reveal?The range of a binary grayscale is 0-255 where 0 is pure black, 255 is pure white and all valuesin-between are different intensities, or shades of grey. The further to the right of the graphFIGURE 3. ‘Image Map’ Comparison of Web and TV <strong>Video</strong> ads.Figure 3a.2008 U.S. PresidentialTV Ads.x-axis: A mean for all pixels’grayscale values in singleframe.y-axis: A mean of standarddeviation of pixels’grayscale values in singleframe.FIGURE 4. ‘Image Map’ Comparison of Obama and McCain TV Ads.Figure 4a.2008 Obama TV Ads.x-axis: A mean for all pixels’grayscale values in singleframe.y-axis: A mean of standarddeviation of pixels’grayscale values in singleframe.Figure 3b.2008 U.S. PresidentialWeb Ads.x-axis: A mean for all pixels’grayscale values in singleframe.y-axis: A mean of standarddeviation of pixels’grayscale values in singleframe.Figure 4b.2008 McCain TV Ads.x-axis: A mean for all pixels’grayscale values in singleframe.y-axis: A mean of standarddeviation of pixels’grayscale values in singleframe.