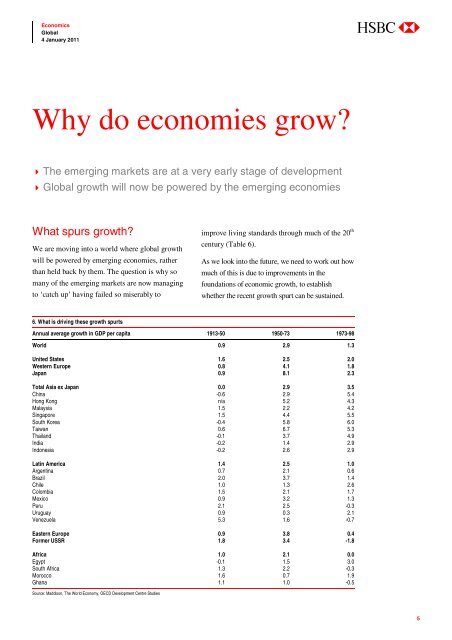
EconomicsGlobal4 January 2011abcWhy do economies grow? <strong>The</strong> emerg<strong>in</strong>g markets are at a very early stage of development Global growth will now be powered by <strong>the</strong> emerg<strong>in</strong>g economiesWhat spurs growth?We are mov<strong>in</strong>g <strong>in</strong>to a world where <strong>global</strong> growthwill be powered by emerg<strong>in</strong>g economies, ra<strong>the</strong>rthan held back by <strong>the</strong>m. <strong>The</strong> question is why somany of <strong>the</strong> emerg<strong>in</strong>g markets are now manag<strong>in</strong>gto ‘catch up’ hav<strong>in</strong>g failed so miserably toimprove liv<strong>in</strong>g standards through much of <strong>the</strong> 20 thcentury (Table 6).As we look <strong>in</strong>to <strong>the</strong> future, we need to work out howmuch of this is due to improvements <strong>in</strong> <strong>the</strong>foundations of economic growth, to establishwhe<strong>the</strong>r <strong>the</strong> recent growth spurt can be susta<strong>in</strong>ed.6. What is driv<strong>in</strong>g <strong>the</strong>se growth spurtsAnnual average growth <strong>in</strong> GDP per capita 1913-50 1950-73 1973-98<strong>World</strong> 0.9 2.9 1.3United States 1.6 2.5 2.0Western Europe 0.8 4.1 1.8Japan 0.9 8.1 2.3Total Asia ex Japan 0.0 2.9 3.5Ch<strong>in</strong>a -0.6 2.9 5.4Hong Kong n/a 5.2 4.3Malaysia 1.5 2.2 4.2S<strong>in</strong>gapore 1.5 4.4 5.5South Korea -0.4 5.8 6.0Taiwan 0.6 6.7 5.3Thailand -0.1 3.7 4.9India -0.2 1.4 2.9Indonesia -0.2 2.6 2.9Lat<strong>in</strong> America 1.4 2.5 1.0Argent<strong>in</strong>a 0.7 2.1 0.6Brazil 2.0 3.7 1.4Chile 1.0 1.3 2.6Colombia 1.5 2.1 1.7Mexico 0.9 3.2 1.3Peru 2.1 2.5 -0.3Uruguay 0.9 0.3 2.1Venezuela 5.3 1.6 -0.7Eastern Europe 0.9 3.8 0.4Former USSR 1.8 3.4 -1.8Africa 1.0 2.1 0.0Egypt -0.1 1.5 3.0South Africa 1.3 2.2 -0.3Morocco 1.6 0.7 1.9Ghana 1.1 1.0 -0.5Source: Maddison, <strong>The</strong> <strong>World</strong> Economy, OECD Development Centre Studies5
EconomicsGlobal4 January 2011abcTo get to projections for total GDP, we start bymodell<strong>in</strong>g <strong>in</strong>come per capita and <strong>the</strong>n <strong>in</strong>corporate<strong>the</strong> demographic outlook.Our estimations of per capita <strong>in</strong>come are basedheavily on <strong>the</strong> work of Harvard’s Robert Barro 1 . <strong>The</strong>keys determ<strong>in</strong>ants of economic development aresplit <strong>in</strong>to three groups (full details can be found <strong>in</strong>Appendix 1):1 Economic governance: <strong>the</strong> degree ofmonetary stability, political rights and <strong>the</strong>level of democracy, <strong>the</strong> rule of law, <strong>the</strong> sizeof government (with large governmentrestrict<strong>in</strong>g activity).2 Human capital: <strong>the</strong> level of education,health of <strong>the</strong> population and fertility rate.3 <strong>The</strong> start<strong>in</strong>g level of <strong>in</strong>come per capita.Before we go <strong>in</strong>to <strong>the</strong>se variables <strong>in</strong> more detail,it’s worth po<strong>in</strong>t<strong>in</strong>g out that we don’t <strong>in</strong>cludevariables such as sav<strong>in</strong>gs or <strong>in</strong>vestment rates. <strong>The</strong>reason is that <strong>the</strong>se should be endogenous to <strong>the</strong>system. We are look<strong>in</strong>g to identify <strong>the</strong> exogenous,structural factors that would mean people want to<strong>in</strong>vest. This should provide us with a morerigorous framework for consider<strong>in</strong>g howeconomies have changed and whe<strong>the</strong>r growth canbe susta<strong>in</strong>ed. In our view, this is a key reason whyour study differs from some previous studieswhich try to extrapolate how <strong>the</strong> <strong>in</strong>puts will grow,often us<strong>in</strong>g current <strong>in</strong>vestment rates. <strong>The</strong>se willtend to overstate growth.Economic governance<strong>The</strong> first set of variables are rule of law, monetarystability, democracy and government <strong>in</strong>terference,proxied by government spend<strong>in</strong>g. All try tocapture sound economic governance.This is clearly one area where <strong>the</strong>re has beensignificant change <strong>in</strong> <strong>the</strong> past couple of decades andwhich plays a major role <strong>in</strong> <strong>the</strong> recent progressfrom a number of <strong>the</strong>se emerg<strong>in</strong>g economies.Most obviously <strong>the</strong>re have been some significantregime changes around <strong>the</strong> world. Communism <strong>in</strong>large swa<strong>the</strong>s of <strong>the</strong> world, <strong>in</strong>clud<strong>in</strong>g <strong>the</strong> SovietUnion and Mao’s Ch<strong>in</strong>a, effectively divided <strong>the</strong>economic world and closed <strong>the</strong>se systems off toboth trade and <strong>the</strong> technological progress <strong>in</strong> <strong>the</strong>West. How can you ‘copy and paste’ <strong>the</strong>technologies of <strong>the</strong> world’s best economicperformers if you can’t see what <strong>the</strong>y are do<strong>in</strong>g?<strong>The</strong>se command economies often failed toallocate <strong>the</strong>ir domestic resources efficiently,suffer<strong>in</strong>g from low productivity and a lack oftechnological advance.As a result, through <strong>the</strong> 1950s, ‘60s and early‘70s, given <strong>in</strong>come per capita was com<strong>in</strong>g fromsuch a low base, we should have seen <strong>in</strong>come percapita growth far outstrip that of Western Europeor <strong>the</strong> US. Russia’s performance <strong>in</strong> <strong>the</strong> ‘50s and‘60s was reasonable but wasn’t susta<strong>in</strong>ed (Table6). Of course, <strong>the</strong> threat of war also played a keyrole <strong>in</strong> how resources were allocated. In <strong>the</strong>1970s, military and space spend<strong>in</strong>g consumed15% of GDP <strong>in</strong> <strong>the</strong> Soviet Union, three times that<strong>in</strong> <strong>the</strong> US and five times that <strong>in</strong> Europe.<strong>The</strong>se ‘iron curta<strong>in</strong>s’ have now been drawn back,open<strong>in</strong>g <strong>the</strong>se economies up to trade, and <strong>the</strong>technology available <strong>in</strong> developed nations.1 Determ<strong>in</strong>ants of Economic Growth: A cross-countryempirical study, Robert J BarroIndia's relative underperformance over <strong>the</strong> sameperiod also stemmed from significant governmentcontrol and an <strong>in</strong>ability to efficiently allocate6