The World in 2050-Quantifying the shift in the global economy - HSBC
The World in 2050-Quantifying the shift in the global economy - HSBC
The World in 2050-Quantifying the shift in the global economy - HSBC
- No tags were found...

Create successful ePaper yourself
Turn your PDF publications into a flip-book with our unique Google optimized e-Paper software.
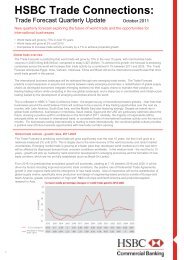
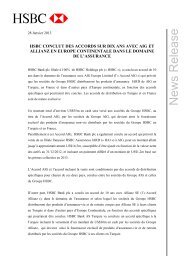
EconomicsGlobal4 January 2011abc This may have implications for <strong>the</strong> ability of <strong>the</strong>se economies to <strong>in</strong>fluence <strong>the</strong> <strong>global</strong> policy agenda.Already Europe has been forced to concede two seats on <strong>the</strong> IMF’s executive board <strong>in</strong> order to makeway for some emerg<strong>in</strong>g economies. This adds a whole new dimension to <strong>the</strong> current Eurozone crisis,and provides a significant <strong>in</strong>centive to euro-area countries to work through <strong>the</strong>ir current difficultiesand rema<strong>in</strong> a union. Demographic change is even more dramatic outside of Europe. <strong>The</strong> work<strong>in</strong>g population will rise by73% <strong>in</strong> Saudi Arabia and fall by 37% <strong>in</strong> Japan. That is reflected <strong>in</strong> <strong>the</strong>se countries' differ<strong>in</strong>g fortunes<strong>in</strong> our top 30 table (Chart 4). By <strong>2050</strong>, <strong>the</strong> seismic <strong>shift</strong> <strong>in</strong> <strong>the</strong> <strong>global</strong> <strong>economy</strong> will have only just begun. Despite a seven-fold<strong>in</strong>crease (Chart 5), <strong>in</strong>come per capita <strong>in</strong> Ch<strong>in</strong>a will still be only 32% of that <strong>in</strong> <strong>the</strong> US and scope forfur<strong>the</strong>r growth will be substantial. This ‘base effect’ must be considered when compar<strong>in</strong>g currentgrowth <strong>in</strong> <strong>the</strong> emerg<strong>in</strong>g world with that of <strong>the</strong> developed world. Energy availability need not h<strong>in</strong>der this path of <strong>global</strong> development so long as <strong>the</strong>re is major<strong>in</strong>vestment <strong>in</strong> efficiency and low-carbon alternatives. Meet<strong>in</strong>g food demand may prove more of achallenge, but improvements <strong>in</strong> yield and diet could fill <strong>the</strong> gap. In <strong>the</strong> f<strong>in</strong>al section, we discuss ourprelim<strong>in</strong>ary thoughts on this topic.1. Growth <strong>in</strong> <strong>the</strong> emerg<strong>in</strong>g markets will boost <strong>global</strong> growth% Contributions to <strong>global</strong> growth%4.04.03.03.02.02.01.01.00.00.0Source: <strong>HSBC</strong> Calculations1970s 1980s 1990s 2000s 2010s 2020s 2030s 2040sDev eloped Markets Emerg<strong>in</strong>g markets Global2
EconomicsGlobal4 January 2011abc4. <strong>The</strong> outlook for work<strong>in</strong>g population is vastly different across economiesSaudiEgy ptIsraelVenezuelaMalay siaIndiaColombiaArgent<strong>in</strong>aTurkeyIrelandAustraliaIndonesiaSouthUSIranCanadaNorwayMexicoUKBrazilSw edenSwitzerlandFranceThailandBelgiumDenmarkNe<strong>the</strong>rlandHong KongF<strong>in</strong>landCh<strong>in</strong>aSpa<strong>in</strong>AustriaS<strong>in</strong>gaporeGreeceItalyGermanyRussiaS. KoreaPolandJapan-4 0 -15 10 35 60% change <strong>in</strong> w ork<strong>in</strong>g population betw een 2010 and <strong>2050</strong>Source: UN projections, <strong>HSBC</strong> calculations5. <strong>The</strong> rise <strong>in</strong> <strong>in</strong>come per capita <strong>in</strong> <strong>the</strong> emerg<strong>in</strong>g world will dwarf that of <strong>the</strong> US <strong>in</strong> <strong>the</strong> com<strong>in</strong>g years%Grow th <strong>in</strong> <strong>in</strong>come per capita 2010 - <strong>2050</strong>%90080070060050040030020010009008007006005004003002001000USVenezuelaSouth AfricaSaudi ArabiaHong KongArgent<strong>in</strong>aBrazilSouth KoreaIranMexicoColombiaPolandTurkeyIndonesiaThailandEgyptMalaysiaRussiaIndiaCh<strong>in</strong>aSource: <strong>HSBC</strong> Calculations4
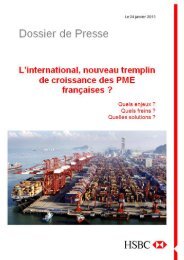
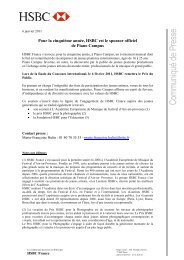
EconomicsGlobal4 January 2011abcWhy do economies grow? <strong>The</strong> emerg<strong>in</strong>g markets are at a very early stage of development Global growth will now be powered by <strong>the</strong> emerg<strong>in</strong>g economiesWhat spurs growth?We are mov<strong>in</strong>g <strong>in</strong>to a world where <strong>global</strong> growthwill be powered by emerg<strong>in</strong>g economies, ra<strong>the</strong>rthan held back by <strong>the</strong>m. <strong>The</strong> question is why somany of <strong>the</strong> emerg<strong>in</strong>g markets are now manag<strong>in</strong>gto ‘catch up’ hav<strong>in</strong>g failed so miserably toimprove liv<strong>in</strong>g standards through much of <strong>the</strong> 20 thcentury (Table 6).As we look <strong>in</strong>to <strong>the</strong> future, we need to work out howmuch of this is due to improvements <strong>in</strong> <strong>the</strong>foundations of economic growth, to establishwhe<strong>the</strong>r <strong>the</strong> recent growth spurt can be susta<strong>in</strong>ed.6. What is driv<strong>in</strong>g <strong>the</strong>se growth spurtsAnnual average growth <strong>in</strong> GDP per capita 1913-50 1950-73 1973-98<strong>World</strong> 0.9 2.9 1.3United States 1.6 2.5 2.0Western Europe 0.8 4.1 1.8Japan 0.9 8.1 2.3Total Asia ex Japan 0.0 2.9 3.5Ch<strong>in</strong>a -0.6 2.9 5.4Hong Kong n/a 5.2 4.3Malaysia 1.5 2.2 4.2S<strong>in</strong>gapore 1.5 4.4 5.5South Korea -0.4 5.8 6.0Taiwan 0.6 6.7 5.3Thailand -0.1 3.7 4.9India -0.2 1.4 2.9Indonesia -0.2 2.6 2.9Lat<strong>in</strong> America 1.4 2.5 1.0Argent<strong>in</strong>a 0.7 2.1 0.6Brazil 2.0 3.7 1.4Chile 1.0 1.3 2.6Colombia 1.5 2.1 1.7Mexico 0.9 3.2 1.3Peru 2.1 2.5 -0.3Uruguay 0.9 0.3 2.1Venezuela 5.3 1.6 -0.7Eastern Europe 0.9 3.8 0.4Former USSR 1.8 3.4 -1.8Africa 1.0 2.1 0.0Egypt -0.1 1.5 3.0South Africa 1.3 2.2 -0.3Morocco 1.6 0.7 1.9Ghana 1.1 1.0 -0.5Source: Maddison, <strong>The</strong> <strong>World</strong> Economy, OECD Development Centre Studies5
EconomicsGlobal4 January 2011abcTo get to projections for total GDP, we start bymodell<strong>in</strong>g <strong>in</strong>come per capita and <strong>the</strong>n <strong>in</strong>corporate<strong>the</strong> demographic outlook.Our estimations of per capita <strong>in</strong>come are basedheavily on <strong>the</strong> work of Harvard’s Robert Barro 1 . <strong>The</strong>keys determ<strong>in</strong>ants of economic development aresplit <strong>in</strong>to three groups (full details can be found <strong>in</strong>Appendix 1):1 Economic governance: <strong>the</strong> degree ofmonetary stability, political rights and <strong>the</strong>level of democracy, <strong>the</strong> rule of law, <strong>the</strong> sizeof government (with large governmentrestrict<strong>in</strong>g activity).2 Human capital: <strong>the</strong> level of education,health of <strong>the</strong> population and fertility rate.3 <strong>The</strong> start<strong>in</strong>g level of <strong>in</strong>come per capita.Before we go <strong>in</strong>to <strong>the</strong>se variables <strong>in</strong> more detail,it’s worth po<strong>in</strong>t<strong>in</strong>g out that we don’t <strong>in</strong>cludevariables such as sav<strong>in</strong>gs or <strong>in</strong>vestment rates. <strong>The</strong>reason is that <strong>the</strong>se should be endogenous to <strong>the</strong>system. We are look<strong>in</strong>g to identify <strong>the</strong> exogenous,structural factors that would mean people want to<strong>in</strong>vest. This should provide us with a morerigorous framework for consider<strong>in</strong>g howeconomies have changed and whe<strong>the</strong>r growth canbe susta<strong>in</strong>ed. In our view, this is a key reason whyour study differs from some previous studieswhich try to extrapolate how <strong>the</strong> <strong>in</strong>puts will grow,often us<strong>in</strong>g current <strong>in</strong>vestment rates. <strong>The</strong>se willtend to overstate growth.Economic governance<strong>The</strong> first set of variables are rule of law, monetarystability, democracy and government <strong>in</strong>terference,proxied by government spend<strong>in</strong>g. All try tocapture sound economic governance.This is clearly one area where <strong>the</strong>re has beensignificant change <strong>in</strong> <strong>the</strong> past couple of decades andwhich plays a major role <strong>in</strong> <strong>the</strong> recent progressfrom a number of <strong>the</strong>se emerg<strong>in</strong>g economies.Most obviously <strong>the</strong>re have been some significantregime changes around <strong>the</strong> world. Communism <strong>in</strong>large swa<strong>the</strong>s of <strong>the</strong> world, <strong>in</strong>clud<strong>in</strong>g <strong>the</strong> SovietUnion and Mao’s Ch<strong>in</strong>a, effectively divided <strong>the</strong>economic world and closed <strong>the</strong>se systems off toboth trade and <strong>the</strong> technological progress <strong>in</strong> <strong>the</strong>West. How can you ‘copy and paste’ <strong>the</strong>technologies of <strong>the</strong> world’s best economicperformers if you can’t see what <strong>the</strong>y are do<strong>in</strong>g?<strong>The</strong>se command economies often failed toallocate <strong>the</strong>ir domestic resources efficiently,suffer<strong>in</strong>g from low productivity and a lack oftechnological advance.As a result, through <strong>the</strong> 1950s, ‘60s and early‘70s, given <strong>in</strong>come per capita was com<strong>in</strong>g fromsuch a low base, we should have seen <strong>in</strong>come percapita growth far outstrip that of Western Europeor <strong>the</strong> US. Russia’s performance <strong>in</strong> <strong>the</strong> ‘50s and‘60s was reasonable but wasn’t susta<strong>in</strong>ed (Table6). Of course, <strong>the</strong> threat of war also played a keyrole <strong>in</strong> how resources were allocated. In <strong>the</strong>1970s, military and space spend<strong>in</strong>g consumed15% of GDP <strong>in</strong> <strong>the</strong> Soviet Union, three times that<strong>in</strong> <strong>the</strong> US and five times that <strong>in</strong> Europe.<strong>The</strong>se ‘iron curta<strong>in</strong>s’ have now been drawn back,open<strong>in</strong>g <strong>the</strong>se economies up to trade, and <strong>the</strong>technology available <strong>in</strong> developed nations.1 Determ<strong>in</strong>ants of Economic Growth: A cross-countryempirical study, Robert J BarroIndia's relative underperformance over <strong>the</strong> sameperiod also stemmed from significant governmentcontrol and an <strong>in</strong>ability to efficiently allocate6
EconomicsGlobal4 January 2011abcresources, partly by shield<strong>in</strong>g domestic bus<strong>in</strong>essfrom foreign competition follow<strong>in</strong>g Indian<strong>in</strong>dependence. Through much of <strong>the</strong> ‘70s and‘80s, <strong>the</strong> government dom<strong>in</strong>ated <strong>in</strong>dustrial activityby controll<strong>in</strong>g both <strong>the</strong> licens<strong>in</strong>g to trade orimport and <strong>the</strong> loanable funds available for suchactivity (and this allocation was often riddled withcorruption). Time and aga<strong>in</strong>, this led to productionshortages and balance of payments crises. In <strong>the</strong>early 1990s, India made significant strides <strong>in</strong>correct<strong>in</strong>g at least some of <strong>the</strong>se supply-sideissues. Industrial licens<strong>in</strong>g was largely removedand import restrictions were pared back on capitaland <strong>in</strong>dustrial <strong>in</strong>puts. While <strong>the</strong>re are still certa<strong>in</strong>problems <strong>in</strong> government adm<strong>in</strong>istration, <strong>the</strong>Indian <strong>economy</strong> has aga<strong>in</strong> been opened up to <strong>the</strong>demand and technological know-how of <strong>the</strong> moredeveloped economies.7. A lack of monetary discipl<strong>in</strong>e has plagued LATAM’s history% Yr Inflati on% Yr100080060040020001961 1967 1973 1979 1985 1991 1997 2003 2009Chile (LHS)Argent<strong>in</strong>a (RHS)Brazil (RHS)3200280024002000160012008004000Lat<strong>in</strong> America, by contrast, had made itselfconsiderably more open to <strong>the</strong> competition, tradeand capital offered by <strong>the</strong> <strong>global</strong> <strong>economy</strong> butfound itself plagued through <strong>the</strong> 1970s and ‘80sby a lack of monetary control, giv<strong>in</strong>g rise tofrequent <strong>in</strong>flationary outbursts and debt crises(Chart 7). An improvement <strong>in</strong> governance hasplayed a key role <strong>in</strong> turn<strong>in</strong>g economic fortunes <strong>in</strong>parts of LATAM. This had led to o<strong>the</strong>r supplysideimprovements that tend to follow a period oflow and stable <strong>in</strong>flation.Beh<strong>in</strong>d all <strong>the</strong>se <strong>in</strong>dividual country stories between<strong>the</strong> ‘70s and ‘90s, <strong>the</strong>re was a major reth<strong>in</strong>k of howbest to run economies to aid economicdevelopment. <strong>The</strong> traditional th<strong>in</strong>k<strong>in</strong>g had been thatstate control and economic plann<strong>in</strong>g, public<strong>in</strong>vestment and protection from <strong>the</strong> volatility of <strong>the</strong>world market was <strong>the</strong> best recipe for promot<strong>in</strong>geconomic development. Self-sufficiency was <strong>the</strong>goal, so foreign trade was seen as a h<strong>in</strong>drance and<strong>the</strong>refore a tax opportunity.From <strong>the</strong> late 1970s, a stream of work from <strong>the</strong>NBER, <strong>World</strong> Bank and IMF started to challengethis form of governance. <strong>The</strong>y began advocat<strong>in</strong>gmarket-friendly and open-border policies to promoteeconomic development. This work culm<strong>in</strong>ated <strong>in</strong> <strong>the</strong>publication of what was termed by some as <strong>the</strong>‘Miracle Book’ by <strong>the</strong> <strong>World</strong> Bank <strong>in</strong> 1993 2 .Source: <strong>World</strong> Bank2 <strong>The</strong> East Asian Miracle: economic growth and public policy,<strong>World</strong> Bank, Oxford University Press, 19937
EconomicsGlobal4 January 2011abcHow does democracy fit <strong>in</strong>to <strong>the</strong> story of successthrough liberalisation? It is generally assumed thatdemocratic systems will be most successful <strong>in</strong>achiev<strong>in</strong>g growth because <strong>the</strong> population will want<strong>the</strong> highest standard of liv<strong>in</strong>g possible and so willvote for governments offer<strong>in</strong>g policies most capableof deliver<strong>in</strong>g growth. It’s certa<strong>in</strong>ly true that <strong>the</strong> mostdemocratic systems have delivered <strong>the</strong> best<strong>in</strong>vestment prospects as characterised by <strong>the</strong> rule oflaw <strong>in</strong>dex (Chart 8).But <strong>the</strong>re are authoritarian regimes that have stilldelivered a good ‘rule of law’, Ch<strong>in</strong>a and S<strong>in</strong>gaporebe<strong>in</strong>g <strong>the</strong> clearest examples. And <strong>in</strong> parts of Lat<strong>in</strong>America, democracy has done little to raise <strong>the</strong>irscore for rule of law.Barro’s work actually showed that too muchdemocracy wasn’t necessarily a good th<strong>in</strong>g foreconomic growth (of course it may be <strong>the</strong> bestmodel for social development). He found that at veryhigh levels of democracy, <strong>in</strong>come redistributionbecomes a dom<strong>in</strong>ant force, which serves to restra<strong>in</strong>entrepreneurial endeavours. And democracy places adisproportionate weight on w<strong>in</strong>n<strong>in</strong>g current votes,potentially at <strong>the</strong> expense of future votes, and<strong>the</strong>refore can h<strong>in</strong>der <strong>the</strong> <strong>in</strong>vestment required forlong-term development.Overall, authoritarian regimes can deliver economicsuccess if <strong>the</strong> system manages to set <strong>in</strong> place <strong>the</strong><strong>in</strong>centives that a market-based system naturallydelivers, namely competition and a motivation todrive efficiency.8. Some authoritarian regimes have been more successful at deliver<strong>in</strong>g good <strong>in</strong>vestment conditions than more liberal systems1.21.00.8Ch<strong>in</strong>a +Saudi ArabiaS<strong>in</strong>gaporeS. KoreaAustralia+UK+CanadaIreland+Ne<strong>the</strong>rlands+Sweden+Denmark+Austria+No rway+F<strong>in</strong>landGermany+US+Japan+France+Spa<strong>in</strong>+Switzerland+BelgiumTurkeyGreece+PolandRule of Law Index0.6IndonesiaIran + RussiaEgyptIndia + M alaysiaItaly+Israel0.4ThailandHong KongSouth Africa + Argent<strong>in</strong>aColombiaMexico + Brazil0.2Venezuela0.00.0 0.2 0.4 0.6 0.8 1.0 1.2Democracy IndexSource: Political Risk Services International Country Risk Guide & Freedom House political rights <strong>in</strong>dex8
EconomicsGlobal4 January 2011abc9. Ch<strong>in</strong>a’s state-owned enterprises are <strong>in</strong> decl<strong>in</strong>e% of total urban employ ment <strong>in</strong> state-ow ned enterprises10080100806060404020200060 64 68 72 76 80 84 88 92 96 00 04 08Source: CEIC<strong>The</strong>re are a number of examples of how this hasbeen achieved <strong>in</strong> Ch<strong>in</strong>a (for fur<strong>the</strong>r details see Inside<strong>the</strong> growth eng<strong>in</strong>e (Zhang Zhim<strong>in</strong>g, December 8,2010). De-centralis<strong>in</strong>g and privatis<strong>in</strong>g production to<strong>the</strong> regional level and runn<strong>in</strong>g down <strong>the</strong> old stateowned<strong>in</strong>dustry model (Chart 9) has led to ‘<strong>in</strong>dustryrivalry’ between <strong>the</strong> regions deliver<strong>in</strong>g competitionand <strong>in</strong>centives for <strong>the</strong> state governments.Ano<strong>the</strong>r example <strong>in</strong> Ch<strong>in</strong>a is <strong>the</strong> ‘householdresponsibility system’ whereby land was leased torural households with set taxes and rents.Households had every <strong>in</strong>centive to improveproductivity because <strong>the</strong>y <strong>the</strong>n reaped <strong>the</strong> rewards.And Ch<strong>in</strong>a has clearly opened itself up to foreigndirect <strong>in</strong>vestment and <strong>global</strong> trade, and <strong>in</strong> 2001jo<strong>in</strong>ed <strong>the</strong> <strong>World</strong> Trade Organisation. Suchengagement with <strong>the</strong> developed world allows it tomimic and develop <strong>the</strong> technologies of <strong>the</strong> West.<strong>The</strong>re are still challenges to overcome which have<strong>the</strong> potential to raise Ch<strong>in</strong>a’s growth rate fur<strong>the</strong>r.In particular, fuzz<strong>in</strong>ess of certa<strong>in</strong> ownershiparrangements, especially <strong>in</strong> <strong>the</strong> regional enterprisesector, and a lack of legal <strong>in</strong>frastructure will allconstra<strong>in</strong> Ch<strong>in</strong>a’s potential. Moreover, <strong>the</strong> statecontrolledbank<strong>in</strong>g system is <strong>the</strong> only officialgame <strong>in</strong> town for borrowers and savers.Liberalisation of <strong>the</strong> f<strong>in</strong>ancial sector will betteralign borrowers and savers and should lead to amore efficient allocation of capital.But it’s worth remember<strong>in</strong>g that dur<strong>in</strong>g <strong>the</strong> 1970sJapan was criticised us<strong>in</strong>g many of <strong>the</strong> argumentsthat now face Ch<strong>in</strong>a. <strong>The</strong> Japanese catch-up effortwas bolstered significantly by government policy.Large corporate groups (keiretsu) and banks hadclose ties, and <strong>the</strong> M<strong>in</strong>istry of Trade and <strong>in</strong>dustryprovided adm<strong>in</strong>istered guidance to firms andbanks which <strong>in</strong>fluenced what were deemed ‘key<strong>in</strong>dustries’. Indeed, <strong>the</strong> criticisms were such ah<strong>in</strong>drance to Japan’s <strong>global</strong> economic reputationthat it made a significant donation to <strong>the</strong> <strong>World</strong>Bank for it to complete <strong>the</strong> ‘Miracle Book’ toexam<strong>in</strong>e <strong>the</strong> issue.9
EconomicsGlobal4 January 2011abcHuman capital<strong>The</strong> next set of variables <strong>in</strong> <strong>the</strong> model focus on <strong>the</strong>productivity of <strong>the</strong> worker – <strong>the</strong> level of educationbe<strong>in</strong>g <strong>the</strong> most significant (Chart 10). It’s all verywell hav<strong>in</strong>g <strong>the</strong> latest technology, but if aworkforce hasn’t been sufficiently tra<strong>in</strong>ed it won’tbe able to use it. And once ‘copy and paste’growth is complete, it seems likely <strong>the</strong> mosteducated workforce will be <strong>the</strong> one able to<strong>in</strong>novate and drive technological progress.Ano<strong>the</strong>r important determ<strong>in</strong>ant of <strong>the</strong> productivityof <strong>the</strong> workforce is health, which Barro proxieswith life expectancy. If you expect to live, and<strong>the</strong>refore work, for a long time, it will be worthwhile <strong>in</strong>vest<strong>in</strong>g years gett<strong>in</strong>g yourself educated. Ofcourse, on <strong>the</strong> o<strong>the</strong>r end of <strong>the</strong> spectrum, apopulation that lives a long time but spends a largeperiod of time <strong>in</strong> retirement could place a burdenon <strong>the</strong> work<strong>in</strong>g population. But we should capturethis <strong>in</strong> our model due to <strong>the</strong> high levels ofgovernment spend<strong>in</strong>g required to support an age<strong>in</strong>gpopulation. Growth will <strong>the</strong>refore be constra<strong>in</strong>ed <strong>in</strong>countries with a high dependency ratio.Barro also takes <strong>in</strong>to account <strong>the</strong> level of fertility.A higher fertility rate means <strong>in</strong>vestment goods arespread more th<strong>in</strong>ly, and with more productivecapacity devoted to child rear<strong>in</strong>g, it reducesoutput per capita. Of course, when we considertotal growth, high-fertility economies will get aboost for this reason.<strong>The</strong> role of mortality, fertility and life expectancyis explored <strong>in</strong> some detail <strong>in</strong> <strong>the</strong> chapter entitled‘Runn<strong>in</strong>g out of workers’ <strong>in</strong> Stephen K<strong>in</strong>g’s bookLos<strong>in</strong>g Control (Yale University Press, 2010).10. <strong>The</strong> more educated a nation, <strong>the</strong> more likely an <strong>economy</strong>will be able to catch up and <strong>in</strong>novateNorwayUSAustraliaS. KoreaGermanyIrelandJapanSwedenCanadaHong KongNe<strong>the</strong>rlandIsraelGreeceBelgiumFranceSpa<strong>in</strong>SaudiMalay siaDenmarkF<strong>in</strong>landIranSw itzerlandPolandCh<strong>in</strong>aRussiaUKAustriaItalyArgent<strong>in</strong>aMexicoSouthS<strong>in</strong>gaporeColombiaBrazilThailandEgy ptVenezuelaTurkeyIndiaIndonesiaSource: Barro-Lee0 2 4 6 8 10 12 14Average years of male school<strong>in</strong>g10
EconomicsGlobal4 January 2011abc<strong>The</strong> start<strong>in</strong>g level of <strong>in</strong>come percapita<strong>The</strong> model <strong>the</strong>n <strong>in</strong>cludes <strong>the</strong> current level of GDP on<strong>the</strong> basis that if a country has <strong>the</strong> right economic<strong>in</strong>frastructure, growth <strong>in</strong> low-<strong>in</strong>come economies willbe amplified <strong>in</strong> <strong>the</strong> short run as additional <strong>in</strong>vestmentproduces high returns. <strong>The</strong>se fade when <strong>the</strong> law ofdim<strong>in</strong>ish<strong>in</strong>g returns kicks <strong>in</strong>.To illustrate this ‘law’, take <strong>the</strong> example of aroadsweeper. With no equipment at all, it takesthis roadsweeper a long time to clear one street bycollect<strong>in</strong>g <strong>the</strong> litter by hand. Now supply him witha broom, and he will be able to clean many morestreets than before. His productivity – output perworker – <strong>in</strong> this case measured <strong>in</strong> clean streets,will have risen dramatically.Now supply him with two brooms and <strong>the</strong>re is apossibility he can clean streets a little faster, but<strong>the</strong> ga<strong>in</strong> <strong>in</strong> productivity is unlikely to be anywherenear as great as that seen with <strong>the</strong> first broom.This is what we know as <strong>the</strong> law of dim<strong>in</strong>ish<strong>in</strong>gmarg<strong>in</strong>al returns. Incremental capital additionsgenerate smaller output ga<strong>in</strong>s as <strong>the</strong> level of <strong>the</strong>capital stock <strong>in</strong>creases and at some po<strong>in</strong>t fur<strong>the</strong>r<strong>in</strong>vestment is po<strong>in</strong>tless. <strong>The</strong>re is no po<strong>in</strong>t hav<strong>in</strong>gthree brooms when you only have two arms.Because of dim<strong>in</strong>ish<strong>in</strong>g returns one can’t simplyextrapolate current growth or <strong>in</strong>vestment rates.Just consider <strong>the</strong> mistakes made with forecasts forJapan <strong>in</strong> <strong>the</strong> early 1960s. An explosion <strong>in</strong><strong>in</strong>vestment fuelled extremely high rates of growthand <strong>in</strong>come per capita rose from just 50% of <strong>the</strong>level seen <strong>in</strong> <strong>the</strong> US <strong>in</strong> 1960 to be<strong>in</strong>g equal to <strong>the</strong>levels of <strong>in</strong>come by <strong>the</strong> early 1970s (Chart 11).11. <strong>The</strong> Tigers’ pounce% Per capita <strong>in</strong>come relativ e to US%1401401201201001008080606040402020001960 1966 1972 1978 1984 1990 1996 2002 2008South KoreaJapanHong KongS<strong>in</strong>gaporeSource: <strong>World</strong> Bank, <strong>HSBC</strong> CalculationsBut extrapolat<strong>in</strong>g <strong>the</strong> rates of growth <strong>in</strong><strong>in</strong>vestment spend<strong>in</strong>g <strong>in</strong>to <strong>the</strong> future, as many did,suggested that Japanese <strong>in</strong>come per capita wouldcont<strong>in</strong>ually outpace that of <strong>the</strong> US. This wasn’t<strong>the</strong> case; <strong>in</strong>vestment spend<strong>in</strong>g slowed and anygrowth that has been achieved over <strong>the</strong> last twodecades has only been achieved by technologicalprogress (Chart 12).12. Japan’s experience highlights <strong>the</strong> dim<strong>in</strong>ish<strong>in</strong>gcontribution to growth by labour and capital% Japan%121086420-21960s 1970s 1980s 1990s 2000sCapital Labour Technological progressSource: Technological progress is calculated as <strong>the</strong> residual us<strong>in</strong>g <strong>the</strong> cobb-douglasproduction function<strong>The</strong> same is true of <strong>the</strong> growth seen <strong>in</strong> some of <strong>the</strong>o<strong>the</strong>r Asian tigers – as <strong>in</strong>come per capita rose,growth has slowed (Charts 13-15).121086420-211
EconomicsGlobal4 January 2011abc13. Growth rates slow as economies develop as seen <strong>in</strong> Japan…16. A whole new bunch of economies are improv<strong>in</strong>g <strong>the</strong>irrelative standard of liv<strong>in</strong>g15Japan% Per capita <strong>in</strong>come relativ e to US %1010Real GDP Growth1050-50 5,000 10,000 15,000 20,000 25,000Real GDP per capita864201960 1966 1972 1978 1984 1990 1996 2002 2008Indonesia Brazil Ch<strong>in</strong>a India86420Source: <strong>World</strong> Bank, <strong>HSBC</strong> CalculationsSource: <strong>World</strong> Bank and <strong>HSBC</strong> calculations14. …South Korea…South Ko rea15Real GDP Growth1050-5-100 5,000 10,000 15,000 20,000 25,000Real GDP pe r capitaSource: <strong>World</strong> Bank, <strong>HSBC</strong> Calculations15. …and TaiwanReal GDP GrowthTaiwan20151050Of course, many of <strong>the</strong> new economies are so farfrom reach<strong>in</strong>g developed status that <strong>the</strong>seconstra<strong>in</strong>ts will not kick <strong>in</strong> for some time. Just lookat <strong>the</strong> axis on Chart 16. Despite rapid growth,<strong>in</strong>come per capita <strong>in</strong> Ch<strong>in</strong>a, <strong>in</strong> constant dollar terms,is currently just 6% of that seen <strong>in</strong> <strong>the</strong> US. In India,<strong>in</strong>come per capita is just 2% of that <strong>in</strong> <strong>the</strong> US.<strong>The</strong> fact that <strong>the</strong>se economies have a long way to go<strong>in</strong> <strong>the</strong>ir development is also clear when we look at<strong>the</strong> sectoral breakdown. As economies develop, <strong>the</strong>ybecome more efficient at produc<strong>in</strong>g basic goods. Soonce you’ve got a tractor it’s much easier to produce<strong>the</strong> food you need and you can concentrate yourresources <strong>in</strong> produc<strong>in</strong>g o<strong>the</strong>r goods and services.This is what we tend to call mov<strong>in</strong>g up <strong>the</strong> valueaddedcha<strong>in</strong> (Chart 18).-50 5,000 10,000 15,000 20,000 25,000Real GDP per capitaSource: <strong>World</strong> Bank, <strong>HSBC</strong> Calculations12
EconomicsGlobal4 January 2011abc17. <strong>The</strong> fastest grow<strong>in</strong>g economies are still very early <strong>in</strong> <strong>the</strong>ir stage of development20%Agricultural output as % of GDP20%15%15%10%10%5%5%0%0%IndiaIndonesiaCh<strong>in</strong>aTurkeyBrazilRussiaPolandMexicoSpa<strong>in</strong>AustraliaS. KoreaCanadaItalyFranceNe<strong>the</strong>rlandsJapanUSSwitzerlandGermanyUKSource: <strong>World</strong> Bank, <strong>HSBC</strong>18. <strong>The</strong> more capital you acquire <strong>the</strong> less you need to devoteto agricultural production19. 40% of Ch<strong>in</strong>a’s workforce is still work<strong>in</strong>g <strong>in</strong> primary <strong>in</strong>dustryGDP per capita500004000030000200001000000.0% 5.0% 10.0% 15.0% 20.0%% GDP from ag riculture%806040200Share of employ ment w ith<strong>in</strong> primary <strong>in</strong>dustry %8060402000 5 10 15 20 25Real GDP per capita, cha<strong>in</strong>ed 1990 USD'000sUS Japan Ch<strong>in</strong>aSource: <strong>World</strong> Bank, <strong>HSBC</strong>Source: IMF and <strong>HSBC</strong> calculationsAs such, <strong>the</strong> expansion <strong>in</strong>to o<strong>the</strong>r <strong>in</strong>dustries meansthat <strong>in</strong> <strong>the</strong> G7 on average, agricultural production isnow less than 3% of all goods produced.In Ch<strong>in</strong>a, 12% of output is still agriculturalproduction (Chart 17) but perhaps more strik<strong>in</strong>gly,it requires 40% of its work<strong>in</strong>g population todeliver this (Chart 19). This highlights how <strong>the</strong>automation of food production and <strong>the</strong> ability ofworkers to move towards o<strong>the</strong>r forms ofproduction – <strong>the</strong> ‘urbanisation’ of <strong>the</strong> workforce –still has a long way to go.<strong>The</strong> employment statistics are less reliable foro<strong>the</strong>r economies. But given around 18% of output<strong>in</strong> India is still agricultural, a similar story willhold. <strong>The</strong>re are still a lot more resources to be puttowards more productive use (Chart 17).13
EconomicsGlobal4 January 2011abc<strong>The</strong> model <strong>economy</strong>To test <strong>the</strong> reliability of <strong>the</strong> model, we started bytak<strong>in</strong>g <strong>the</strong> economic <strong>in</strong>frastructure <strong>in</strong> 2000 andcreat<strong>in</strong>g projections for 2000-2010 and weresatisfied with <strong>the</strong> results. Fur<strong>the</strong>r details of <strong>the</strong> modeland all <strong>the</strong> results are discussed <strong>in</strong> Appendix 1.To simplify <strong>the</strong> analysis, we are work<strong>in</strong>g <strong>in</strong>constant 2000 US dollar terms. Fur<strong>the</strong>rappreciation of emerg<strong>in</strong>g-market currenciesaga<strong>in</strong>st <strong>the</strong> dollar will extend <strong>the</strong> conclusions ofthis report. We consider <strong>the</strong> top 40 so that we cansee who is com<strong>in</strong>g up <strong>the</strong> chart to enter <strong>the</strong> top 30,but it is perfectly feasible that some economiesoutside of <strong>the</strong> top 40 might demonstrate suchimpressive growth that <strong>the</strong>y leapfrog many placesto reach <strong>the</strong> Top 30. Our economics team <strong>in</strong> Asiabelieve <strong>the</strong> Philipp<strong>in</strong>es may be one such example.We had to draw <strong>the</strong> l<strong>in</strong>e somewhere, but this is animportant caveat to our f<strong>in</strong>al list.To get to our base case projections, we consideredtwo scenarios. <strong>The</strong> first assumes that <strong>the</strong>‘economic <strong>in</strong>frastructure’ is fixed at that evidenttoday. But to constra<strong>in</strong> <strong>the</strong>se economies to notmak<strong>in</strong>g any improvements would be unfair. Forexample, <strong>the</strong>re is a clear trend that educationstandards are improv<strong>in</strong>g (Chart 20).20. EM is mak<strong>in</strong>g progress <strong>in</strong> improv<strong>in</strong>g its economic<strong>in</strong>frastructure, enhanc<strong>in</strong>g its long-run potential1510Number of School Years1510So we <strong>the</strong>n consider a second scenario, <strong>in</strong> whichwe assume that over <strong>the</strong> next 40 years, alleconomies reach <strong>the</strong> ‘optimal’ economic<strong>in</strong>frastructure. This is <strong>the</strong> highest possible level ofachievement from any of <strong>the</strong> countries <strong>in</strong> oursample. For example, everyone br<strong>in</strong>gs educationstandards up to that of <strong>the</strong> best <strong>in</strong> class (Norway),everyone improves rule of law to <strong>the</strong> highestpossible score of 1, etc.<strong>The</strong> results of <strong>the</strong>se two scenarios are shown <strong>in</strong><strong>the</strong> appendix. Our base case scenario sits between<strong>the</strong>se two options. Essentially, each country getshalf way <strong>the</strong>re <strong>in</strong> improv<strong>in</strong>g its imperfections.<strong>The</strong>re are many reasons that such a rosy outlookwill not pan out, which we discuss <strong>in</strong> <strong>the</strong> f<strong>in</strong>alsection, but for now we assume government willcont<strong>in</strong>ue to progress ra<strong>the</strong>r than regress <strong>in</strong> <strong>the</strong>ireconomic policies.And of course <strong>the</strong> economic <strong>in</strong>frastructure coulddevelop even more quickly than forecast. Turkeyis one example. Follow<strong>in</strong>g <strong>the</strong> worst f<strong>in</strong>ancialcrisis <strong>in</strong> Turkey's history <strong>in</strong> 2001, <strong>the</strong> rul<strong>in</strong>gadm<strong>in</strong>istration embarked on an impressivepolitical, constitutional and economic reformagenda, which was eventually rewarded with <strong>the</strong>formal launch of accession negotiations with <strong>the</strong>European Union <strong>in</strong> 2006. We expect thisimprov<strong>in</strong>g domestic political stability to beacknowledged by an "<strong>in</strong>vestment grade" status forTurkey <strong>in</strong> 2011. For this reason, we have raisedTurkey’s democracy rat<strong>in</strong>g to equal that ofMalaysia (an <strong>in</strong>dex level of 0.5).505075 80 85 90 95 00 05 10Russia Ch<strong>in</strong>a BrazilIndiaUSSource: www.BarroLee.com14
EconomicsGlobal4 January 2011abc21. Def<strong>in</strong><strong>in</strong>g <strong>the</strong> 'economic <strong>in</strong>frastructure'Income per capita(Constant 2000 USD)Average years ofmale school<strong>in</strong>gLifeexpectancyFertilityRule ofLawGovernmentconsumption (% GDP)DemocracyIndexInflationRate (%)Australia 26243 (16) 12.1 (3) 81 (6) 1.9 (16) 0.92 (8) 16.9 (22) 1.0 (1) 2.83 (19)Austria 26455 (13) 9.53 (27) 80 (12) 1.4 (34) 1.0 (1) 18.2 (17) 1.0 (1) 1.96 (32)Belgium 24758 (18) 10.5 (14) 80 (15) 1.8 (23) 0.83 (11) 23.1 (6) 1.0 (1) 2.08 (30)Canada 26335 (15) 11.3 (9) 80 (10) 1.6 (28) 0.91 (10) 19.3 (13) 1.0 (1) 1.60 (36)Denmark 31418 (9) 10.0 (19) 78 (21) 1.8 (20) 1.0 (1) 26.5 (1) 1.0 (1) 2.14 (28)F<strong>in</strong>land 27150 (12) 9.97 (20) 79 (20) 1.8 (22) 1.0 (1) 22.3 (7) 1.0 (1) 2.19 (26)France 23881 (19) 10.5 (15) 81 (5) 1.9 (15) 0.83 (11) 23.1 (5) 1.0 (1) 1.46 (38)Germany 25082 (17) 11.8 (5) 80 (16) 1.3 (36) 0.83 (11) 18.0 (18) 1.0 (1) 1.74 (35)Greece 14382 (23) 10.6 (13) 79 (17) 1.5 (29) 0.75 (22) 17.0 (20) 1.0 (1) 2.75 (20)Ireland 27964 (10) 11.6 (6) 78 (22) 2.1 (13) 1.0 (1) 15.9 (25) 1.0 (1) 1.48 (37)Italy 18702 (20) 9.50 (28) 81 (4) 1.4 (33) 0.66 (29) 20.2 (9) 1.0 (1) 1.98 (31)Japan 39434 (3) 11.5 (7) 82 (1) 1.3 (37) 0.83 (11) 17.9 (19) 1.0 (1) 0.02 (40)Ne<strong>the</strong>rlands 26375 (14) 11.0 (12) 80 (14) 1.7 (26) 1.0 (1) 25.0 (3) 1.0 (1) 1.76 (34)Norway 40933 (2) 12.2 (1) 80 (12) 1.9 (17) 1.0 (1) 19.2 (14) 1.0 (1) 2.22 (25)Spa<strong>in</strong> 15698 (22) 10.3 (16) 81 (8) 1.4 (32) 0.83 (11) 19.2 (15) 1.0 (1) 2.15 (27)Sweden 31777 (8) 11.5 (8) 81 (7) 1.9 (19) 1.0 (1) 25.9 (2) 1.0 (1) 1.79 (33)Switzerland 38738 (4) 9.87 (22) 82 (3) 1.4 (31) 0.83 (11) 10.5 (37) 1.0 (1) 0.89 (39)UK 27646 (11) 9.59 (26) 79 (18) 1.9 (18) 0.92 (8) 21.7 (8) 1.0 (1) 2.57 (22)US 36354 (6) 12.2 (2) 78 (22) 2.1 (13) 0.83 (11) 15.8 (26) 1.0 (1) 2.11 (29)Developed 27860 10.86 80 1.7 0.9 19.8 1.0 1.9Egypt 3002. (34) 8.76 (31) 70 (36) 2.8 (3) 0.58 (31) 20.0* (36) 0.17 (34) 13 (3)Iran 2138 (38) 9.92 (21) 71 (34) 1.8 (25) 0.67 (25) 11.1 (35) 0.17 (34) 18.7 (2)Israel 37005 (5) 11.3 (10) 81 (9) 2.9 (2) 0.67 (25) 24.2 (4) 1.0 (1) 3.23 (17)Poland 6562. (26) 9.87 (23) 75 (24) 1.3 (35) 0.75 (22) 19.4 (12) 1.0 (1) 3.55 (14)Russia 2934 (35) 9.68 (25) 67 (38) 1.4 (30) 0.67 (25) 16.9 (21) 0.17 (34) 11.5 (4)Saudi Arabia 9832 (25) 10.3 (17) 73 (29) 3.1 (1) 0.83 (11) 19.6 (10) 0 (38) 6.36 (10)South Africa 3710 (31) 8.55 (32) 51 (40) 2.5 (7) 0.41 (35) 19.1 (16) 0.83 (22) 8.58 (5)Turkey 5087 (29) 7.01 (38) 71 (33) 2.1 (12) 0.75 (22) 12.8 (30) 0.5 (31) 8.48 (7)CEEMEA 8784 9.43 70 2.3 0.7 16.8 0.5 9.2Ch<strong>in</strong>a 2396 (37) 9.80 (24) 73 (28) 1.7 (27) 0.83 (19) 12.9 (29) 0 (38) 3.30 (16)Hong Kong 35202 (7) 11.0 (11) 82 (1) 1.0 (40) 0.42 (33) 8.32 (40) 0.33 (31) 2.27 (24)India 790 (40) 6.65 (39) 63 (39) 2.7 (4) 0.67 (25) 11.7 (33) 0.5 (28) 8.53 (6)Indonesia 1178 (39) 6.24 (40) 70 (35) 2.1 (11) 0.5 (32) 8.41 (39) 0 (38) 7.00 (9)Malaysia 5223 (28) 10.1 (18) 74 (25) 2.5 (5) 0.66 (29) 12.2 (32) 0.5 (28) 2.68 (21)S. Korea 16462 (21) 11.8 (4) 79 (19) 1.1 (39) 0.83 (19) 15.2 (27) 0.83 (22) 3.34 (15)S<strong>in</strong>gapore 45957 (1) 9.1 (30) 80 (11) 1.2 (38) 0.83 (19) 10.0 (38) 0.33 (31) 3 (18)Thailand 2743 (36) 7.49 (36) 68 (37) 1.8 (24) 0.42 (33) 12.4 (31) 0.17 (34) 2.28 (23)Asia 13744 9.05 74 1.8 0.6 11.4 0.3 4.1Argent<strong>in</strong>a 10516 (24) 9.34 (29) 73 (26) 2.2 (10) 0.41 (35) 13.4 (28) 0.83 (22) 7.89 (8)Brazil 4710 (30) 7.63 (35) 72 (32) 1.8 (21) 0.33 (37) 19.4 (11) 0.83 (22) 4.72 (13)Colombia 3051 (32) 7.69 (33) 72 (30) 2.4 (8) 0.33 (37) 16.3 (23) 0.67 (26) 5.58 (11)Colombia 3051 (32) 7.69 (33) 72 (30) 2.4 (8) 0.33 (37) 16.3 (23) 0.67 (26) 5.58 (11)Venezuela 5437 (27) 7.02 (37) 73 (27) 2.5 (6) 0.16 (40) 11.5 (34) 0.5 (28) 26.2 (1)LATAM 5354 7.88 73 2.3 0.3 15.4 0.7 10.0Overall 18002 9.79 76.1 1.9 0.7 16.9 0.7 4.9Note: *We were unable to reconcile <strong>the</strong> <strong>World</strong> Bank data on Egyptian government consumption and thus replaced it with <strong>the</strong> national source. **We have altered <strong>the</strong> level of democracy based on our judgment about recent improvements(see text). <strong>The</strong> 2009 Gastil estimate is 0.33. Source: See table below.Data descriptionVariable Description SourceAverage years of male school<strong>in</strong>g <strong>The</strong> average number of years spent <strong>in</strong> education by males <strong>in</strong> 2010 www.barrolee.comLife expectancy <strong>The</strong> life expectancy of total population <strong>in</strong> 2008; natural log taken. <strong>World</strong> BankFertility <strong>The</strong> number of births per woman <strong>in</strong> 2008; natural log taken <strong>World</strong> BankRule of lawAn <strong>in</strong>dex between 0 and 1 which measures <strong>the</strong> attractiveness of <strong>the</strong> <strong>in</strong>vestment climate based Political Risk Services Internationalon <strong>the</strong> level of law enforcement, contract sanctity and property rights. Data for 2009Country Risk GuideGovernment consumption Percentage of GDP accounted for by government consumption <strong>in</strong> 2008. <strong>World</strong> BankDemocracy <strong>in</strong>dexAn <strong>in</strong>dicator of political rights, orig<strong>in</strong>ally compiled by Gastil from 1972-1994. It measures <strong>the</strong> Freedom House political rights <strong>in</strong>dexright of all adults to vote and compete for public office and to have a decisive vote on publicpolicies. Measured between 0 and 1, where 1 represents a full democracy.Inflation rate CPI Inflation (% year);average 2004-2007. <strong>World</strong> BankSource: <strong>HSBC</strong>15
EconomicsGlobal4 January 2011abcTable 23 us<strong>in</strong>g, <strong>the</strong> <strong>in</strong>puts <strong>in</strong> Table 21, show <strong>the</strong>model’s base scenario projections for per capitagrowth.<strong>The</strong>re is a relatively narrow range for <strong>in</strong>come percapita growth <strong>in</strong> <strong>the</strong> developed world, which rangefrom 0.5% <strong>in</strong> Sweden and Norway (although notcaptur<strong>in</strong>g natural resources, Norway’s full potentialmay be underestimated) to 2.6% <strong>in</strong> Switzerland.<strong>The</strong> differences can largely be accounted for byvariations <strong>in</strong> school<strong>in</strong>g and size of government,which acts as a drag on real activity. If a country isalready rich for its given <strong>in</strong>frastructure (such as <strong>the</strong>US), this will constra<strong>in</strong> fur<strong>the</strong>r growth. So growth <strong>in</strong>per capita <strong>in</strong>come <strong>in</strong> <strong>the</strong> US is lower than o<strong>the</strong>rdeveloped-world economies. <strong>The</strong> model isessentially say<strong>in</strong>g that its education and o<strong>the</strong>r<strong>in</strong>frastructure variables barely justify <strong>the</strong> level of<strong>in</strong>come per capita, so future growth is constra<strong>in</strong>ed.22. Western government’s have become bloated <strong>in</strong> recentdecades% po<strong>in</strong>ts 1970 - 2 007% po<strong>in</strong>ts1086420-2-4USCanadaGermanyChange <strong>in</strong> gov ernment ex penditure as a % of GDPSource: <strong>World</strong> Bank, <strong>HSBC</strong> calculationsUKAustraliaItalyDenmarkNe<strong>the</strong>rlandsFranceSpa<strong>in</strong>1086420-2-4But on our assumptions, it is not just <strong>the</strong>develop<strong>in</strong>g world that is sort<strong>in</strong>g its policyimperfections. <strong>The</strong> developed world also improvesits economic foundations <strong>in</strong> part by revers<strong>in</strong>g someof <strong>the</strong> rise <strong>in</strong> government spend<strong>in</strong>g seen over <strong>the</strong>previous four decades <strong>in</strong> many of <strong>the</strong> Westerneconomies (Chart 22), although we accept thatage<strong>in</strong>g populations will make this a challenge.This expla<strong>in</strong>s why growth <strong>in</strong> <strong>the</strong> developed worldaccelerates through <strong>the</strong> forecast horizon.23. <strong>The</strong> model's per capita growth projections___ Average annual per capita growth <strong>in</strong> 2000USD2010-20 2020-30 2030-40 2040-50US 0.6% 1.1% 1.5% 1.8%Japan 1.3% 1.6% 1.9% 2.0%Ch<strong>in</strong>a 6.5% 5.7% 5.1% 4.6%Germany 2.1% 2.2% 2.3% 2.4%UK 1.4% 1.6% 1.8% 2.0%France 1.2% 1.5% 1.8% 2.1%Italy 1.6% 2.4% 2.5% 2.7%India 4.0% 4.5% 4.8% 5.1%Brazil 2.2% 2.7% 3.1% 3.5%Canada 1.9% 2.1% 2.2% 2.3%S. Korea 3.7% 3.4% 3.1% 3.0%Spa<strong>in</strong> 2.4% 3.1% 3.0% 2.9%Mexico 2.1% 3.9% 3.7% 3.6%Australia 1.8% 2.0% 2.1% 2.2%Ne<strong>the</strong>rlands 1.3% 1.6% 1.9% 2.1%Argent<strong>in</strong>a 2.4% 2.6% 2.7% 2.8%Russia 5.1% 4.8% 4.6% 4.4%Turkey 4.0% 3.9% 3.8% 3.7%Sweden 0.5% 1.1% 1.6% 1.9%Switzerland 2.6% 2.4% 2.2% 2.1%Indonesia 3.0% 3.7% 4.2% 4.7%Belgium 1.2% 1.5% 1.9% 2.1%Saudi Arabia 2.0% 2.2% 2.4% 2.6%Poland 4.0% 3.9% 3.8% 3.7%Hong Kong 3.0% 2.7% 2.6% 2.5%Austria 2.7% 2.6% 2.5% 2.4%Norway 0.5% 1.1% 1.5% 1.7%South Africa 1.1% 1.9% 2.6% 3.3%Thailand 3.7% 4.0% 4.1% 4.2%Denmark 0.6% 1.1% 1.5% 1.8%Israel -1.3% 0.3% 1.0% 1.6%S<strong>in</strong>gapore 3.6% 3.2% 2.7% 2.3%Greece 3.1% 3.0% 2.9% 2.9%Iran 3.5% 3.5% 3.5% 3.5%Egypt 2.8% 4.0% 4.2% 4.3%Venezuela 1.4% 2.0% 2.5% 3.0%Malaysia 5.4% 4.6% 4.1% 3.6%F<strong>in</strong>land 1.6% 1.8% 1.9% 2.1%Colombia 3.0% 3.3% 3.6% 3.8%Ireland 1.9% 2.0% 2.0% 2.1%Source: Barro and <strong>HSBC</strong>Non-Japan Asia produces a diversified crop. Wesplit <strong>the</strong>se <strong>in</strong>to three broad groups, <strong>the</strong> ‘good<strong>in</strong>frastructure poor’, <strong>the</strong> ‘good <strong>in</strong>frastructure rich’and <strong>the</strong> ‘poor <strong>in</strong>frastructure poor’. <strong>The</strong> ‘good<strong>in</strong>frastructure poor’ group conta<strong>in</strong>s Ch<strong>in</strong>a andMalaysia. <strong>The</strong>se economies all have goodfoundations <strong>in</strong> that <strong>the</strong> education levels arereasonably high, <strong>the</strong>y have a good rule of law andmonetary stability and relatively low fertility rates.<strong>The</strong>se economies are <strong>the</strong>refore expected to convergerelatively quickly.<strong>The</strong> ‘good <strong>in</strong>frastructure rich’ <strong>in</strong>cludes HongKong and S<strong>in</strong>gapore and to a lesser extent South16
EconomicsGlobal4 January 2011abcKorea. <strong>The</strong>se economies already have high<strong>in</strong>come per capita relative to <strong>the</strong> rest of <strong>the</strong> region.However, <strong>the</strong>se economies score highly fromhav<strong>in</strong>g a small government and a comb<strong>in</strong>ation oflow democracy but strong rule of law.<strong>The</strong> ‘poor <strong>in</strong>frastructure poor’ <strong>in</strong>clude India,Indonesia and Thailand. <strong>The</strong>se economiescurrently have low levels of education and scoreless highly for rule of law and monetary stability.However, school levels are improv<strong>in</strong>g and weaccount for fur<strong>the</strong>r improvement over our forecasthorizon. <strong>The</strong>refore while <strong>the</strong>se countries start offwith less impressive growth rates, <strong>the</strong>ir growthrates accelerate through <strong>the</strong> forecast horizon.As a group, LATAM fails to achieve <strong>the</strong> <strong>in</strong>comeper capita growth rates seen by <strong>the</strong> star performers<strong>in</strong> Asia. In general, <strong>the</strong> education rates are loweracross <strong>the</strong> region and a low score for rule of lawplays a significant role <strong>in</strong> restra<strong>in</strong><strong>in</strong>g growth. <strong>The</strong>rule of law <strong>in</strong>dex averages just 0.4 on average <strong>in</strong><strong>the</strong> region which is half that of <strong>the</strong> star performers<strong>in</strong> Asia. This reduces <strong>the</strong> annual per capita growthrate by 1%. <strong>The</strong> region also still suffers from alack of monetary stability, although <strong>the</strong>re aresignificant differences across LATAM.Brazil’s relatively low growth rate is <strong>the</strong> one thatmost stands out, relative to expectations, andcerta<strong>in</strong>ly relevant to recent growth rates. In thismodel, <strong>the</strong> low level of school<strong>in</strong>g acts as a majorconstra<strong>in</strong>t. Of course, what <strong>the</strong> model is notcaptur<strong>in</strong>g is <strong>the</strong> natural resources that Brazil hasand how, enhanced by its trade l<strong>in</strong>ks with Ch<strong>in</strong>a,this has spurred growth. <strong>The</strong> model is quitepossibly understat<strong>in</strong>g Brazil’s growth potential.On <strong>the</strong> model, Mexico would have <strong>the</strong> strongestgrowth rate <strong>in</strong> <strong>the</strong> LATAM region as it hasrelatively high levels of school<strong>in</strong>g, and lowgovernment <strong>in</strong>terference. It suffers on rule of law,but no more than Brazil. However, at present atleast, <strong>the</strong> North American Free Trade Agreementhas seen <strong>the</strong> majority of Mexican exports travel to<strong>the</strong> US. As such, Mexican growth is extremelywell correlated with US growth and per capita<strong>in</strong>come has failed to grow at <strong>the</strong> pace <strong>the</strong> modelwould have forecast. <strong>The</strong>refore for <strong>the</strong> first 10years we have restricted Mexican per capitagrowth to be between that delivered by <strong>the</strong> modeland that which we expect for <strong>the</strong> US. <strong>The</strong> percapita growth projections <strong>in</strong> LATAM also sufferdue to high rates of fertility. Of course, when westart to look at total growth rates, LATAM willget a significant boost for this very reason.CEEMEA is already a very diverse region.Israel’s <strong>in</strong>come per capita is already above that of<strong>the</strong> US and this year it jo<strong>in</strong>ed <strong>the</strong> OECD.Outside of Israel, Russia has a good level ofschool<strong>in</strong>g and low fertility which offsets <strong>the</strong>relatively low score for rule of law and democracy.Poland scores much more highly on all counts.Turkey and Egypt lag <strong>in</strong> terms of <strong>in</strong>frastructure withreasonably low levels of education. South Africa’soutlook is constra<strong>in</strong>ed by <strong>the</strong> extremely low lifeexpectancy related to <strong>the</strong> AIDS pandemic. At just 51years, this knocks 1.5% po<strong>in</strong>ts off <strong>the</strong> growthprojections, relative to Turkey. One hopes that asolution to this disease is found over our timehorizon, which should <strong>the</strong>n serve to boost SouthAfrica’s growth rate significantly.In <strong>the</strong> context of <strong>the</strong> model, with a good level ofeducation, Iran would produce good growth rates.However, <strong>the</strong> backcast<strong>in</strong>g exercise shows that Iranhas failed to achieve this. Poor relations with <strong>the</strong>rest of <strong>the</strong> world and <strong>the</strong> trade and capitalsanctions likely play a key role here. This justshows how <strong>the</strong> model cannot capture all of <strong>the</strong>issues, and Iran is <strong>the</strong> one country where wehaven’t taken <strong>the</strong> model’s forecast but havereplaced it with <strong>the</strong> past growth rate.17
EconomicsGlobal4 January 2011abcDemographic challenges Differences <strong>in</strong> <strong>the</strong> demographics alone could expla<strong>in</strong> as much as2.5% po<strong>in</strong>ts <strong>in</strong> GDP growth differentials <strong>in</strong> <strong>the</strong> com<strong>in</strong>g decadesSo far, we have established how <strong>the</strong> economicconditions will affect how much an <strong>in</strong>dividual willbe able to produce. But this is only part of <strong>the</strong>story. <strong>The</strong> number of people be<strong>in</strong>g put to workwill vary substantially across economies <strong>in</strong> <strong>the</strong>com<strong>in</strong>g years.24. <strong>The</strong> performance of Japan <strong>in</strong> <strong>the</strong> ‘lost decades’ doesn’tlook as bad when demographic trends are accounted for%Yr6420-2-4-690 92 94 96 98 00 02 04 06 08USSource: <strong>World</strong> Bank and <strong>HSBC</strong> calculationsGDP per capitaJapan%YrDemographics matter but are often ignored. Peopleoften put <strong>the</strong> stagnation of Japan relative to o<strong>the</strong>rdeveloped nations down to <strong>the</strong> deleverag<strong>in</strong>g after<strong>the</strong> asset bubbles of <strong>the</strong> late 1980s. While this hasundoubtedly played a role, <strong>the</strong> demographic <strong>shift</strong>that has taken place expla<strong>in</strong>s at least some of thisrelative performance (Chart 24).Table 25 highlights how each country’s work<strong>in</strong>gpopulation is expected to grow on average <strong>in</strong> eachdecade. <strong>The</strong>se projections are taken from <strong>the</strong> UN.6420-2-4-625. Demographic challenges will be a significant drag on growth<strong>in</strong> some areas__ Average Yearly Work<strong>in</strong>g Population Growth % _2010-20 2020-30 2030-40 2040-50US 0.5% 0.3% 0.4% 0.3%Japan -0.9% -0.7% -1.4% -1.2%Ch<strong>in</strong>a 0.2% -0.1% -0.7% -0.5%Germany -0.4% -1.1% -1.0% -0.7%UK 0.2% 0.1% 0.2% 0.3%France -0.1% -0.1% -0.2% 0.0%Italy -0.2% -0.6% -1.1% -0.6%India 1.7% 1.2% 0.7% 0.1%Brazil 1.1% 0.2% -0.2% -0.7%Canada 0.4% 0.0% 0.4% 0.3%S. Korea 0.0% -1.0% -1.3% -1.3%Spa<strong>in</strong> 0.4% -0.1% -0.7% -0.7%Mexico 1.2% 0.5% -0.3% -0.5%Australia 0.6% 0.4% 0.4% 0.4%Ne<strong>the</strong>rlands -0.2% -0.5% -0.4% 0.1%Argent<strong>in</strong>a 1.0% 0.8% 0.4% -0.1%Russia -0.9% -0.8% -0.6% -1.1%Turkey 1.4% 0.7% 0.2% -0.2%Sweden -0.1% 0.1% 0.1% 0.2%Switzerland 0.0% -0.3% -0.2% 0.2%Indonesia 1.3% 0.6% 0.0% -0.2%Belgium -0.1% -0.3% -0.2% 0.0%Saudi Arabia 2.6% 1.7% 1.1% 0.6%Poland -0.8% -0.7% -0.7% -1.5%Hong Kong 0.2% -0.6% -0.2% -0.3%Austria 0.0% -0.6% -0.6% -0.3%Norway 0.4% 0.2% 0.1% 0.3%South Africa 0.4% 0.5% 0.4% 0.2%Thailand 0.3% -0.2% -0.3% -0.3%Denmark -0.2% -0.3% -0.4% 0.2%Israel 1.4% 1.2% 0.8% 0.5%S<strong>in</strong>gapore 0.2% -1.1% -0.7% -0.3%Greece -0.2% -0.4% -0.8% -0.8%Iran 1.0% 0.9% 0.3% -0.7%Egypt 1.9% 1.6% 1.1% 0.5%Venezuela 1.7% 1.2% 0.8% 0.3%Malaysia 1.7% 1.1% 0.7% 0.2%F<strong>in</strong>land -0.5% -0.3% 0.0% -0.2%Colombia 1.5% 0.9% 0.5% 0.2%Ireland 0.9% 0.9% 0.2% -0.1%Source: UN and <strong>HSBC</strong> Calculations18
EconomicsGlobal4 January 2011abcIn <strong>the</strong> com<strong>in</strong>g decade, average GDP growthshould be 1.5% po<strong>in</strong>ts higher <strong>in</strong> <strong>the</strong> US than <strong>in</strong>Japan based on <strong>the</strong> demographics alone. India’sGDP growth should be more than 2.5% po<strong>in</strong>tshigher than Japan’s for this reason.Perhaps <strong>the</strong> most strik<strong>in</strong>g way to see what’s go<strong>in</strong>gon is to look at <strong>the</strong> total change over <strong>the</strong> whole40-year period (Chart 26).Japan’s workforce will shr<strong>in</strong>k by a whopp<strong>in</strong>g37%. South Korea’s demographic outlook isn’t alot better, fall<strong>in</strong>g by 32%. S<strong>in</strong>gapore, Ch<strong>in</strong>a andSouth Korea will also see more than double-digitdecl<strong>in</strong>es <strong>in</strong> total work<strong>in</strong>g population.<strong>The</strong> outlook for work<strong>in</strong>g population <strong>in</strong> parts ofEurope is similarly challeng<strong>in</strong>g, particularly <strong>in</strong>Russia, Poland and Germany.On <strong>the</strong> o<strong>the</strong>r side of <strong>the</strong> spectrum, Saudi Arabia,with <strong>the</strong> highest fertility rate, gets a significantboost to growth with <strong>the</strong> work<strong>in</strong>g populationexpected to growth by more than 70%. Egypt isn’tfar beh<strong>in</strong>d. Certa<strong>in</strong> parts of Asia – Malaysia,India, and Indonesia – will all see strong growth<strong>in</strong> <strong>the</strong>ir workforce.26. <strong>The</strong> outlook for work<strong>in</strong>g population is vastly different across economiesSaudiEgy ptIsraelVenezuelaMalay siaIndiaColombiaArgent<strong>in</strong>aTurkeyIrelandAustraliaIndonesiaSouthUSIranCanadaNorwayMexicoUKBrazilSw edenSwitzerlandFranceThailandBelgiumDenmarkNe<strong>the</strong>rlandHong KongF<strong>in</strong>landCh<strong>in</strong>aSpa<strong>in</strong>AustriaS<strong>in</strong>gaporeGreeceItalyGermanyRussiaS. KoreaPolandJapan-4 0 -15 10 35 60% change <strong>in</strong> w ork<strong>in</strong>g population betw een 2010 and <strong>2050</strong>Source: UN projections, <strong>HSBC</strong> calculations19
EconomicsGlobal4 January 2011abc27. Total population growth decl<strong>in</strong>es over time… 28…but <strong>the</strong> downturn is even more stark <strong>in</strong> work<strong>in</strong>g populationAv erage annual population grow th 2010-<strong>2050</strong>Work<strong>in</strong>g population growth 2010-<strong>2050</strong>1.5%1.5%1.5%1.5%1.0%1.0%1.0%1.0%0.5%0.5%0.5%0.5%0.0%0.0%0.0%0.0%-0.5%-0.5%-0.5%-0.5%2010-2020 2020-2030 2030-2040 2040-<strong>2050</strong>2010-2020 2020-2030 2030-2040 2040-<strong>2050</strong>Dev eloped CEEMEA LATAM Asia ex . JapanDev eloped CEEMEA LATAM Asia ex . JapanSource: UN projections, simple averages of countries <strong>in</strong> our Top 30 <strong>in</strong> each regionSource: UN projections, simple averages of countries <strong>in</strong> our Top 30 <strong>in</strong> each regionLook<strong>in</strong>g at this on a regional basis, it’s clear thatwhile population growth is set to slowsignificantly across <strong>the</strong> world (Chart 27), <strong>the</strong>slowdown <strong>in</strong> work<strong>in</strong>g population is even greater(Chart 28). But <strong>the</strong>re is a large dispersion byregion. <strong>The</strong> work<strong>in</strong>g population <strong>in</strong> <strong>the</strong> developedworld will only grow for one more decade andbarely at that. CEEMEA, despite be<strong>in</strong>g draggeddown by Russia and Poland, has a better outlookthan <strong>the</strong> developed world but well below that of<strong>the</strong> o<strong>the</strong>r emerg<strong>in</strong>g regions.By far <strong>the</strong> best region, <strong>in</strong> terms of availableworkers, is LATAM due to <strong>the</strong> rate of fertilitywhich is still reasonably high, averag<strong>in</strong>g 2.1 birthsper woman.Of course <strong>the</strong>se work<strong>in</strong>g age projections aresubject to a considerable degree of uncerta<strong>in</strong>ty.<strong>The</strong> most morbid is disease, which could raise <strong>the</strong>mortality rate. By contrast, medical breakthroughscould lower <strong>the</strong> mortality rate.Immigration flows are ano<strong>the</strong>r feature which canthrow <strong>the</strong>se projections heavily off course.A perhaps more predictable deviation from <strong>the</strong>seprojections would be retirement ages. <strong>The</strong>se arealready ris<strong>in</strong>g <strong>in</strong> Western economies as people areliv<strong>in</strong>g longer and fund<strong>in</strong>g public pensions provestoo much of a burden on fiscal positions.<strong>The</strong>re could also be government <strong>in</strong>centives to try andraise <strong>the</strong> fertility rate. Russia has recently announceda scheme whereby couples produc<strong>in</strong>g three childrenor more are entitled to a certa<strong>in</strong> amount of land. Thisaga<strong>in</strong> highlights <strong>the</strong> uncerta<strong>in</strong>ty around forecast<strong>in</strong>gthis far <strong>in</strong> to <strong>the</strong> future.Charts show<strong>in</strong>g <strong>the</strong> demographic profile bycountry can be found <strong>in</strong> Appendix 2.20
EconomicsGlobal4 January 2011abcPutt<strong>in</strong>g everyth<strong>in</strong>gtoge<strong>the</strong>r Asia will cont<strong>in</strong>ue demonstrat<strong>in</strong>g extremely strong growth rates andthose with large populations will overtake Western powerhouses Lat<strong>in</strong> America will feature more heavily <strong>in</strong> <strong>the</strong> <strong>global</strong> league tables <strong>The</strong> league table losers – <strong>the</strong> small European countries – maystruggle to ma<strong>in</strong>ta<strong>in</strong> <strong>the</strong>ir <strong>in</strong>fluence <strong>in</strong> <strong>global</strong> policy forumsAdd<strong>in</strong>g our outlook for <strong>in</strong>come per capita to <strong>the</strong>demographic projections, we get to total growthrates found <strong>in</strong> Table 30. For <strong>the</strong> first 10 years, <strong>the</strong>breakdown <strong>in</strong>to per capita and workforce growthis shown <strong>in</strong> Chart 29.It will come as no surprise to see that Ch<strong>in</strong>a isnear <strong>the</strong> top of <strong>the</strong> growth table. But as <strong>in</strong>comeper capita rises and <strong>the</strong> one-child policy leads to ademographic headw<strong>in</strong>d, India’s growth rate soonovertakes that of Ch<strong>in</strong>a beyond 2030.But <strong>the</strong>re are o<strong>the</strong>r bright stars <strong>in</strong> Asia. Malaysia,Thailand and Indonesia all demonstrate rapid ratesof growth and as <strong>the</strong>ir education and policysystems develop, <strong>the</strong>se are likely to be susta<strong>in</strong>edover our forecast horizon.In CEEMEA, Russia is projected to cont<strong>in</strong>ue itsrapid expansion, but it scores fewer po<strong>in</strong>ts formonetary stability and has a less-supportivedemographic outlook than some of its Asianrivals, which limits its relative performance. Ofcourse, with <strong>the</strong> model not account<strong>in</strong>g for an29. Total growth broken <strong>in</strong>to per person output and workforce growthAv erage annual grow th 2010 to 20208%6%4%2%0%-2%8%6%4%2%0%-2%MalaysiaCh<strong>in</strong>aIndiaTurkeyEgyptSaudiIranColombiaIndonesiaRussiaThailandS<strong>in</strong>gaporeS. KoreaArgent<strong>in</strong>aMexicoBrazilPolandHongVenezuelaGreeceIrelandSpa<strong>in</strong>AustriaSwitzerlanAustraliaCanadaGermanyUKSouthItalyUSNe<strong>the</strong>rlanF<strong>in</strong>landFranceBelgiumNorwayDenmarkSwe denJapanIsraelPer Capita Grow thDemographicsSource: <strong>HSBC</strong> Calculations21
EconomicsGlobal4 January 2011abc<strong>economy</strong>’s natural resources, movements <strong>in</strong> <strong>the</strong>oil price could play a key role <strong>in</strong> send<strong>in</strong>g <strong>the</strong>seRussian projections off track. In <strong>the</strong> CEEMEAregion, Turkey and Egypt each look set for abetter run.Lat<strong>in</strong> America, helped by an encourag<strong>in</strong>gdemographic outlook also produces good growthrates. Colombia looks set to deliver <strong>the</strong> fastestgrowth rates <strong>in</strong> <strong>the</strong> LATAM region, although bynot account<strong>in</strong>g for Brazil’s natural resources, wemay be underestimat<strong>in</strong>g <strong>the</strong> potential pace ofgrowth <strong>in</strong> Brazil.As we step back and th<strong>in</strong>k about what ishappen<strong>in</strong>g, <strong>in</strong> essence <strong>the</strong>re have been structuralimprovements <strong>in</strong> <strong>the</strong> economic governance of<strong>the</strong>se economies. Assum<strong>in</strong>g governments cont<strong>in</strong>ueto improve on recent advances, <strong>in</strong>come per capitawill cont<strong>in</strong>ue to catch up with <strong>the</strong> levels seen <strong>in</strong><strong>the</strong> Western world. This is mak<strong>in</strong>g <strong>the</strong>m moreattractive <strong>in</strong>vestment dest<strong>in</strong>ations and such<strong>in</strong>vestment is lift<strong>in</strong>g <strong>in</strong>come per capita. And ifyou’re already large by population, you willbecome large <strong>in</strong> economic size.30. <strong>The</strong> model's total GDP projections2010-20 2020-30 2030-40 2040-50US 1.1% 1.4% 1.9% 2.1%Japan 0.4% 0.9% 0.5% 0.8%Ch<strong>in</strong>a 6.7% 5.5% 4.4% 4.1%Germany 1.7% 1.1% 1.4% 1.7%UK 1.6% 1.7% 1.9% 2.2%France 1.1% 1.4% 1.6% 2.1%Italy 1.4% 1.9% 1.5% 2.1%India 5.7% 5.6% 5.5% 5.2%Brazil 3.3% 2.9% 2.9% 2.8%Canada 2.3% 2.1% 2.6% 2.5%S. Korea 3.7% 2.3% 1.8% 1.7%Spa<strong>in</strong> 2.8% 2.9% 2.3% 2.2%Mexico 3.3% 4.4% 3.5% 3.1%Australia 2.4% 2.3% 2.5% 2.6%Ne<strong>the</strong>rlands 1.1% 1.2% 1.5% 2.2%Argent<strong>in</strong>a 3.4% 3.3% 3.1% 2.7%Russia 4.2% 4.0% 4.0% 3.3%Turkey 5.3% 4.7% 4.0% 3.5%Sweden 0.4% 1.3% 1.7% 2.1%Switzerland 2.6% 2.0% 2.0% 2.3%Indonesia 4.3% 4.3% 4.3% 4.5%Belgium 1.0% 1.2% 1.7% 2.1%Saudi Arabia 4.5% 3.9% 3.5% 3.2%Poland 3.3% 3.2% 3.1% 2.1%Hong Kong 3.2% 2.1% 2.4% 2.2%Austria 2.7% 1.9% 1.9% 2.1%Norway 0.9% 1.3% 1.5% 2.1%South Africa 1.5% 2.4% 3.1% 3.5%Thailand 4.0% 3.8% 3.8% 4.0%Denmark 0.5% 0.8% 1.1% 2.0%Israel 0.1% 1.6% 1.8% 2.1%S<strong>in</strong>gapore 3.7% 2.1% 2.0% 2.1%Greece 2.9% 2.6% 2.2% 2.1%Iran 4.5% 4.4% 3.8% 2.8%Egypt 4.7% 5.6% 5.2% 4.8%Venezuela 3.1% 3.2% 3.3% 3.3%Malaysia 7.1% 5.7% 4.7% 3.8%F<strong>in</strong>land 1.1% 1.4% 1.9% 1.9%Colombia 4.5% 4.2% 4.1% 4.0%Ireland 2.8% 2.8% 2.2% 1.9%Source: Barro and <strong>HSBC</strong>22
EconomicsGlobal4 January 2011abcTak<strong>in</strong>g a look at <strong>the</strong> <strong>global</strong> leaderboard <strong>in</strong> <strong>2050</strong>and compare that to how it stands today (Table 31- order <strong>in</strong> 1970 <strong>in</strong>cluded for illustration), <strong>the</strong> USmay <strong>the</strong>n f<strong>in</strong>d its ego somewhat bruised by fall<strong>in</strong>goff <strong>the</strong> top spot but it will, of course, rema<strong>in</strong> adom<strong>in</strong>ant force at <strong>in</strong>ternational policy meet<strong>in</strong>gs.By contrast, <strong>the</strong> small by population and welldevelopedeconomies <strong>in</strong> Europe will f<strong>in</strong>d<strong>the</strong>mselves slipp<strong>in</strong>g rapidly down <strong>the</strong> league table,or disappear<strong>in</strong>g from <strong>the</strong> Top 30 altoge<strong>the</strong>r.Indeed, by our calculations, Sweden, Austria,Norway and Denmark all f<strong>in</strong>d <strong>the</strong>mselves fall<strong>in</strong>gout of <strong>the</strong> list by <strong>2050</strong>. As we’ve alreadymentioned, <strong>in</strong>come per capita is still ris<strong>in</strong>g, so <strong>in</strong>some ways this doesn’t matter. However, <strong>the</strong>secountries may f<strong>in</strong>d <strong>the</strong>mselves hav<strong>in</strong>g less of asay <strong>in</strong> <strong>the</strong> <strong>global</strong> policy arena. As competitionhots up for <strong>the</strong> world’s scarce resources, this maybecome an issue.31. <strong>The</strong> potential reshuffle between now and <strong>2050</strong> is no different from that seen <strong>in</strong> <strong>the</strong> last forty years___________ Order <strong>in</strong> 1970 _____________ ____________ Order <strong>in</strong> 2010_____________ ___________ Order <strong>in</strong> <strong>2050</strong> ____________1 US 1 US 1 Ch<strong>in</strong>a2 Japan 2 Japan 2 US3 Germany 3 Ch<strong>in</strong>a 3 India4 UK 4 Germany 4 Japan5 France 5 UK 5 Germany6 Italy 6 France 6 UK7 Canada 7 Italy 7 Brazil8 Spa<strong>in</strong> 8 India 8 Mexico9 Brazil 9 Brazil 9 France10 Mexico 10 Canada 10 Canada11 Ne<strong>the</strong>rlands 11 S. Korea 11 Italy12 Australia 12 Spa<strong>in</strong> 12 Turkey13 Switzerland 13 Mexico 13 S. Korea14 Argent<strong>in</strong>a 14 Australia 14 Spa<strong>in</strong>15 Sweden 15 Ne<strong>the</strong>rlands 15 Russia16 India 16 Argent<strong>in</strong>a 16 Indonesia17 Belgium 17 Russia 17 Australia18 Ch<strong>in</strong>a 18 Turkey 18 Argent<strong>in</strong>a19 Austria 19 Sweden 19 Egypt20 Denmark 20 Switzerland 20 Malaysia21 Turkey 21 Indonesia 21 Saudi Arabia22 South Africa 22 Belgium 22 Thailand23 Venezuela 23 Saudi Arabia 23 Ne<strong>the</strong>rlands24 S. Korea 24 Poland 24 Poland25 Greece 25 Hong Kong 25 Iran26 Norway 26 Austria 26 Colombia27 F<strong>in</strong>land 27 Norway 27 Switzerland28 Saudi Arabia 28 South Africa 28 Hong Kong29 Iran 29 Thailand 29 Venezuela30 Portugal 30 Denmark 30 South AfricaSource: <strong>World</strong> Bank and <strong>HSBC</strong> calculations23
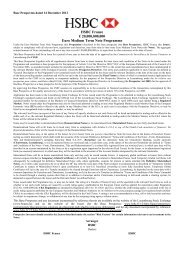
EconomicsGlobal4 January 2011abcOver <strong>the</strong> limit? Energy availability need not h<strong>in</strong>der this path of <strong>global</strong>development ... ...so long as <strong>the</strong>re is major <strong>in</strong>vestment <strong>in</strong> efficiency and lowcarbonalternatives Meet<strong>in</strong>g food demand may prove more of a challenge, butimprovements <strong>in</strong> yield and diet could fill <strong>the</strong> gapOver <strong>the</strong> limit?<strong>The</strong> scale of economic expansion forecast <strong>in</strong> thisreport over <strong>the</strong> next four decades raises <strong>in</strong>evitablequestions about environmental feasibility: Putsimply, does <strong>the</strong> planet have enough capacity tosusta<strong>in</strong> this tripl<strong>in</strong>g <strong>in</strong> economic output by <strong>2050</strong>?<strong>The</strong> answer is a cautious yes: <strong>The</strong> world <strong>economy</strong>can triple its <strong>in</strong>come, but only if levels of resourceproductivity are improved many times over.More than two planetsGlobal prosperity depends on an array ofecosystem services, notably <strong>the</strong> provision ofnatural resource <strong>in</strong>puts (such as food, fuel andmaterials), as well <strong>the</strong> regulation of naturalprocesses (e.g. water filtration, crop poll<strong>in</strong>ationand climate stability). Most of <strong>the</strong>se services areunder-priced <strong>in</strong> today’s <strong>global</strong> <strong>economy</strong> – with <strong>the</strong><strong>in</strong>evitable result that many natural assets arebecom<strong>in</strong>g over-exploited. Not only are manyexternalities – such as carbon costs – poorlypriced, but additional agricultural, energy andwater subsidies encourage fur<strong>the</strong>r depletion: fossilfuels alone received USD557bn <strong>in</strong> governmentsupport <strong>in</strong> 2008.As a result of <strong>the</strong>se market and policy failures, <strong>the</strong><strong>global</strong> <strong>economy</strong>’s ‘ecological footpr<strong>in</strong>t’ hasdoubled s<strong>in</strong>ce 1966. By 2007, humanity was us<strong>in</strong>g<strong>the</strong> equivalent of 1.5 planets each year to supportits consumption levels, accord<strong>in</strong>g to <strong>the</strong>environmental group, WWF.Essentially, <strong>the</strong> <strong>global</strong> <strong>economy</strong> has entered a periodof ecological deficit – deplet<strong>in</strong>g natural assets fasterthan <strong>the</strong>se can be replenished. And this is at a timewhen more than 1 billion people are still undernourished,lack access to electricity as well asmodern sanitation. By 2030, <strong>the</strong> footpr<strong>in</strong>t isprojected to have deepened to two planets’ worth ofresources each year and to 2.8 planets <strong>in</strong> <strong>2050</strong>.Clearly, it is possible to deplete natural assets for atime – but cont<strong>in</strong>u<strong>in</strong>g resource overshoot runs <strong>the</strong>risk of localised and, <strong>in</strong>creas<strong>in</strong>gly, <strong>global</strong> constra<strong>in</strong>tson economic activity. Look<strong>in</strong>g ahead to <strong>2050</strong>, <strong>the</strong>major challenges for growth flow from climatechange, as well as land and water availability forfood production.Nick Rob<strong>in</strong>sHead of Climate Change Centreof Excellence<strong>HSBC</strong> Bank plc+44 207 991 6778nick.rob<strong>in</strong>s@hsbc.comZoe KnightClimate Change Strategy<strong>HSBC</strong> Bank plc+44 207 991 6715zoe.knight@hsbcib.com24
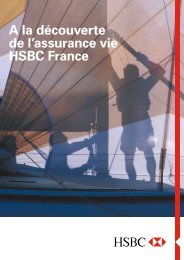
EconomicsGlobal4 January 2011abcRunn<strong>in</strong>g out of <strong>in</strong>puts?Much of <strong>the</strong> discussion about ecological capacityhas been cast <strong>in</strong> <strong>the</strong> language of ‘runn<strong>in</strong>g out’ ofkey <strong>in</strong>puts, notably energy and metals.In <strong>the</strong> case of metals, core commodities such asalum<strong>in</strong>ium, iron and even copper are widelyavailable, and easily recyclable. Even rare earthsare not so rare. Total <strong>global</strong> production <strong>in</strong> 2009 of14 key ‘rare earth’ materials amounted to 127,520tonnes. Yet, accord<strong>in</strong>g to a recent report by <strong>the</strong>US Department of Energy, <strong>global</strong> reserves standat some 99 million tonnes. <strong>The</strong> issue, however, isthat current production is highly concentrated,with 95% of output accounted for by just onecountry, Ch<strong>in</strong>a.Energy availability is somewhat morecomplicated. <strong>The</strong> era of cheap and easilyaccessible oil supplies is clearly over, with somepo<strong>in</strong>t<strong>in</strong>g to <strong>the</strong> risk of ‘peak oil’ disrupt<strong>in</strong>geconomic stability. A report on energy securityfrom <strong>the</strong> Lloyds <strong>in</strong>surance market concludes, forexample, that “we are head<strong>in</strong>g for a <strong>global</strong> oilsupply crunch and price spike”. Reserves of coaland gas are more plentiful, however. And suppliesof renewable energy are for all <strong>in</strong>tents andpurposes unlimited (and to date, untapped), atover 3,000 times larger than current energy needs.<strong>The</strong> International Energy Agency’s (IEA) latestEnergy Technology Perspectives report shows <strong>in</strong>its BLUE Map scenario that it is possible to raiseenergy production by <strong>2050</strong> while simultaneouslyreduc<strong>in</strong>g coal, oil and gas consumption belowcurrent levels (Chart 32).Indeed, for an additional upfront cost ofUSD46trn <strong>in</strong> energy efficiency, renewables,nuclear and ‘clean coal’, fuel sav<strong>in</strong>gs amount<strong>in</strong>g32. A low-carbon future <strong>in</strong> <strong>2050</strong> will use less energy than ‘bus<strong>in</strong>ess as usual’ <strong>in</strong> 2030: world primary energy supply by fuel (BoE)2400022000200001800016000O<strong>the</strong>rBiomass and w asteHy droNuclearNatural gasOilCoal140001200010000800060004000200002007 Basel<strong>in</strong>e 2030 Basel<strong>in</strong>e <strong>2050</strong> BLUE Map <strong>2050</strong>Source: IEA, Energy Technology Perspectives 201025
EconomicsGlobal4 January 2011abcto USD112trn could be generated by <strong>2050</strong>. Oneconsequence would be a significant reduction <strong>in</strong><strong>the</strong> projected cost of oil (Chart 33).33.A low-carbon future could drive down <strong>the</strong> oil price140120100806040200Basel<strong>in</strong>e Scenario19701974197819821986199019941998200220062010201420182022202620302034203820422046<strong>2050</strong>Source: IEA, Energy Technology Perspectives 2010Break<strong>in</strong>g <strong>the</strong> l<strong>in</strong>kBLUE Map Scenario<strong>The</strong> fundamental issue for energy <strong>the</strong>refore is not somuch its availability to meet <strong>global</strong> needs, but <strong>the</strong>cost, ei<strong>the</strong>r <strong>in</strong> terms of emissions or <strong>the</strong> <strong>in</strong>vestmentrequired today to deliver alternative energy sources.In terms of <strong>the</strong> climate change impact of greenhousegas (GHGs) emissions, fossil fuels account foraround 60% of <strong>the</strong> <strong>global</strong> total. To have a reasonablechance of hold<strong>in</strong>g long-term <strong>global</strong> warm<strong>in</strong>g toaround 2 degrees Celsius, GHGs will need to be cutby half by <strong>2050</strong> – at a time when <strong>the</strong> <strong>global</strong><strong>economy</strong> is more than tripl<strong>in</strong>g.Greenhouse gas emissions are <strong>the</strong> largest andfastest-grow<strong>in</strong>g component of <strong>the</strong> <strong>global</strong><strong>economy</strong>’s ‘ecological footpr<strong>in</strong>t’ – and accord<strong>in</strong>gto a report for <strong>the</strong> PRI <strong>in</strong>vestor alliance, <strong>the</strong>seemissions generated an external damage costs ofUSD4.5trn <strong>in</strong> 2008, some 7.5% of <strong>global</strong> GDP;this external cost is projected to rise to over 12%of <strong>global</strong> GDP by <strong>2050</strong>.Break<strong>in</strong>g <strong>the</strong> historic l<strong>in</strong>k between economicgrowth and carbon emissions will certa<strong>in</strong>ly behard. But it is both technologically feasible andeconomically attractive.Feed<strong>in</strong>g <strong>the</strong> world<strong>The</strong> grow<strong>in</strong>g sense of confidence that a practicalpathway exists to a clean-energy <strong>economy</strong> by<strong>2050</strong> is not yet <strong>in</strong> place for food and water. <strong>The</strong>Food and Agriculture Organisation projects that a70% <strong>in</strong>crease <strong>in</strong> food production will be neededby <strong>2050</strong>. But growth <strong>in</strong> yields has been fall<strong>in</strong>gfrom 3.2% a year <strong>in</strong> 1960 to 1.5% <strong>in</strong> 2000. Inaddition, <strong>the</strong> scope for <strong>in</strong>creas<strong>in</strong>g <strong>the</strong> area undercultivation is limited by <strong>the</strong> need to halt <strong>the</strong>decl<strong>in</strong>e <strong>in</strong> soil and water resources, <strong>the</strong> loss ofspecies as well as <strong>the</strong> erosion of ecosystem qualitythat is proceed<strong>in</strong>g on <strong>the</strong> back of ris<strong>in</strong>g foodconsumption. In 1995, about 1.8 billion peoplewere liv<strong>in</strong>g <strong>in</strong> areas experienc<strong>in</strong>g severe waterstress; by 2025, about two-thirds of <strong>the</strong> world’spopulation – about 5.5 billion people – areexpected to live <strong>in</strong> areas fac<strong>in</strong>g moderate to severewater stress.Climate change will fur<strong>the</strong>r compound <strong>the</strong> issue.Although governments agreed <strong>in</strong> Cancun <strong>in</strong>December 2010 to try to hold <strong>the</strong> <strong>in</strong>crease <strong>in</strong>average <strong>global</strong> temperatures below 2۫C thiscentury, current commitments rema<strong>in</strong> <strong>in</strong>sufficient.As a result, <strong>the</strong> world could well warm by 2۫C by<strong>2050</strong>, and <strong>in</strong> some projections by as early as 2024(see Too Close for Comfort, December 2009).This would have severe implications foragricultural yields, as well as water availability,with greater <strong>in</strong>cidence of extreme events such asdroughts and floods.Yet <strong>the</strong> potential for meet<strong>in</strong>g nutritional needs andsusta<strong>in</strong><strong>in</strong>g resources <strong>in</strong> a world of 9 billion peoplewith much higher <strong>in</strong>comes clearly exists. With<strong>in</strong>vestment, yields can be improved, crops can beadapted to a chang<strong>in</strong>g climate, and post-harvestlosses can be cut. And <strong>the</strong> need to slow andreverse <strong>the</strong> negative health impacts of overconsumptionoffers ano<strong>the</strong>r way of match<strong>in</strong>gresources with ris<strong>in</strong>g <strong>in</strong>comes and human wellbe<strong>in</strong>g.Approximately 1.5bn adults were26
EconomicsGlobal4 January 2011abcoverweight <strong>in</strong> 2005, with 400 million obese. By On <strong>the</strong> road to <strong>2050</strong>, we expect what are currently2015, <strong>the</strong> <strong>World</strong> Health Organisation projects that ‘off balance sheet’ costs – whe<strong>the</strong>r <strong>in</strong> terms ofthis could rise 2.3 billion and 700 millioncarbon emissions or biodiversity loss – to berespectively. In <strong>the</strong> UK, a quarter of adults are brought more formally <strong>in</strong>to economic decisionmak<strong>in</strong>g.This will reward <strong>the</strong> corporations andalready obese, a figure that is projected to grow to60% of men and 50% of women <strong>in</strong> <strong>2050</strong>.countries that make resource productivity a keyelement of long-term strategy. Even with <strong>the</strong><strong>The</strong> Mo<strong>the</strong>r of Opportunitycurrent modest targets, we expect <strong>the</strong> low-carbonWhile Keynes and Friedman are currently battl<strong>in</strong>g<strong>economy</strong> to grow by 10% CAGR over <strong>the</strong> nextit out <strong>in</strong> <strong>the</strong> economic conundrum of how todecade to reach over 2% of <strong>global</strong> GDP (seegenerate growth, <strong>the</strong> contest of <strong>the</strong> com<strong>in</strong>gSiz<strong>in</strong>g <strong>the</strong> climate <strong>economy</strong>, September 2009).decades will be between Malthus’ economics ofscarcity and Stern’s 3 economics of green growth. We believe that <strong>the</strong>re will be a deepen<strong>in</strong>g of<strong>The</strong>re are real limits to <strong>the</strong> cont<strong>in</strong>ued expansion of deployment and <strong>in</strong>novation <strong>in</strong> <strong>the</strong> decades<strong>the</strong> <strong>global</strong> <strong>economy</strong>’s ‘ecological footpr<strong>in</strong>t’ – and <strong>the</strong>reafter, with <strong>the</strong> ‘climate <strong>economy</strong>’ potentiallyif <strong>the</strong>se are not confronted <strong>the</strong>n economic output play<strong>in</strong>g an equivalent role to <strong>the</strong> ‘knowledgeand human well-be<strong>in</strong>g will become <strong>in</strong>creas<strong>in</strong>gly <strong>economy</strong>’ <strong>in</strong> <strong>the</strong> past century. It will be growth,constra<strong>in</strong>ed. But growth can also be delivered by but not as we know it.<strong>in</strong>vest<strong>in</strong>g <strong>in</strong> <strong>the</strong> markets, technologies, knowledgeand bus<strong>in</strong>ess models that improve resourceproductivity and susta<strong>in</strong> natural assets.3 Lord Stern is author of <strong>The</strong> Economics of Climate Change.27
EconomicsGlobal4 January 2011abcWhat might go wrong? Our projections are based on policymakers mak<strong>in</strong>g ‘good’ decisions <strong>The</strong> most press<strong>in</strong>g risk is that open borders, which have playedsuch a key role <strong>in</strong> development, are closed34. <strong>The</strong> last few decades have been remarkably peaceful for<strong>the</strong> <strong>global</strong> <strong>economy</strong>12%10%8%6%4%2%20yr roll<strong>in</strong>g Standard devation of US GDP0%1891 1920 1949 1978 2007Source: Maddison long-term US GDP data12%10%8%6%4%2%0%In a nutshell, our projections are based on ara<strong>the</strong>r rosy backdrop – everyth<strong>in</strong>g is go<strong>in</strong>g right,governments and policymakers are do<strong>in</strong>g <strong>the</strong>right th<strong>in</strong>g. Of course, <strong>the</strong>re are a number of reasonsth<strong>in</strong>gs might not play out <strong>in</strong> <strong>the</strong> way we haveassumed. We should rem<strong>in</strong>d ourselves that up until<strong>the</strong> recent turmoil we had seen a remarkably calmperiod for <strong>the</strong> <strong>global</strong> <strong>economy</strong> as a whole (Chart 34).Border barriers and war<strong>The</strong> biggest danger is that <strong>the</strong> open borders thathave delivered so much prosperity are closed. It’shard to see how such a wave of protectionismcould benefit any <strong>in</strong>dividual <strong>economy</strong>, andcerta<strong>in</strong>ly not <strong>the</strong> system as a whole. Butpoliticians’ motivation tends to be about gett<strong>in</strong>gthrough <strong>the</strong> next election, ra<strong>the</strong>r than long-termgrowth. As such, bad politics is a key risk to <strong>the</strong>seprojections. And, of course, trade wars can befollowed by real wars. We probably don’t need togo any fur<strong>the</strong>r <strong>in</strong> highlight<strong>in</strong>g how this woulddisrupt our projections.Cyclical <strong>in</strong>terruptionsOur model is a structural model of potential supplyand <strong>the</strong>refore ignores cyclical factors and whe<strong>the</strong>r<strong>the</strong>re are ebbs and flows <strong>in</strong> demand.Natural disastersNatural disasters can send economies seriously offcourse as <strong>the</strong>ir development seeks to replace whatwas lost ra<strong>the</strong>r than make any fur<strong>the</strong>r leap forward.Factors <strong>the</strong> model isn’t pick<strong>in</strong>g upNo model can perfectly capture all <strong>the</strong>idiosyncratic factors that will constra<strong>in</strong> or boostan <strong>economy</strong>’s development. One of <strong>the</strong> mostsignificant variables we are not captur<strong>in</strong>g is <strong>the</strong>natural resources with which an <strong>economy</strong> isendowed and how this drives its relative terms oftrade and its barga<strong>in</strong><strong>in</strong>g power <strong>in</strong> <strong>the</strong> <strong>global</strong><strong>economy</strong>. <strong>The</strong>re are also important trade l<strong>in</strong>kagesthat we are not captur<strong>in</strong>g. Brazil has developedclose trade ties with <strong>the</strong> emerg<strong>in</strong>g markets, whichappears to have accelerated its development.28
EconomicsGlobal4 January 2011abcSupply-side setbacks<strong>The</strong> supply-side advances <strong>in</strong> both <strong>the</strong> developedand emerg<strong>in</strong>g markets, which have managed todeliver growth without <strong>in</strong>flation, could go <strong>in</strong>toreverse. <strong>The</strong> prospect of Ch<strong>in</strong>a’s labour forcebecom<strong>in</strong>g more militant is at <strong>the</strong> forefront of anumber of <strong>in</strong>vestors’ m<strong>in</strong>ds. And <strong>in</strong> <strong>the</strong> westernworld, faced with an ongo<strong>in</strong>g squeeze <strong>in</strong> real<strong>in</strong>come, fur<strong>the</strong>r cuts to public pension provisionand <strong>in</strong>creases <strong>in</strong> retirement ages, one can’t ruleout a re-emergence of labour unionisation.29
EconomicsGlobal4 January 2011abcReferencesBarro, R. J., 1989. Economic Growth <strong>in</strong> a Cross Section of Countries. NBER Work<strong>in</strong>g Paper No. 3120.Barro, R. J., 1991. Economic Growth <strong>in</strong> a Cross Section of Countries. <strong>The</strong> Quarterly Journal ofEconomics, Vol. 106 (2), pp. 407-443.Barro, R. J., Lee, J. W., 2001. International data on educational atta<strong>in</strong>ment: updates and implications.Oxford Economic Papers, Vol 3, pp. 541-563.Barro, R. J., Lee, J. W., 1994. Sources of economic growth. Carnegie-Rochester Conference Series onPublic Policy, Volume 40, June 1994, pp. 1-46.Bassan<strong>in</strong>i, A., Scarpetta, S., 2001. <strong>The</strong> Driv<strong>in</strong>g Forces of Economic Growth: Panel Data Evidence For <strong>the</strong>OECD Countries. OECD Economic Studies, Vol 33 (2), pp. 9-56.Calderon, C., Serven, L., 2004. <strong>The</strong> Effects of Infrastructure Development on Growth and IncomeDistribution. <strong>World</strong> Bank Policy Research Work<strong>in</strong>g Paper No. 3400.Desai, V. A., 1999. <strong>The</strong> Economics and Politics of Transition to an Open Market Economy: India. OECDDevelopment Centre Work<strong>in</strong>g Paper No. 155.Dowrick, S., Nguyen, D. T., 1989. OECD Comparative Economic Growth 1950-1985: Catch-Up andConvergence. <strong>The</strong> American Economic Review, Vol 79 (5), pp. 1010-1030.Food and Agriculture Organisation, How to Feed <strong>the</strong> <strong>World</strong> <strong>in</strong> <strong>2050</strong>, 2009Goodhart, C., Xu, C., 1996. <strong>The</strong> Rise of Ch<strong>in</strong>a as an Economic Power. Centre for Economic PerformanceDiscussion Paper No. 299, London School of Economics and Political Science, London.IEA, Energy Technology Perspectives 2010K<strong>in</strong>g, Stephen D, 2010, Los<strong>in</strong>g Control: Emerg<strong>in</strong>g Threats to Western Prosperity, Yale University PressKrugman, P., 1994. <strong>The</strong> Myth of Asia’s Miracle, Foreign Affairs, Vol 73 (6), pp. 62-78Leipziger, D. M., Thomas, V., 1993. <strong>The</strong> Lessons of East Asia: An Overview of Country Experience. <strong>The</strong><strong>World</strong> Bank, Wash<strong>in</strong>gton, D.C.Lucas Jr, R. E., 1988. On <strong>the</strong> Mechanics of Economic Development. Journal of Monetary Economics,Vol 22, pp. 3-42.Maddison, A., 2007. Ch<strong>in</strong>ese Economic Performance <strong>in</strong> <strong>the</strong> Long Run, 2 nd ed. OECD DevelopmentCentre, Paris.Mankiw, G. N., Romer, D., Weil, D.N., 1992. A Contribution to <strong>the</strong> Empirics of Economic Growth. <strong>The</strong>Quarterly Journal of Economics, Vol. 107 (2), pp.407-437.OECD, 2010. Perspectives on Global Development 2010: Shift<strong>in</strong>g Wealth, OECD Development Centre,Paris30
EconomicsGlobal4 January 2011abcPaldam, M., 2003. Economic freedom and success of <strong>the</strong> Asian tigers: an essay on controversy. EuropeanJournal of Political <strong>economy</strong>, Vol. 19, pp. 453-477Prasdad, E. S., 2006. Modernis<strong>in</strong>g Ch<strong>in</strong>a’s Growth Paradigm. International Monetary Fund PolicyDiscussion Paper.UK Government Office for Science, Tackl<strong>in</strong>g Obesities: Future Choices, 2007UN Pr<strong>in</strong>ciples for Responsible Investment, Why externalities matter to <strong>in</strong>stitutional <strong>in</strong>vestors, 2010US Department of Energy, Critical Materials Strategy, December 2010WWF, Liv<strong>in</strong>g Planet Report 2010<strong>The</strong> <strong>World</strong> Bank, 1993, <strong>The</strong> East Asian Miracle: economic growth and public policy, A <strong>World</strong> BankPolicy Research Report, Oxford University Press, Oxford<strong>The</strong> <strong>World</strong> Bank, 2009. <strong>World</strong> Development Report 2009: Reshap<strong>in</strong>g Economic Geography, <strong>The</strong> <strong>World</strong>Bank, Wash<strong>in</strong>gton, DC.<strong>World</strong> Health Organisation. Obesity and Overweight, 2010United Nations, 2002. Forecasts of <strong>the</strong> Economic Growth <strong>in</strong> OECD Countries and Central and EasternEuropean Countries for <strong>the</strong> Period 2000-2040. UN, New York.Lloyds, 360 Risk Insight: Susta<strong>in</strong>able Energy Security, 2010<strong>The</strong> Economics of Ecosystems and Biodiversity, Ma<strong>in</strong>stream<strong>in</strong>g <strong>the</strong> Economics of Nature, 201031
EconomicsGlobal4 January 2011abcAppendix 1Barro’s growth modelA1. <strong>The</strong> modelVariableCoefficientsLog GDP -0.018Male school<strong>in</strong>g 0.002Log GDP * school<strong>in</strong>g -0.004Log life expectancy 0.044Log fertility -0.016Government consumption ratio -0.136Rule of law <strong>in</strong>dex 0.029Democracy <strong>in</strong>dex 0.090Democracy <strong>in</strong>dex squared -0.088Inflation rate -0.043Source: Barro with <strong>HSBC</strong> adjustment to school<strong>in</strong>gTo test whe<strong>the</strong>r <strong>the</strong> model was too simplistic weused <strong>the</strong> data on <strong>the</strong> economic <strong>in</strong>frastructure forour forty countries <strong>in</strong> 2000 and predicted <strong>the</strong>average per capita <strong>in</strong>come over <strong>the</strong> past ten years.We made two amendments to Barro’s orig<strong>in</strong>almodel. First, we lowered slightly <strong>the</strong> convergencerate, <strong>in</strong> l<strong>in</strong>e with more recent literature (SeeOECD 2001).Second, it appeared that <strong>the</strong> orig<strong>in</strong>al model wasoverstat<strong>in</strong>g <strong>the</strong> impact of education. In Barro’sorig<strong>in</strong>al model, an extra year of school<strong>in</strong>g served toraise GDP growth by 1.2% po<strong>in</strong>ts. Those with veryhigh levels of education, such as Germany, wereforecast to grow much more quickly than <strong>the</strong>yachieved. And countries such as India with very lowlevels of education were barely forecast to grow atall. However, recalibrat<strong>in</strong>g <strong>the</strong> model to lower <strong>the</strong>impact of education produced remarkably accurateforecasts for such a simple model. <strong>The</strong> ma<strong>in</strong> areas offailure are <strong>in</strong> Asia, where <strong>the</strong> region <strong>in</strong> <strong>the</strong> early partof <strong>the</strong> 2000-2010 period was still recover<strong>in</strong>g from<strong>the</strong> Asian crisis.A2. Test<strong>in</strong>g <strong>the</strong> model by forecast<strong>in</strong>g growth from 2000-09ModelForecastActualgrowth rateForecasterrorCh<strong>in</strong>a 6.7% 9.6% 2.9%India 4.6% 5.5% 0.9%Russia 5.5% 5.2% -0.3%US 0.7% 0.8% 0.2%UK 1.5% 1.2% -0.3%Brazil 2.2% 2.1% -0.1%Japan 0.9% 0.8% -0.1%Germany 1.4% 0.8% -0.6%France 0.8% 0.8% -0.1%Italy 2.0% 0.0% -2.1%Spa<strong>in</strong> 3.1% 1.2% -1.9%Canada 1.7% 1.3% -0.4%Mexico 3.7% 0.8% -2.9%Australia 1.7% 1.7% 0.0%S. Korea 3.8% 3.9% 0.1%Ne<strong>the</strong>rlands 1.2% 1.1% -0.1%Turkey 1.6% 2.4% 0.8%Poland 5.2% 4.1% -1.1%Indonesia 1.9% 3.8% 1.9%Belgium 1.1% 1.0% -0.1%Switzerland 2.2% 1.4% -0.8%Sweden 0.5% 1.4% 0.9%Thailand 5.1% 3.1% -2.0%Argent<strong>in</strong>a 3.3% 2.6% -0.7%Greece 3.0% 3.0% 0.0%Malaysia 6.3% 2.8% -3.4%Ireland 1.8% 2.2% 0.4%F<strong>in</strong>land 1.7% 1.8% 0.1%South Africa 2.0% 2.2% 0.2%Denmark 0.4% 0.5% 0.1%Austria 2.3% 1.3% -1.1%Norway 0.0% 1.2% 1.2%Saudi Arabia 2.4% 1.0% -1.4%Hong Kong 5.1% 4.3% -0.8%Colombia 2.2% 2.4% 0.2%Venezuela 1.4% 2.1% 0.7%Iran 5.6% 3.6% -2.1%Israel -0.4% 1.5% 1.9%S<strong>in</strong>gapore 5.5% 3.2% -2.3%Egypt 5.4% 2.9% -2.5%Source: Barro and <strong>HSBC</strong> calculations32
EconomicsGlobal4 January 2011abcCreat<strong>in</strong>g <strong>the</strong> base scenarioforecastsA3. Model’s projections assum<strong>in</strong>g <strong>the</strong> ‘economic <strong>in</strong>frastructure’doesn’t improve2010-20 2020-30 2030-40 2040-50US 0.5% 0.5% 0.6% 0.6%Japan 1.2% 1.2% 1.0% 0.9%Ch<strong>in</strong>a 6.6% 5.2% 4.2% 3.5%Germany 2.1% 1.8% 1.5% 1.3%UK 1.3% 1.1% 0.9% 0.7%France 1.2% 1.0% 0.8% 0.7%Italy 2.1% 1.7% 1.4% 1.2%India 4.1% 3.4% 3.0% 2.6%Brazil 2.3% 1.7% 1.4% 1.1%Canada 1.9% 1.6% 1.3% 1.1%S. Korea 3.9% 2.9% 2.4% 1.9%Spa<strong>in</strong> 2.9% 2.5% 2.0% 1.7%Mexico 3.6% 3.0% 2.5% 2.1%Australia 1.9% 1.5% 1.3% 1.1%Ne<strong>the</strong>rlands 1.2% 1.1% 0.9% 0.8%Argent<strong>in</strong>a 2.5% 1.9% 1.6% 1.3%Russia 5.1% 4.3% 3.5% 2.9%Turkey 4.0% 3.4% 2.9% 2.5%Sweden 0.5% 0.5% 0.5% 0.5%Switzerland 2.6% 2.1% 1.7% 1.4%Indonesia 3.1% 2.6% 2.1% 1.8%Belgium 1.1% 1.0% 0.8% 0.7%Saudi Arabia 1.9% 1.5% 1.2% 1.0%Poland 4.1% 3.3% 2.7% 2.2%Hong Kong 3.0% 2.4% 1.9% 1.6%Austria 2.7% 2.2% 1.8% 1.5%Norway 0.4% 0.5% 0.6% 0.6%South Africa 1.1% 0.8% 0.6% 0.4%Thailand 3.8% 3.1% 2.7% 2.2%Denmark 0.6% 0.5% 0.4% 0.4%Israel -0.1% 0.9% 0.8% 0.7%S<strong>in</strong>gapore 4.2% 3.5% 3.0% 2.5%Greece 3.0% 2.6% 2.1% 1.7%Iran 6.2% 5.1% 4.2% 3.4%Egypt 3.5% 4.3% 3.8% 3.2%Venezuela 1.4% 1.0% 0.7% 0.5%Malaysia 5.4% 4.3% 3.5% 2.9%F<strong>in</strong>land 1.5% 1.3% 1.1% 0.9%Colombia 3.0% 2.5% 2.0% 1.7%Ireland 1.6% 1.5% 1.3% 1.1%Source: <strong>HSBC</strong> CalculationsA4. Model’s projections assum<strong>in</strong>g <strong>the</strong> ‘economic <strong>in</strong>frastructure’improve to <strong>the</strong> highest possible level2010-20 2020-30 2030-40 2040-50US 0.5% 1.6% 2.3% 2.8%Japan 1.2% 2.1% 2.7% 3.2%Ch<strong>in</strong>a 6.6% 6.0% 5.8% 5.6%Germany 2.1% 2.8% 3.2% 3.6%UK 1.3% 2.1% 2.7% 3.2%France 1.2% 2.1% 2.8% 3.4%Italy 2.1% 2.9% 3.5% 4.0%India 4.1% 5.4% 6.5% 7.3%Brazil 2.3% 3.5% 4.7% 5.7%Canada 1.9% 2.5% 3.0% 3.4%S. Korea 3.9% 3.7% 3.9% 4.0%Spa<strong>in</strong> 2.9% 3.4% 3.7% 4.0%Mexico 3.6% 4.1% 4.4% 4.7%Australia 1.9% 2.3% 2.8% 3.1%Ne<strong>the</strong>rlands 1.2% 2.2% 2.9% 3.4%Argent<strong>in</strong>a 2.5% 3.1% 3.6% 4.2%Russia 5.1% 5.5% 5.7% 6.0%Turkey 4.0% 4.4% 4.7% 4.9%Sweden 0.5% 1.7% 2.6% 3.2%Switzerland 2.6% 2.6% 2.7% 2.7%Indonesia 3.1% 4.7% 6.2% 7.3%Belgium 1.1% 2.1% 2.9% 3.5%Saudi Arabia 1.9% 2.6% 3.3% 3.9%Poland 4.1% 4.4% 4.8% 5.1%Hong Kong 3.0% 3.0% 3.1% 3.2%Austria 2.7% 3.0% 3.2% 3.3%Norway 0.4% 1.5% 2.3% 2.8%South Africa 1.1% 2.9% 4.5% 5.9%Thailand 3.8% 4.7% 5.5% 6.1%Denmark 0.6% 1.7% 2.6% 3.3%Israel -0.1% 1.3% 2.4% 3.3%S<strong>in</strong>gapore 4.2% 3.4% 3.0% 2.6%Greece 3.0% 3.5% 3.8% 4.1%Iran 6.2% 6.0% 5.9% 5.8%Egypt 3.5% 4.5% 5.3% 6.1%Venezuela 1.4% 2.8% 4.1% 5.3%Malaysia 5.4% 4.8% 4.5% 4.2%F<strong>in</strong>land 1.5% 2.3% 2.8% 3.3%Colombia 3.0% 4.1% 5.0% 5.7%Ireland 1.6% 2.3% 2.7% 2.9%Source: <strong>HSBC</strong> Calculations33
EconomicsGlobal4 January 2011abcAppendix 2: Population demographic changes to <strong>2050</strong>.Millions1000800600400200Developed worldMillions1000800600400200654321BillionsDevelop<strong>in</strong>g worldBillions6543210000Learn<strong>in</strong>g Work<strong>in</strong>g RetiredLearn<strong>in</strong>g Work<strong>in</strong>g R etired1990 2010 2030 <strong>2050</strong>1990 2010 2030 <strong>2050</strong>Source: United Nations, <strong>HSBC</strong>Source: United Nations, <strong>HSBC</strong>Millions300250200150100500USMillions300250200150100500Millions100806040200JapanMillions100806040200Learn<strong>in</strong>g Work<strong>in</strong>g RetiredLearn<strong>in</strong>g Work<strong>in</strong> g Retired1990 2010 2030 <strong>2050</strong>1990 2010 2030 <strong>2050</strong>Source: United Nations, <strong>HSBC</strong>Source: United Nations, <strong>HSBC</strong>Millions12008004000Ch<strong>in</strong>aMillions120080040006050403020100MillionsGerm an yMillions6050403020100Learn<strong>in</strong>g Work<strong>in</strong> g RetiredLearn<strong>in</strong>g Work<strong>in</strong>g Retired1990 2010 2030 <strong>2050</strong>1990 2010 2030 <strong>2050</strong>Source: United Nations, <strong>HSBC</strong>Source: United Nations, <strong>HSBC</strong>34
EconomicsGlobal4 January 2011abcMillionsUKMillionsMillionsFranceMillions50403020100504030201005040302010050403020100Learn<strong>in</strong>g Work<strong>in</strong>g RetiredLearn<strong>in</strong>g Work<strong>in</strong>g Retired1990 2010 2030 <strong>2050</strong>1990 2010 2030 <strong>2050</strong>Source: United Nations, <strong>HSBC</strong>Source: United Nations, <strong>HSBC</strong>MillionsItalyMillions403040302020101000Learn<strong>in</strong>g Work<strong>in</strong>g RetiredMillions12008004000IndiaLearn<strong>in</strong>g Work<strong>in</strong> g RetiredMillions120080040001990 2010 2030 <strong>2050</strong>1990 2010 2030 <strong>2050</strong>Source: United Nations, <strong>HSBC</strong>Source: United Nations, <strong>HSBC</strong>Millions200150100500BrazilMillions200150100500302520151050MillionsCanadaMillions302520151050Learn<strong>in</strong>g Work<strong>in</strong> g RetiredLearn<strong>in</strong>g Work<strong>in</strong>g Retired1990 2010 2030 <strong>2050</strong>Source: United Nations, <strong>HSBC</strong>1990 2010 2030 <strong>2050</strong>Source: United Nations, <strong>HSBC</strong>35
EconomicsGlobal4 January 2011abcMillionsRepublic of KoreaMillionsMillionsSpa<strong>in</strong>Millions403040304030403020202020101010100000Learn<strong>in</strong>g Work<strong>in</strong>g RetiredLearn<strong>in</strong>g Work<strong>in</strong>g Retired1990 2010 2030 <strong>2050</strong>1990 2010 2030 <strong>2050</strong>Source: United Nations, <strong>HSBC</strong>Source: United Nations, <strong>HSBC</strong>Millions100806040200MexicoLearn<strong>in</strong>g Work<strong>in</strong>g RetiredMillions100806040200MillionsAustraliaMillions2015201510105500Learn<strong>in</strong>g Work<strong>in</strong>g Retired1990 2010 2030 <strong>2050</strong>1990 2010 2030 <strong>2050</strong>Source: United Nations, <strong>HSBC</strong>Source: United Nations, <strong>HSBC</strong>MillionsNe<strong>the</strong>rlandsMillionsMillionsArgent<strong>in</strong>aMillions151540401051053020103020100000Learn<strong>in</strong>g Work<strong>in</strong>g RetiredLearn<strong>in</strong>g Work<strong>in</strong>g Retired1990 2010 2030 <strong>2050</strong>1990 2010 2030 <strong>2050</strong>Source: United Nations, <strong>HSBC</strong>Source: United Nations, <strong>HSBC</strong>36
EconomicsGlobal4 January 2011abcMillionsRussian FederationMillionsMillionsTurkeyMillions1208040012080400706050403020100706050403020100Learn<strong>in</strong>g Work<strong>in</strong>g RetiredLearn<strong>in</strong>g Work<strong>in</strong>g Retired1990 2010 2030 <strong>2050</strong>1990 2010 2030 <strong>2050</strong>Source: United Nations, <strong>HSBC</strong>Source: United Nations, <strong>HSBC</strong>MillionsSwedenMillionsMillionsSwitzerl andMillions86420Learn<strong>in</strong>g Work<strong>in</strong> g Retired864206543210Learn<strong>in</strong>g Work<strong>in</strong>g Retired65432101990 2010 2030 <strong>2050</strong>1990 2010 2030 <strong>2050</strong>Source: United Nations, <strong>HSBC</strong>Source: United Nations, <strong>HSBC</strong>MillionsIndonesia200150100500Learn<strong>in</strong>g Work<strong>in</strong>g RetiredMillions200150100500MillionsBelgiumMillions8686442200Learn<strong>in</strong>g Work<strong>in</strong>g Retired1990 2010 2030 <strong>2050</strong>1990 2010 2030 <strong>2050</strong>Source: United Nations, <strong>HSBC</strong>Source: United Nations, <strong>HSBC</strong>37
EconomicsGlobal4 January 2011abc302520151050MillionsSaudi ArabiaMillions302520151050Millions86420PortugalMillions86420Learn<strong>in</strong>g Work<strong>in</strong>g Retired1990 2010 2030 <strong>2050</strong>Learn<strong>in</strong>g Work<strong>in</strong>g Retired1990 2010 2030 <strong>2050</strong>Source: United Nations, <strong>HSBC</strong>Source: United Nations, <strong>HSBC</strong>MillionsHong KongMillionsMillionsAustriaMillions6543210654321064206420Learn<strong>in</strong>g Work<strong>in</strong>g RetiredLearn<strong>in</strong>g Work<strong>in</strong>g Retired1990 2010 2030 <strong>2050</strong>1990 2010 2030 <strong>2050</strong>Source: United Nations, <strong>HSBC</strong>Source: United Nations, <strong>HSBC</strong>MillionsNorwayMillionsMillionsSouth AfricaMillions43210Learn<strong>in</strong>g Work<strong>in</strong> g Retired43210403020100Learn<strong>in</strong>g Work<strong>in</strong>g Retired4030201001990 2010 2030 <strong>2050</strong>1990 2010 2030 <strong>2050</strong>Source: United Nations, <strong>HSBC</strong>Source: United Nations, <strong>HSBC</strong>38
EconomicsGlobal4 January 2011abcMillionsThailandMillionsMillionsDenmarkMillions605040302010060504030201004321043210Learn<strong>in</strong>g Work<strong>in</strong>g RetiredLearn<strong>in</strong>g Work<strong>in</strong>g Retired1990 2010 2030 <strong>2050</strong>1990 2010 2030 <strong>2050</strong>Source: United Nations, <strong>HSBC</strong>Source: United Nations, <strong>HSBC</strong>MillionsIsraelMillions8866442200Learn<strong>in</strong>g Work<strong>in</strong>g Retired1990 2010 2030 <strong>2050</strong>43210MillionsS<strong>in</strong>gaporeMillions43210Learn<strong>in</strong>g Work<strong>in</strong> g Retired1990 2010 2030 <strong>2050</strong>Source: United Nations, <strong>HSBC</strong>Source: United Nations, <strong>HSBC</strong>MillionsGreeceMillionsMillionsIranMillions8880806660604440402220200000Learn<strong>in</strong>g Work<strong>in</strong> g RetiredLearn<strong>in</strong>g Work<strong>in</strong>g Retired1990 2010 2030 <strong>2050</strong>1990 2010 2030 <strong>2050</strong>Source: United Nations, <strong>HSBC</strong>Source: United Nations, <strong>HSBC</strong>39
EconomicsGlobal4 January 2011abcMillionsEgyptMillionsMillionsVenezuelaMillions80604020080604020030201003020100Learn<strong>in</strong>g Work<strong>in</strong>g RetiredLearn<strong>in</strong>g Work<strong>in</strong>g Retired1990 2010 2030 <strong>2050</strong>1990 2010 2030 <strong>2050</strong>Source: United Nations, <strong>HSBC</strong>Source: United Nations, <strong>HSBC</strong>MillionsMalaysiaMillionsMillionsF<strong>in</strong>landMillions3025201510503025201510504321043210Learn<strong>in</strong>g Work<strong>in</strong>g RetiredLearn<strong>in</strong>g Work<strong>in</strong>g Retired1990 2010 2030 <strong>2050</strong>1990 2010 2030 <strong>2050</strong>Source: United Nations, <strong>HSBC</strong>Source: United Nations, <strong>HSBC</strong>MillionsColombiaMillionsMillionsIrelandMillions5040302010050403020104321043210Learn<strong>in</strong>g Work<strong>in</strong>g RetiredLearn<strong>in</strong>g Work<strong>in</strong>g Retired1990 2010 2030 <strong>2050</strong>1990 2010 2030 <strong>2050</strong>Source: United Nations, <strong>HSBC</strong>Source: United Nations, <strong>HSBC</strong>40
EconomicsGlobal4 January 2011abcNotes41
EconomicsGlobal4 January 2011abcDisclosure appendixAnalyst Certification<strong>The</strong> follow<strong>in</strong>g analyst(s), economist(s), and/or strategist(s) who is(are) primarily responsible for this report, certifies(y) that <strong>the</strong>op<strong>in</strong>ion(s) on <strong>the</strong> subject security(ies) or issuer(s) and/or any o<strong>the</strong>r views or forecasts expressed here<strong>in</strong> accurately reflect <strong>the</strong>irpersonal view(s) and that no part of <strong>the</strong>ir compensation was, is or will be directly or <strong>in</strong>directly related to <strong>the</strong> specificrecommendation(s) or views conta<strong>in</strong>ed <strong>in</strong> this research report: Karen Ward, Nick Rob<strong>in</strong>s and Zoe KnightImportant DisclosuresThis document has been prepared and is be<strong>in</strong>g distributed by <strong>the</strong> Research Department of <strong>HSBC</strong> and is <strong>in</strong>tended solely for <strong>the</strong>clients of <strong>HSBC</strong> and is not for publication to o<strong>the</strong>r persons, whe<strong>the</strong>r through <strong>the</strong> press or by o<strong>the</strong>r means.This document is for <strong>in</strong>formation purposes only and it should not be regarded as an offer to sell or as a solicitation of an offerto buy <strong>the</strong> securities or o<strong>the</strong>r <strong>in</strong>vestment products mentioned <strong>in</strong> it and/or to participate <strong>in</strong> any trad<strong>in</strong>g strategy. Advice <strong>in</strong> thisdocument is general and should not be construed as personal advice, given it has been prepared without tak<strong>in</strong>g account of <strong>the</strong>objectives, f<strong>in</strong>ancial situation or needs of any particular <strong>in</strong>vestor. Accord<strong>in</strong>gly, <strong>in</strong>vestors should, before act<strong>in</strong>g on <strong>the</strong> advice,consider <strong>the</strong> appropriateness of <strong>the</strong> advice, hav<strong>in</strong>g regard to <strong>the</strong>ir objectives, f<strong>in</strong>ancial situation and needs. If necessary, seekprofessional <strong>in</strong>vestment and tax advice.Certa<strong>in</strong> <strong>in</strong>vestment products mentioned <strong>in</strong> this document may not be eligible for sale <strong>in</strong> some states or countries, and <strong>the</strong>y maynot be suitable for all types of <strong>in</strong>vestors. Investors should consult with <strong>the</strong>ir <strong>HSBC</strong> representative regard<strong>in</strong>g <strong>the</strong> suitability of<strong>the</strong> <strong>in</strong>vestment products mentioned <strong>in</strong> this document and take <strong>in</strong>to account <strong>the</strong>ir specific <strong>in</strong>vestment objectives, f<strong>in</strong>ancialsituation or particular needs before mak<strong>in</strong>g a commitment to purchase <strong>in</strong>vestment products.<strong>The</strong> value of and <strong>the</strong> <strong>in</strong>come produced by <strong>the</strong> <strong>in</strong>vestment products mentioned <strong>in</strong> this document may fluctuate, so that an<strong>in</strong>vestor may get back less than orig<strong>in</strong>ally <strong>in</strong>vested. Certa<strong>in</strong> high-volatility <strong>in</strong>vestments can be subject to sudden and large falls<strong>in</strong> value that could equal or exceed <strong>the</strong> amount <strong>in</strong>vested. Value and <strong>in</strong>come from <strong>in</strong>vestment products may be adverselyaffected by exchange rates, <strong>in</strong>terest rates, or o<strong>the</strong>r factors. Past performance of a particular <strong>in</strong>vestment product is not <strong>in</strong>dicativeof future results.Analysts, economists, and strategists are paid <strong>in</strong> part by reference to <strong>the</strong> profitability of <strong>HSBC</strong> which <strong>in</strong>cludes <strong>in</strong>vestmentbank<strong>in</strong>g revenues.For disclosures <strong>in</strong> respect of any company mentioned <strong>in</strong> this report, please see <strong>the</strong> most recently published report on thatcompany available at www.hsbcnet.com/research.* <strong>HSBC</strong> Legal Entities are listed <strong>in</strong> <strong>the</strong> Disclaimer below.Additional disclosures1 This report is dated as at 04 January 2011.2 All market data <strong>in</strong>cluded <strong>in</strong> this report are dated as at close 28 December 2010, unless o<strong>the</strong>rwise <strong>in</strong>dicated <strong>in</strong> <strong>the</strong> report.3 <strong>HSBC</strong> has procedures <strong>in</strong> place to identify and manage any potential conflicts of <strong>in</strong>terest that arise <strong>in</strong> connection with itsResearch bus<strong>in</strong>ess. <strong>HSBC</strong>'s analysts and its o<strong>the</strong>r staff who are <strong>in</strong>volved <strong>in</strong> <strong>the</strong> preparation and dissem<strong>in</strong>ation of Researchoperate and have a management report<strong>in</strong>g l<strong>in</strong>e <strong>in</strong>dependent of <strong>HSBC</strong>'s Investment Bank<strong>in</strong>g bus<strong>in</strong>ess. Information Barrierprocedures are <strong>in</strong> place between <strong>the</strong> Investment Bank<strong>in</strong>g and Research bus<strong>in</strong>esses to ensure that any confidential and/orprice sensitive <strong>in</strong>formation is handled <strong>in</strong> an appropriate manner.42
EconomicsGlobal4 January 2011abcDisclaimer* Legal entities as at 31 January 2010'UAE' <strong>HSBC</strong> Bank Middle East Limited, Dubai; 'HK' <strong>The</strong> Hongkong and Shanghai Bank<strong>in</strong>g CorporationLimited, Hong Kong; 'TW' <strong>HSBC</strong> Securities (Taiwan) Corporation Limited; 'CA' <strong>HSBC</strong> Securities (Canada)Inc, Toronto; <strong>HSBC</strong> Bank, Paris branch; <strong>HSBC</strong> France; 'DE' <strong>HSBC</strong> Tr<strong>in</strong>kaus & Burkhardt AG, Dusseldorf;000 <strong>HSBC</strong> Bank (RR), Moscow; 'IN' <strong>HSBC</strong> Securities and Capital Markets (India) Private Limited, Mumbai;'JP' <strong>HSBC</strong> Securities (Japan) Limited, Tokyo; 'EG' <strong>HSBC</strong> Securities Egypt S.A.E., Cairo; 'CN' <strong>HSBC</strong>Investment Bank Asia Limited, Beij<strong>in</strong>g Representative Office; <strong>The</strong> Hongkong and Shanghai Bank<strong>in</strong>gCorporation Limited, S<strong>in</strong>gapore branch; <strong>The</strong> Hongkong and Shanghai Bank<strong>in</strong>g Corporation Limited, SeoulSecurities Branch; <strong>The</strong> Hongkong and Shanghai Bank<strong>in</strong>g Corporation Limited, Seoul Branch; <strong>HSBC</strong>Securities (South Africa) (Pty) Ltd, Johannesburg; 'GR' <strong>HSBC</strong> Pantelakis Securities S.A., A<strong>the</strong>ns; <strong>HSBC</strong>Bank plc, London, Madrid, Milan, Stockholm, Tel Aviv, 'US' <strong>HSBC</strong> Securities (USA) Inc, New York; <strong>HSBC</strong>Yatirim Menkul Degerler A.S., Istanbul; <strong>HSBC</strong> México, S.A., Institución de Banca Múltiple, GrupoF<strong>in</strong>anciero <strong>HSBC</strong>, <strong>HSBC</strong> Bank Brasil S.A. - Banco Múltiplo, <strong>HSBC</strong> Bank Australia Limited, <strong>HSBC</strong> BankArgent<strong>in</strong>a S.A., <strong>HSBC</strong> Saudi Arabia Limited., <strong>The</strong> Hongkong and Shanghai Bank<strong>in</strong>g Corporation Limited,New Zealand Branch.Issuer of report<strong>HSBC</strong> Bank plc8 Canada Square, LondonE14 5HQ, United K<strong>in</strong>gdomTelephone: +44 20 7991 8888Fax: +44 20 7992 4880Website: www.research.hsbc.comThis document is issued and approved <strong>in</strong> <strong>the</strong> United K<strong>in</strong>gdom by <strong>HSBC</strong> Bank plc for <strong>the</strong> <strong>in</strong>formation of its Clients (as def<strong>in</strong>ed <strong>in</strong> <strong>the</strong> Rules of FSA) and thoseof its affiliates only. If this research is received by a customer of an affiliate of <strong>HSBC</strong>, its provision to <strong>the</strong> recipient is subject to <strong>the</strong> terms of bus<strong>in</strong>ess <strong>in</strong> placebetween <strong>the</strong> recipient and such affiliate. In Australia, this publication has been distributed by <strong>The</strong> Hongkong and Shanghai Bank<strong>in</strong>g Corporation Limited (ABN65 117 925 970, AFSL 301737) for <strong>the</strong> general <strong>in</strong>formation of its “wholesale” customers (as def<strong>in</strong>ed <strong>in</strong> <strong>the</strong> Corporations Act 2001). Where distributed to retailcustomers, this research is distributed by <strong>HSBC</strong> Bank Australia Limited (AFSL No. 232595). <strong>The</strong>se respective entities make no representations that <strong>the</strong>products or services mentioned <strong>in</strong> this document are available to persons <strong>in</strong> Australia or are necessarily suitable for any particular person or appropriate <strong>in</strong>accordance with local law. No consideration has been given to <strong>the</strong> particular <strong>in</strong>vestment objectives, f<strong>in</strong>ancial situation or particular needs of any recipient.<strong>The</strong> document is distributed <strong>in</strong> Hong Kong by <strong>The</strong> Hongkong and Shanghai Bank<strong>in</strong>g Corporation Limited and <strong>in</strong> Japan by <strong>HSBC</strong> Securities (Japan) Limited.Each of <strong>the</strong> companies listed above (<strong>the</strong> “Participat<strong>in</strong>g Companies”) is a member of <strong>the</strong> <strong>HSBC</strong> Group of Companies, any member of which may trade for itsown account as Pr<strong>in</strong>cipal, may have underwritten an issue with<strong>in</strong> <strong>the</strong> last 36 months or, toge<strong>the</strong>r with its Directors, officers and employees, may have a long orshort position <strong>in</strong> securities or <strong>in</strong>struments or <strong>in</strong> any related <strong>in</strong>strument mentioned <strong>in</strong> <strong>the</strong> document. Brokerage or fees may be earned by <strong>the</strong> Participat<strong>in</strong>gCompanies or persons associated with <strong>the</strong>m <strong>in</strong> respect of any bus<strong>in</strong>ess transacted by <strong>the</strong>m <strong>in</strong> all or any of <strong>the</strong> securities or <strong>in</strong>struments referred to <strong>in</strong> thisdocument. In Korea, this publication is distributed by ei<strong>the</strong>r <strong>The</strong> Hongkong and Shanghai Bank<strong>in</strong>g Corporation Limited, Seoul Securities Branch ("HBAPSLS") or <strong>The</strong> Hongkong and Shanghai Bank<strong>in</strong>g Corporation Limited, Seoul Branch ("HBAP SEL") for <strong>the</strong> general <strong>in</strong>formation of professional <strong>in</strong>vestorsspecified <strong>in</strong> Article 9 of <strong>the</strong> F<strong>in</strong>ancial Investment Services and Capital Markets Act (“FSCMA”). This publication is not a prospectus as def<strong>in</strong>ed <strong>in</strong> <strong>the</strong> FSCMA.It may not be fur<strong>the</strong>r distributed <strong>in</strong> whole or <strong>in</strong> part for any purpose. Both HBAP SLS and HBAP SEL are regulated by <strong>the</strong> F<strong>in</strong>ancial Services Commission and<strong>the</strong> F<strong>in</strong>ancial Supervisory Service of Korea. This publication is distributed <strong>in</strong> New Zealand by <strong>The</strong> Hongkong and Shanghai Bank<strong>in</strong>g Corporation Limited, NewZealand Branch.<strong>The</strong> <strong>in</strong>formation <strong>in</strong> this document is derived from sources <strong>the</strong> Participat<strong>in</strong>g Companies believe to be reliable but which have not been <strong>in</strong>dependently verified.<strong>The</strong> Participat<strong>in</strong>g Companies make no guarantee of its accuracy and completeness and are not responsible for errors of transmission of factual or analytical data,nor shall <strong>the</strong> Participat<strong>in</strong>g Companies be liable for damages aris<strong>in</strong>g out of any person’s reliance upon this <strong>in</strong>formation. All charts and graphs are from publiclyavailable sources or proprietary data. <strong>The</strong> op<strong>in</strong>ions <strong>in</strong> this document constitute <strong>the</strong> present judgement of <strong>the</strong> Participat<strong>in</strong>g Companies, which is subject to changewithout notice.This document is nei<strong>the</strong>r an offer to sell, purchase or subscribe for any <strong>in</strong>vestment nor a solicitation of such an offer. <strong>HSBC</strong> Securities (USA) Inc. acceptsresponsibility for <strong>the</strong> content of this research report prepared by its non-US foreign affiliate. All US persons receiv<strong>in</strong>g and/or access<strong>in</strong>g this report and<strong>in</strong>tend<strong>in</strong>g to effect transactions <strong>in</strong> any security discussed here<strong>in</strong> should do so with <strong>HSBC</strong> Securities (USA) Inc. <strong>in</strong> <strong>the</strong> United States and not with its non-USforeign affiliate, <strong>the</strong> issuer of this report. In S<strong>in</strong>gapore, this publication is distributed by <strong>The</strong> Hongkong and Shanghai Bank<strong>in</strong>g Corporation Limited, S<strong>in</strong>gaporeBranch for <strong>the</strong> general <strong>in</strong>formation of <strong>in</strong>stitutional <strong>in</strong>vestors or o<strong>the</strong>r persons specified <strong>in</strong> Sections 274 and 304 of <strong>the</strong> Securities and Futures Act (Chapter 289)(“SFA”) and accredited <strong>in</strong>vestors and o<strong>the</strong>r persons <strong>in</strong> accordance with <strong>the</strong> conditions specified <strong>in</strong> Sections 275 and 305 of <strong>the</strong> SFA. This publication is not aprospectus as def<strong>in</strong>ed <strong>in</strong> <strong>the</strong> SFA. It may not be fur<strong>the</strong>r distributed <strong>in</strong> whole or <strong>in</strong> part for any purpose. <strong>The</strong> Hongkong and Shanghai Bank<strong>in</strong>g CorporationLimited S<strong>in</strong>gapore Branch is regulated by <strong>the</strong> Monetary Authority of S<strong>in</strong>gapore. Recipients <strong>in</strong> S<strong>in</strong>gapore should contact a "Hongkong and Shanghai Bank<strong>in</strong>gCorporation Limited, S<strong>in</strong>gapore Branch" representative <strong>in</strong> respect of any matters aris<strong>in</strong>g from, or <strong>in</strong> connection with this report. <strong>HSBC</strong> México, S.A.,Institución de Banca Múltiple, Grupo F<strong>in</strong>anciero <strong>HSBC</strong> is authorized and regulated by Secretaría de Hacienda y Crédito Público and Comisión NacionalBancaria y de Valores (CNBV). <strong>HSBC</strong> Bank (Panama) S.A. is regulated by Super<strong>in</strong>tendencia de Bancos de Panama. Banco <strong>HSBC</strong> Honduras S.A. is regulatedby Comisión Nacional de Bancos y Seguros (CNBS). Banco <strong>HSBC</strong> Salvadoreño, S.A. is regulated by Super<strong>in</strong>tendencia del Sistema F<strong>in</strong>anciero (SSF). <strong>HSBC</strong>Colombia S.A. is regulated by Super<strong>in</strong>tendencia F<strong>in</strong>anciera de Colombia. Banco <strong>HSBC</strong> Costa Rica S.A. is supervised by Super<strong>in</strong>tendencia General deEntidades F<strong>in</strong>ancieras (SUGEF). Banistmo Nicaragua, S.A. is authorized and regulated by Super<strong>in</strong>tendencia de Bancos y de Otras Instituciones F<strong>in</strong>ancieras(SIBOIF).<strong>The</strong> document is <strong>in</strong>tended to be distributed <strong>in</strong> its entirety. Unless govern<strong>in</strong>g law permits o<strong>the</strong>rwise, you must contact a <strong>HSBC</strong> Group member <strong>in</strong> your homejurisdiction if you wish to use <strong>HSBC</strong> Group services <strong>in</strong> effect<strong>in</strong>g a transaction <strong>in</strong> any <strong>in</strong>vestment mentioned <strong>in</strong> this document. <strong>HSBC</strong> Bank plc is registered <strong>in</strong>England No 14259, is authorised and regulated by <strong>the</strong> F<strong>in</strong>ancial Services Authority and is a member of <strong>the</strong> London Stock Exchange. (070905)© Copyright. <strong>HSBC</strong> Bank plc 2010, ALL RIGHTS RESERVED. No part of this publication may be reproduced, stored <strong>in</strong> a retrieval system, or transmitted, onany form or by any means, electronic, mechanical, photocopy<strong>in</strong>g, record<strong>in</strong>g, or o<strong>the</strong>rwise, without <strong>the</strong> prior written permission of <strong>HSBC</strong> Bank plc. MICA (P)142/06/2010 and MICA (P) 193/04/201043
abcGlobal Economics Research TeamGlobalStephen K<strong>in</strong>gGlobal Head of EconomicsKaren WardSenior Global EconomistMadhur JhaEuropeJanet HenryChief European EconomistAstrid SchiloGermanyLothar HesslerFranceMathilde Lemo<strong>in</strong>eUnited K<strong>in</strong>gdomStuart GreenAndrew GranthamNorth AmericaKev<strong>in</strong> LoganRyan WangStewart HallAsia PacificQu Hongb<strong>in</strong>Manag<strong>in</strong>g Director, Co-head Asian Economics Research andChief Economist Greater Ch<strong>in</strong>aSophia MaAssociateEmerg<strong>in</strong>g Europe, Middle East and AfricaAlexander MorozovMurat UlgenSimon WilliamsLiz Mart<strong>in</strong>sLat<strong>in</strong> AmericaArgent<strong>in</strong>aJavier F<strong>in</strong>kmanChief Economist, South America ex-BrazilRamiro D BlazquezSenior EconomistJorge MorgensternEconomistBrazilAndre LoesChief EconomistConstant<strong>in</strong> JancsoSenior EconomistMarcos FernandesMexicoSergio Mart<strong>in</strong>Chief EconomistCentral AmericaLorena Dom<strong>in</strong>guezEconomistFrederic NeumannManag<strong>in</strong>g Director, Co-head Asian Economics ResearchLeif EskesenChief Economist, India & ASEANPaul BloxhamChief Economist, Australia and New ZealandSong Yi KimDonna KwokSherman ChanWellian WirantoSeiji ShiraishiYukiko TaniSun JunweiAssociate
Karen WardSenior Global Economist<strong>HSBC</strong> Bank plcKaren jo<strong>in</strong>ed <strong>HSBC</strong> <strong>in</strong> 2006 as UK economist. In 2010 she was appo<strong>in</strong>ted Senior Global Economist with responsibility for monitor<strong>in</strong>gchallenges fac<strong>in</strong>g <strong>the</strong> <strong>global</strong> <strong>economy</strong> and <strong>the</strong>ir implications for f<strong>in</strong>ancial markets. Before jo<strong>in</strong><strong>in</strong>g <strong>HSBC</strong> <strong>in</strong> 2006 Karen worked at <strong>the</strong>Bank of England where she provided support<strong>in</strong>g analysis for <strong>the</strong> Monetary Policy Committee. She has an MSc Economics fromUniversity College London.