Nadi Floods - Pacific Disaster Net
Nadi Floods - Pacific Disaster Net
Nadi Floods - Pacific Disaster Net
- No tags were found...

You also want an ePaper? Increase the reach of your titles
YUMPU automatically turns print PDFs into web optimized ePapers that Google loves.
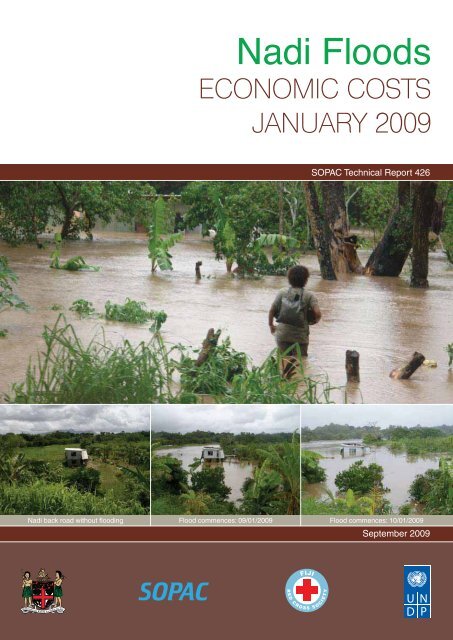
<strong>Nadi</strong> <strong>Floods</strong>ECONOMIC COSTSJANUARY 2009SOPAC Technical Report 426<strong>Nadi</strong> back road without flooding Flood commences: 09/01/2009 Flood commences: 10/01/2009September 2009
AUTHORPaula HollandSOPAC SecretariatFor more copies of this report, apply to the SOPAC Secretariat at the address belowPACIFIC ISLANDS APPLIED GEOSCIENCE COMMISSIONSOPAC SecretariatPrivate Mail BagGPO, SuvaFIJI ISLANDSPhone: +679 338 1377Fax: +679 337 0040E-mail: director@sopac.orgWebsite: www.sopac.orgFront cover images courtesy of (i) SOPAC (ii) Nigel Dowdeswell
Economic costs of January 2009 <strong>Nadi</strong> floodsSOPAC Technical Report 426September 2009
Economic costs of January 2009 <strong>Nadi</strong> floodsSOPAC Technical Report 4264
Economic costs of January 2009 <strong>Nadi</strong> floodsCONTENTSABBREVIATIONS....................................................................................................................................................................................................................... 6ACKNOWLEDGEMENTS............................................................................................................................................................................................. 7EXECUTIVE SUMMARY................................................................................................................................................................................................. 8A INTRODUCTION............................................................................................................................................................................................................ 12The floods............................................................................................................................................................................................................................................................ 12Purpose of this study.......................................................................................................................................................................................................................... 13Structure of this report....................................................................................................................................................................................................................... 13B METHOD................................................................................................................................................................................................................................... 14Scope of work............................................................................................................................................................................................................................................... 14Survey design............................................................................................................................................................................................................................................... 15Population sizes......................................................................................................................................................................................................................................... 16Sampling............................................................................................................................................................................................................................................................... 17Data cleaning................................................................................................................................................................................................................................................. 18Qualitative data............................................................................................................................................................................................................................................. 19Logistics and survey piloting................................................................................................................................................................................................... 19C HOUSEHOLD SAMPLE IMPACTS........................................................................................................................................................ 20Environmental change..................................................................................................................................................................................................................... 20Health impacts............................................................................................................................................................................................................................................. 20Gross monetary losses.................................................................................................................................................................................................................... 21Intangible losses........................................................................................................................................................................................................................................ 23D BUSINESS SAMPLE IMPACTS................................................................................................................................................................. 25Retail business losses...................................................................................................................................................................................................................... 26Eatery losses................................................................................................................................................................................................................................................... 26Wholesaler/manufacturer/exporter losses.......................................................................................................................................................... 27Service sector losses.......................................................................................................................................................................................................................... 27Total business losses, by sample.................................................................................................................................................................................... 28Intangible losses........................................................................................................................................................................................................................................ 30E TOTAL SAMPLE IMPACTS............................................................................................................................................................................... 31Interpretation of sample losses............................................................................................................................................................................................ 31Hotels on Denarau Island........................................................................................................................................................................................................... 31F ESTIMATED LOSSES FROM THE 2009 FLOOD.............................................................................................................. 33Total losses over the survey area..................................................................................................................................................................................... 33Other losses..................................................................................................................................................................................................................................................... 35Interpretation of the estimates.............................................................................................................................................................................................. 35G POLICY ISSUES............................................................................................................................................................................................................... 36Community perceptions and expectations........................................................................................................................................................ 36Awareness and response............................................................................................................................................................................................................ 38Dissemination of information, alerts and warnings................................................................................................................................ 39Insurance............................................................................................................................................................................................................................................................. 42Benefits from the flood..................................................................................................................................................................................................................... 42REFERENCES................................................................................................................................................................................................................................... 43ANNEX 1 TERMS OF REFERENCE......................................................................................................................................................... 43ANNEX 2 QUESTIONNAIRES........................................................................................................................................................................... 46ANNEX 3 FIJI FLOOD IMPACT ASSESSMENT: TRAINING NOTES........................................................... 69ANNEX 4 CALCULATING HOUSEHOLD POPULATION SIZE............................................................................. 75ANNEX 5 CALCULATING BUSINESS POPULATION SIZE...................................................................................... 76ANNEX 6 SUMMARY OUTCOMES OF FOCUS GROUP DISCUSSIONS........................................ 785SOPAC Technical Report 426
Economic costs of January 2009 <strong>Nadi</strong> floodsFIGURESFigure 1: <strong>Nadi</strong> survey area (inundation and census districts)...................................................................................................................................... 15Figure 2: Rural and urban <strong>Nadi</strong> overlaying survey area....................................................................................................................................................... 16Figure 3: <strong>Nadi</strong> sample household losses, by cost category.......................................................................................................................................... 22Figure 4: Total <strong>Nadi</strong> sample business losses, by cost category*........................................................................................................................... 29TABLESTable 1: National flood damage assessments................................................................................................................................................................................ 12Table 2: Interviewers for the survey................................................................................................................................................................................................................... 15Table 3: Commercial enterprises around the <strong>Nadi</strong> survey area............................................................................................................................ 17Table 4: Sample size of the <strong>Nadi</strong> business survey, by business type........................................................................................................... 17Table 5: Sample size of the <strong>Nadi</strong> surveys............................................................................................................................................................................................... 18Table 6: Health impacts reported by <strong>Nadi</strong> households...................................................................................................................................................... 21Table 7: <strong>Nadi</strong> sample household loss, by loss size................................................................................................................................................................ 21Table 8: <strong>Nadi</strong> sample household losses, by cost category......................................................................................................................................... 22Table 9: Irreplaceable items lost by <strong>Nadi</strong> households......................................................................................................................................................... 24Table 10: <strong>Nadi</strong> sample business loss, by loss size...................................................................................................................................................................... 25Table 11: <strong>Nadi</strong> sample retail* losses, by loss size......................................................................................................................................................................... 26Table 12: <strong>Nadi</strong> sample eatery losses, by loss size......................................................................................................................................................................... 26Table 13: <strong>Nadi</strong> sample wholesaler/manufacturer/exporter losses......................................................................................................................... 27Table 14: <strong>Nadi</strong> sample service sector losses....................................................................................................................................................................................... 28Table 15: Total <strong>Nadi</strong> sample business losses..................................................................................................................................................................................... 28Table 16: Total <strong>Nadi</strong> sample business losses, by cost category............................................................................................................................. 29Table 17: Total <strong>Nadi</strong> community losses, by sample.................................................................................................................................................................... 31Table 18: Provisional total household losses over survey area, by cost category........................................................................... 34Table 19: Provisional total business losses over survey area, by business type................................................................................ 34Table 20: Provisional total business losses over survey area, by cost category................................................................................ 34Table 21: Total <strong>Nadi</strong> community losses over survey area.................................................................................................................................................. 34Table 22: Perceived flood causes/needed responses............................................................................................................................................................ 36Table 23: Prior knowledge of flood risk.......................................................................................................................................................................................................... 38Table 24: Taking measures to protect property and assets............................................................................................................................................. 39Table 25: Household membership of organisations.................................................................................................................................................................. 39Table 26: Household membership of Christian groups........................................................................................................................................................ 40Table 27: Household membership of other religions................................................................................................................................................................ 40Table 28: Household membership of community groups................................................................................................................................................. 40Table 29: Business membership of Christian groups.............................................................................................................................................................. 40Table 30: Business membership of other religions..................................................................................................................................................................... 40Table 31: Business membership of community groups....................................................................................................................................................... 40Table 32: Access to phones and radios....................................................................................................................................................................................................... 41Table 33: Best means of emergency contact (day time)...................................................................................................................................................... 41Table 34: Best means of emergency contact (night time).................................................................................................................................................. 41Table 35: Insurance coverage..................................................................................................................................................................................................................................... 42ABBREVIATIONSSOPAC Technical Report 4266DISMACFRCSICTNDMOSOPACUNDPNational <strong>Disaster</strong> Management OfficeFiji Red Cross Societyinformation and communication technologyNational <strong>Disaster</strong> Management Office<strong>Pacific</strong> Islands Applied Geoscience CommissionUnited Nations Development Programme
Economic costs of January 2009 <strong>Nadi</strong> floodsACKNOWLEDGEMENTSThanks are extended to the Government of Fiji for helping facilitate this assessment. The FijiIslands Bureau of Statistics provided data on census enumeration districts and populationlevels, while the Ministry of Youth and Sports provided volunteers to help conduct the surveyinterviews.The Commissioner for the Western Division, Mr Joeli Rokovada, and the Director of theNational <strong>Disaster</strong> Management Office, Mr Joeli Cawaki, provided public support to enablesurveys conducted for this assessment. The <strong>Nadi</strong> District Officer provided staff to conductsurvey interviews, logistical assistance in the convening of stakeholder meetings, venuesfor survey operations, and help with cultural exchanges with greater <strong>Nadi</strong> villages. Particularthanks go to Mr Peni Nadredre and Mr Panapasa Quro for their extensive assistance.Other agencies and individuals were also important in the conduct of this work. The Fiji RedCross provided volunteers to conduct survey interviews. The United Nations DevelopmentProgramme (UNDP) – <strong>Pacific</strong> Centre supplied technical staff to help manage and conductsurveys, undertake data entry and review reports. Mr Atu Kaloumaira and Mr AnthonyBlake assisted with logistics during the planning phases of the assessment. Dr Padma Lal,Chief Technical Adviser of the International Union for Conservation of Nature, providedinput and feedback on survey design.The following <strong>Pacific</strong> Islands Applied Geoscience Commission (SOPAC) staff are alsogratefully acknowledged: Michael Bonte-Grapentin for up-to-date information on the spreadand severity of the <strong>Nadi</strong> floods; Angela Ambroz for assistance in survey design and mappreparation and management; Wolf Forstreuter, Elizabeth Whippy, Joy Papao and LitiaGaunavou of the SOPAC ICT team for the digitisation of data, the generation of maps forsurvey design, and the calculation of areas and population figures; and Reshika Singh,Sereima Kalouniviti, Shabnam Shainaz Ali, Fane Ravula, Sarafina Talei and Amrit Sharmafor helping with data entry and data cleaning.Finally, many thanks to the community of <strong>Nadi</strong> for its enthusiasm and support. We werehumbled by the community’s participation and openness during a time of enormous loss.We sincerely hope the findings of this study will be used constructively to make life moreresilient and safe in <strong>Nadi</strong>.7SOPAC Technical Report 426
Economic costs of January 2009 <strong>Nadi</strong> floodsEXECUTIVE SUMMARYIn January 2009, heavy rain resulting from a tropical depression caused severe flooding in theNorth, Central and Western divisions of Fiji. <strong>Floods</strong> in <strong>Nadi</strong> led to death, severe damage andmajor disruption to services. This report documents a socioeconomic assessment of grosslosses sustained by the local community in <strong>Nadi</strong> as a result of those floods. The Governmentof Fiji agreed for SOPAC to organise the assessment, which estimated losses for familiesand retail businesses, eateries, manufacturers/exporters and service businesses. (Hotels onDenarau Island were not included in the estimates of business losses.)For the assessment, SOPAC used a sample of 947 households and businesses across greater<strong>Nadi</strong> as the basis for damage estimates (table A). It estimated gross losses for the sampleinterviewed, then extrapolated for all families and equivalent businesses across the surveyregion.Table A: Sample size, <strong>Nadi</strong>Questionnaire usedHouseholds 717Businesses 230Total 947Losses, by sampleAfter the <strong>Nadi</strong> floods, 717 householders were interviewed about flood damage. Presumablydue to variation in inundation and personal wealth, the gross losses reported by householdsvaried extensively, from nil to over F$60 000 (table B). The 10 per cent of households whosustained losses of over F$10 000 each accounted for almost half of total losses reported. Bycomparison, two thirds of households reported individual losses of F$3000 or less, and theyaccounted for only 16 per cent of total household losses.Table B: Reported household losses, <strong>Nadi</strong> survey areaLosses perbusiness (F$)Share of sample(%)Total losses forsample (F$’000)Share of totallosses (%)SOPAC Technical Report 4268Nil 22 0 01–1000 21 97 41001–3000 22 334 123001–6000 17 500 196001–10 000 9 541 2010 001+ 10 1 198 45Total 100 2 670 100
Economic costs of January 2009 <strong>Nadi</strong> floodsFor the households interviewed, flood losses were valued at around F$2.7 million gross (tableB), with structural damage and loss of personal possessions accounting for almost 90 per centof total losses (figure A).Figure A: Sample household losses, by cost category, <strong>Nadi</strong> survey area4%1%6%1%Total losses, by categoryStructural damagePersonal possessionsClean-upMedical costsLost income43%45%Evacuation costsThere were 230 businesses interviewed following the floods. They included retail outlets,eateries, wholesalers/exporters and service sector businesses (including transport). Gross floodlosses for the sample were around F$32 million (table C), with the greatest proportion of lossesarising in the retail sector. Around one third of losses arose because business services weredisrupted (staff/clients were unable to reach the premises, the power and water were out, etc.)(figure B).Table C: Sample business losses, <strong>Nadi</strong> survey areaTotal lossessample (F$m)Lost businesscomponent (F$’000)Share of businesslost (%)Retail, inc. petrol 18 8 44Eateries 1 0 25Exporters,manufacturers,wholesalers2 1 42Services 12 1 12Total 32 10 –9SOPAC Technical Report 426
Economic costs of January 2009 <strong>Nadi</strong> floodsFigure B: Sample business losses, by cost category, <strong>Nadi</strong> survey area2%12%32%37%16%Total losses, by categoryStructural damageLost assetsClean-up costsDisrupted businessOtherTotal losses for the <strong>Nadi</strong> community sampled were thus around F$35 million gross (table D).Table D: Total <strong>Nadi</strong> losses, by sampleValue (F$m) Share (%)Household 2.7 8Business 32.1 92Total 34.8 100Total estimated losses for the sample areaExtrapolating sample losses to households and like businesses in the survey region, totalgross losses from the flood were an estimated F$244 million, of which the business communitysustained 94 per cent (table E). The extent of economic losses may appear surprisingly high,but household and business surveys are rarely conducted following disasters, so private lossesare seldom reported in any detail. Further, few survey respondents had any insurance, so eventhe private sector would rarely calculate losses for households and private businesses.Table E: Total estimated losses for <strong>Nadi</strong> survey areaValue (F$m) Share (%)Household 14.5 6Business 229.5 94Total 244.0 100SOPAC Technical Report 42610The values provided are only provisional estimates because they had to be generated quicklyfollowing the floods. They likely understate actual private losses, because (i) lost businessto hotels on Denarau Island was not estimated (and is likely to be substantial); (ii) the totalloss figure does not include any values for trauma or the loss of irreplaceable items such asbusiness records; (iii) medical costs to families were subsidised by free health care madeavailable during the emergency; and (iv) many householders and businesses were unable toestimate (or unprepared to disclose) some losses (for example, they did not know the valueof some lost assets). Nevertheless, the estimates here do provide an order of magnitude forprivate losses.
Economic costs of January 2009 <strong>Nadi</strong> floodsPolicy issuesOn average, only 1 per cent of families and 12 per cent of businesses interviewed noted havingany insurance to help them replace losses sustained during the floods. This lack of insurancecan be expected to impede flood recovery, especially given many businesses and householdsstated they had no means to recover from the damage and might never recover.Given the business earnings lost as a result of the floods, the loss of taxes from continuedinoperation of businesses in <strong>Nadi</strong> is a national economic concern. Options to assist businesses(and households) to resume operations following future floods would substantially benefit theFiji tax base. One option may be for the Government of Fiji to investigate how to increaseaccess to loans or access to business insurance (given some businesses observed insuranceis not always available where they operate). This approach would be consistent with thegovernment’s views in its February 2009 Consolidated Report on Flash <strong>Floods</strong> that there is aneed to review the insurance industry. Discussions with the Chamber of Commerce and otherstakeholder groups may also be helpful.Water quality was reported to deteriorate significantly during the floods and, according to thesurvey, the problem frequently persisted weeks later. Of the household sampled, 70 per centstated the water in their taps and/or in the river was not safe to drink following the floods, orwas extremely dirty. This may partly explain the level of diarrhoea, skin infections, typhoid andfevers that respondents reported following the floods. Identifying short term solutions to waterquality protection for families is thus critical to minimise health problems during any futurefloods. Equally importantly, long term watershed management and water quantity and qualityimprovement are critical to minimise future flood frequency and impacts around <strong>Nadi</strong>.The government will also need to manage the <strong>Nadi</strong> community’s perceptions of the cause ofthe floods. The most common perception was that poor drainage and lack of river dredgingwere responsible. Consequently, there is a strong public view that the government shouldengage in resolving these issues. The government may need to technically assess the actualflood causes and the solutions perceived necessary by the community, to determine theappropriateness of those solutions. It would then need to assess how and when to addressthe causes, and communicate that information to the community. If the community’s perceivedsolutions are not appropriate and thus not pursued, the government risks being viewed asineffective or irresponsible. Strategic awareness raising and communications work aroundflood causes and treatment will thus be valuable.More generally, awareness of flood risks in <strong>Nadi</strong> will need to be increased, along with awarenessof how to respond during a flood alert or warning. Few people seemed to recognise that floodsare a natural occurrence around <strong>Nadi</strong>, and only half of those interviewed were aware they livedand/or operated in a flood risk area. Raising community awareness of the inherent flood risksaround <strong>Nadi</strong> is likely to enhance disaster preparedness for future floods. Community awarenessmaterials on disaster preparedness, as well as the continued effective dissemination of disasterwarnings, are also important aspects of disaster risk management in <strong>Nadi</strong>. Many communityrepresentatives have called for improved flood warning systems generally.11SOPAC Technical Report 426
A.Economic costs of January 2009 <strong>Nadi</strong> floodsINTRODUCTIONThe floodsHeavy rain resulting from a tropical depression and falling mainly during 7–10 January causedsevere flooding in the North, Central and Western Divisions of Fiji in January 2009 (OCHA 2009).Areas devastated by the flood included the towns of <strong>Nadi</strong>, Ba and Labasa. At the height of thefloods on 16 January, 169 evacuation centres catered for 11 458 people (Government of Fiji2009). Nationwide, 11 fatalities occurred, including two deaths from flood related landslides. TheGovernment of Fiji declared a 30 day state of natural disaster on 11 January.The government assessed the cost of the floods over January and February 2009, estimatingimmediate costs (by mid-February) of around F$113 million (table 1). The estimated lossesmostly do not include losses sustained by households. They do include some losses to theprivate sector, although these estimates are expected to be provisional.Table 1: National flood damage assessmentsSectorCentral/eastern (F$)Western (F$)Northern(F$)Total (F$)Roads 7 506 620 15 173 422 5 771 260 28 451 302Water and sewerage 740 000 6 950 000 3 530 000 11 220 000Crops 3 031 746 12 370 653 565 647 15 968 046Livestock 1 680 201 2 280 316 35 282 3 995 799Drainage 1 607 723 15 863 789 1 994 500 19 466 012Education 138 000 915 960 420 000 1 473 960Health 350 000 130 000 35 000 515 000Housing 3 000 000 3 000 000Sugar 24 600 000 24 600 000Telecommunications 1 300 000Electricity 3 000 000Total 15 054 290 81 284 140 12 351 689 112 990 119SOPAC Technical Report 42612Source: Government of Fiji 2009.
Economic costs of January 2009 <strong>Nadi</strong> floodsPurpose of this studyFollowing the floods, the Government of Fiji agreed with the <strong>Pacific</strong> Islands Applied GeoscienceCommission (SOPAC) to organise a socioeconomic impact assessment of the floods onhouseholds and businesses in <strong>Nadi</strong>. This report describes the findings of that assessment.The assessment – which was conducted in collaboration with the UNDP <strong>Pacific</strong> Centre andwith the assistance of the Government of Fiji and the Fiji Red Cross Society – was conductedimmediately following the floods. It was intended to provide the government with rapid informationon the state of private losses, with a view to reporting at the end of March/early April 2009. Thiswork fills a gap in flood assessment because the government does not conventionally havesufficient resources to assess losses to households. It also estimates losses (detailing type andextent) to the private business sector of <strong>Nadi</strong>.The assessment is intended to help improve advocacy, decision making and investmentanalysis for flood mitigation and warning for <strong>Nadi</strong>. The information will also help internationalagencies identify assistance programs for <strong>Nadi</strong>. Annex 1 contains the broad terms of referencefor the assessment.Structure of this reportSection B of this report contains a brief overview of the method used to assess damage tothe <strong>Nadi</strong> households and business community. Section C presents the estimated householdlosses sustained by those sampled, while section D presents the business losses amongthose sampled. Section E presents total losses for the sample; in section F, the estimates areextrapolated to determine total losses to all families and applicable businesses across thesurvey area. Section G discusses policy issues relating to flooding.13SOPAC Technical Report 426
B.Economic costs of January 2009 <strong>Nadi</strong> floodsMETHODThe floodsSample surveys were used to collect information on the costs to households and businessesfrom the <strong>Nadi</strong> floods. The purpose of the surveys was to obtain a better understanding of:• the types of damage that families and businesses experienced as a result of the flooding• the financial costs of any damage or losses• how people coped with the floods.Given some businesses might have incurred losses even if not flooded (interrupted business),interviews were also conducted on Denarau Island.Scope of workSectors coveredThe assessment targeted <strong>Nadi</strong> businesses and households. (Businesses included fixed outletssuch as shops, services and manufacturers, but also market stalls and hawkers.) It excludedsectors that are the responsibility of the government to assess (for example, education, health,infrastructure and primary production). However, to the extent that surveyed retail businessessold fresh produce (for example, supermarkets and stall holders), some agricultural productswere covered.TimingSurvey interviews were conducted six weeks after the floods, during 16–20 February 2009. Thistime gap following the floods was intended to ensure households and businesses were ableto recover somewhat from the floods and make some assessment of their losses, but beforerecall problems arose. (<strong>Disaster</strong> surveys are subject to recall failure whereby respondents cannotremember the losses sustained or the value of losses—see Holland 2008 for examples).Area coveredSOPAC Technical Report 42614At the time of the survey (mid-February 2009), SOPAC had assessed the inundation from theflood (figure 1).
Economic costs of January 2009 <strong>Nadi</strong> floodsThe sample survey areas were based on the enumeration districts used by the Fiji IslandsBureau of Statistics to conduct the census. Each enumeration district contains around 60–140households, with an average of 100 households per district nationally. It was not possible tocover the entire flood area of <strong>Nadi</strong> (given time constraints), although 27 enumeration districtsin the inundated area were selected for the <strong>Nadi</strong> household survey. Additionally, the businesssurvey included Denarau Island, to ensure loss estimates included the valuable tourismoperations located there. Figure 1 shows the enumeration districts used for the surveys.Figure 1: <strong>Nadi</strong> survey area (inundation and census districts)Source: SOPAC.Survey designAll survey questionnaires used closed and open ended questions (annex 2). A total of 63 stafffrom the Fiji Red Cross, <strong>Nadi</strong> town (via the <strong>Nadi</strong> District Office), the Ministry of Youth and Sports,SOPAC and United Nations Development Programme (UNDP) – <strong>Pacific</strong> Centre conducted theinterviews with local residents (table 2). Interviewers were given half a day of training on how toconduct the survey (annex 3). SOPAC staff keyed in and analysed the data.Table 2: Interviewers for the surveyAgencyNumber of interviewers providedFiji Red Cross 18<strong>Nadi</strong> town (via the <strong>Nadi</strong> District Office) 31Ministry of Youth 12SOPAC 1UNDP 1Total 6315SOPAC Technical Report 426
Economic costs of January 2009 <strong>Nadi</strong> floodsPopulation sizesHousehold surveysInformation on the population in any enumeration district was gathered from the 2007 censusby the Fiji Islands Bureau of Statistics. The total population for greater <strong>Nadi</strong> is around 9624households (a population of around 44 137 people). Of this group, around 3905 households (41per cent of households from greater <strong>Nadi</strong>) were located in the survey area (annex 4).Business surveysAnnex 5 provides details of the population assessment for the business survey. Briefly,businesses licensed to operate around <strong>Nadi</strong> were categorised according to whether theyoperated in <strong>Nadi</strong>’s urban or rural area (figure 2). The <strong>Nadi</strong> Town Council’s licensing sectionprovided data for the urban businesses; the <strong>Nadi</strong> District Office provided data on businessesfrom the <strong>Nadi</strong> rural area. The total number of relevant businesses across greater (urban andrural) <strong>Nadi</strong> was estimated at 3795 (table 3, annex 5). This number excluded key schools forthe area (because the Department of Health assesses damage to the educational sector). Thesurvey covered around 37 per cent of the greater (urban and rural) <strong>Nadi</strong> area. Gaps in thelicensing data made it impossible to discern the actual number of businesses in this surveyarea (as opposed to the non-surveyed area) (annex 5). Instead with 37 per cent of the greater<strong>Nadi</strong> area surveyed, 1 it was assumed that the total number of businesses represented in thesurvey was 1389 (table 3).Figure 2: Rural and urban <strong>Nadi</strong> overlaying survey areaSOPAC Technical Report 42616Source: SOPAC.1Calculated using geographic information systems (GIS).
Economic costs of January 2009 <strong>Nadi</strong> floodsTable 3: Commercial enterprises around the <strong>Nadi</strong> survey areaTotal businesspopulation for greater<strong>Nadi</strong> areaBusiness populationrepresented insurveyRetail (inc. Petrol) 1431 524Eateries 337 123Exporters, manufacturers, wholesalers 165 60Services 1862 682Total 3795 1389SamplingSurveys were conducted across selected enumeration districts outlined by the Bureau ofStatistics (figure 2).HouseholdsInterviewers were directed to target every third house within assigned enumeration districts, todetermine flood losses spatially across the area. Unfortunately, several groups of interviewersstrayed outside their assigned districts, so it was ultimately not possible to tell how many ofeach questionnaire came from one district rather than a neighbouring one. For this reason,losses could not be calculated by enumeration district, but only as a single value for the entiresurvey area. The total number of household interviews used for survey calculations was 717,around 18 per cent of the 3905 households across the survey area (table 5).BusinessesInterviewers were directed to target as many businesses per district as possible. The totalnumber of business interviews used for survey calculations was 230, representing roughly 17per cent of the overall number of businesses in the survey area (although representation withinbusiness categories varied) (tables 4 and 5).Table 4: Sample size of the <strong>Nadi</strong> business survey, by business typeTotalbusinesspopulationBusinesspopulationrepresentedNumbersampledSamplerepresentation(%)Retail (inc. Petrol) 1431 524 155 30Eateries 337 123 13 11Exporters,manufacturers,wholesalers165 60 6 10Services 1862 682 56 8Total 3795 1389 230 17* Includes transport (freight, buses, taxis), hotel and non-defined businesses.17SOPAC Technical Report 426
Economic costs of January 2009 <strong>Nadi</strong> floodsTable 5: Sample size of the <strong>Nadi</strong> surveysSample sizePopulationrepresentedSamplerepresentation(%)<strong>Nadi</strong> households 717 3905 18<strong>Nadi</strong> businesses 230 1389 17Data cleaningThe majority of households and businesses invited to participate in the survey accepted. Asmall number of individuals did not participate because they considered the survey would notlead to real changes in flood management. In addition, some families were still cleaning upand/or rebuilding their houses, so could not dedicate time to the survey.Some questionnaires had to be deleted from the sample survey because:• the answers appeared unreliable (for example, the answers did not make sense or theperson interviewed was inappropriate, being a visitor or a young person not familiar withthe value of losses)• the answers were so extreme that they were either highly questionable or would distortestimates of average values and total estimated losses. In some cases, sample householdswere considered to have double counted business losses and personal losses so wereremoved from the survey.Other changes included the following:• Selected answers of some questionnaires were omitted because people did not provideaccurate responses to questions—for example, when asked ‘Before January this year,when did you last suffer flooding here?’, the respondent might have answered ‘lots’, orwhen asked about the value of losses, they might have answered ‘quite a lot’. Theseanswers had to be removed from calculations because the actual values were not clear.• Some answers were logically impossible—for example, some people suggested thefloods had disrupted their businesses for eight weeks, yet the floods had occurred only sixweeks previously. In such a case, the figures were rounded down to six weeks or removedfrom the calculations.• For any loss estimates given as a range (for example, F$4000–5000), the mathematicalaverage was taken.• One business working week was assumed to comprise six working days.• Where certain problems were ongoing (to date as of the survey), they were assumed to last42 days (six weeks of seven days).SOPAC Technical Report 42618
Economic costs of January 2009 <strong>Nadi</strong> floodsQualitative dataBecause questionnaires are relatively fixed in content (although interviewees were givenopportunity to provide more general views on the <strong>Nadi</strong> floods), focus group sessions werealso hosted with the community (business, family and government groups) to obtain a deeperunderstanding of the nature and scale of the disaster, and of options for mitigation in thefuture.Logistics and survey pilotingA business and community briefing session was conducted the week before the survey toadvise the local community of the survey’s purpose and nature. Representatives from thegovernment and local community attended. The survey targeted the greater <strong>Nadi</strong> area as wellas the <strong>Nadi</strong> central business district. Up to eight villages were targeted in the survey: Sikituru,Yavusania, Namotomoto, Saunaka, Nakavu, Nawaka, Vunayasi and Narewa. To ensure correctprotocols were observed within the villages, the District Officer and Turaga ni Koro conducteda sevusevu on behalf of the survey team on the weekend preceding the survey.Interviewer training was conducted on the first morning of the survey, covering:• the purpose of the survey and survey questions• the scope of the survey• logistics (the dropping off and collection of interviewers, the constitution of teams etc.).A pilot of the survey was conducted on the first afternoon to trial questionnaire effectivenessand analysis, and the transport of enumerators to and from interview areas. The questionnairewas not amended, but the precise information sought from questions was emphasised forinterviewers where answers during the pilot were weak.During the survey proper, teams were dropped off and collected in four batches, given thephysical breadth of the survey area. After completing their district, teams were re-assigned toother districts to assist other teams. As already indicated, the survey did not cover all of <strong>Nadi</strong>.One reason was the sheer size of the area to cover. Logistical problems were another reason—for example, some areas had been so destroyed that no-one was left to interview.19SOPAC Technical Report 426
C.Economic costs of January 2009 <strong>Nadi</strong> floodsHOUSEHOLD SAMPLEIMPACTSThe <strong>Nadi</strong> River is a focal part of life in the local community. Just under two thirds (63 per cent)of interviewed households stated they relied on the <strong>Nadi</strong> River for some purpose, whetherfishing, clothes washing, recreation and/or irrigation. Most commonly, those who relied on theriver stated they did so for fishing purposes, although a relatively large number of people alsorelied on the river for irrigation or for washing during water cuts. Generally, the householdsand businesses interviewed considered that the quality of the <strong>Nadi</strong> River has been changingover time, even without the January floods. Focus group discussions conducted as part ofthe assessment (annex 6) suggested, where people perceived changes in the river, that theriver had become shallower and/or soil erosion had led to increased sedimentation. Thesechanges were considered to result in fishing being more difficult (with boats becoming stuckin the silt). Some residents also perceived the river water as more polluted generally.Environmental changeFollowing the January floods, respondents reported a large number of changes in the quality ofthe <strong>Nadi</strong> River’s water and safety. Common complaints were an increase in unpleasant smellsfrom the river, an increase in river murkiness, a bad taste in the tap water and sometimes nowater at all. (In most cases, households were without water or water supplies only for shortperiods.) The most commonly reported complaint was the loss of safe drinking water, with70 per cent of respondents stating that the tap water following the floods tasted bad or wastoo dirty to drink. In some cases, respondents indicated reasons for the increase in smell orpollution (the flooding of pit toilets, for example), but in most cases, no reasons were given.On average, most householders indicated that water related problems eased after two weeks.However, many respondents observed that the problems persisted for weeks, even to the timeof the survey (which was six weeks after the flood). Of householders interviewed, 10 per centstated that water quality or quantity problems persisted to the time of the survey. Following thefloods, some householders resorted to using rain water to avoid the use of polluted tap water.Health impactsSOPAC Technical Report 42620Health impacts arose either directly from the flooding (injuries) or as a result of subsequentpoor environmental quality. Sickness and injuries were reported by 31 per cent of households(table 6), with diarrhoea, skin infections, typhoid and fevers being the most commonly reportedeffects.
Economic costs of January 2009 <strong>Nadi</strong> floodsTable 6: Health impacts reported by <strong>Nadi</strong> householdsDiarrhoea / dysenteryEye infectionsFeverCuts and boils / sores / skin infectionsHeadaches / body achesVomitingTyphoidScabiesCuts, bruises, knocks, dislocationsParalysisDeathCoughs or asthmaColds or ‘fluRingwormDengue / malariaMany of the health impacts (particularly diarrhoea, fevers and infections) are likely to be linked tothe deterioration in water quality following the floods. This relationship is likely to be intensifiedwhere litter and waste were concentrated for long periods. Additionally, the incidence of dengueand malaria following the floods is affected by the length of time that water is left standing.Gross monetary lossesResponses from 717 households across <strong>Nadi</strong> were used for survey calculations. Total lossesreported by the 717 households interviewed were around F$2.7 million gross. Presumablydue to variation in inundation and personal wealth, the reported losses per household variedextensively, ranging from nil to over F$60 000 (table 7).The majority of households (two thirds) reported individual losses of F$3000 or less. Theircombined losses, however, accounted for only 16 per cent of total losses sustained by thesample. By comparison, 9 per cent of families reported losses of over F$10 000 each. Theircombined losses accounted for almost half of the total sample losses (table 7).Table 7: <strong>Nadi</strong> sample household loss, by loss sizeLoss perhousehold (F$)NumbersampledShare ofsample(%)Totalsample loss(F$’000)Share of totalsample loss(%)Nil 155 22 0 01–1000 151 21 97 41001–3000 157 22 334 123001–6000 119 17 500 196001–10 000 65 9 541 2010 001+ 70 10 1198 45Total 717 100 2670 10021SOPAC Technical Report 426
Economic costs of January 2009 <strong>Nadi</strong> floodsThe monetary value of household losses comprised:• structural damage to the house• the value of personal possessions lost (the value of the item or the cost of replacement orrepair)• clean-up costs• medical costs• lost income• evacuation costs.For the sample households as a whole, the losses arising from structural damage and damageto personal possessions constituted almost 90 per cent of losses (figure 3). The values of lossesfrom structural damage and damage to personal possessions were largely equal (table 8).Figure 3: <strong>Nadi</strong> sample household losses, by cost category4%1%6%1%Total losses, by categoryStructural damagePersonal possessionsClean-upMedical costsLost income43%45%Evacuation costsMedical costs related to expenditure associated with illnesses or injuries incurred during, oras an immediate result of, the floods. Overall, these costs were relatively low as a proportionof total costs, partly because many households received free medical assistance during thedisaster, but also because many families were unable to recall the amount they had spenton medicines. Medical costs reflected a high component of travel costs because familiesfrequently had to travel to the hospital or medical centre by taxi. As an alternative to formalmedical assistance, many families used traditional therapies to treat injuries and sicknessesresulting from the floods.SOPAC Technical Report 42622Table 8: <strong>Nadi</strong> sample household losses, by cost categoryF$’000Structural damage 1201Personal possessions 1161Clean-up 105Medical costs 15Lost income 166Evacuation costs 22Total 2670
Economic costs of January 2009 <strong>Nadi</strong> floodsProfile of an average survey householdThe average householder interviewed in the survey came from <strong>Nadi</strong>, but members had only aone-in-two chance of being aware of the risk of flooding there. The household was flooded thisyear and incurred financial losses as a result. Once aware of the flood danger, the householdmore than likely lifted possessions to higher ground and, although this did not always havethe desired effect (because flood levels were frequently higher than anticipated), it did mitigatethe damage. For the damage that was sustained, the household most likely had no insuranceand would have to rely on charity, family and/or personal savings to replace items. For thesereasons, it expected to never replace the items. Half the time, the rising waters forced thehousehold to evacuate.Intangible lossesNumerous household losses could not be expressed in monetary terms. These includedtrauma as well as the loss of irreplaceable items.Given the scale of flooding in <strong>Nadi</strong> (one of the worst on record in Fiji) and the number of deaths,the resulting level of trauma was high. Some interviewees lost family members to drowning,while others were disabled as a result of the injuries they sustained. One respondent stated:My family is in a big loss. We lost a member of our family and it was really traumatic. The watercame in quickly … My brother in law could have been saved if the police team have resourcesto go and rescue him when he was climbing on the tree and the police team responded tothe Indian family that called about him on the tree …Following flood abatement, the grief experienced by many families decreased; for others,it merely changed into the trauma of destitution and starvation. The loss of homes and/orpossessions meant many families did not receive help either at all or for a long time (althoughthe government and nongovernment organisations provided humanitarian assistance to somefamilies). Consequently, some respondents stated that their situation, six weeks after the floods,had not been assessed by any agency and that they were on the breadline. Some desperatefamilies resorted to taking rotting food from the waste sites around <strong>Nadi</strong>. Parks and landfill areasaround <strong>Nadi</strong> became the dumping ground for decomposing food stuff that supermarketsdiscarded after extensive power outages following the floods. Out of desperation, many familiesused this food, regardless of the threat of food poisoning. One respondent stated:People were scavenging for food. Supermarket owners had dumped them at Prince CharlesPark after the flooding … It was shocking to see what poverty makes people do. The peoplewere squatters and were collecting whatever they could get.For those households that received some help or were trying to recover following the floods,their recovery might have been slowed by alleged looting or price fixing. Several householdsstated that looting occurred following the floods, such that people stole from the belongingsthey had left. (There was a call for increased policing of the area following the floods.) Onerespondent stated:23SOPAC Technical Report 426
Economic costs of January 2009 <strong>Nadi</strong> floodsOur house was under water for 13 days … It wasn’t until the blockage at the main road clearedthat water was able to flow freely. The water inside my house was about 6 feet and 8 feetoutside. I am a diabetic patient but I have to stay and clean, making my toe more infected andswollen. People stole clothes and livestock from me.Additionally, some families alleged that some shopkeepers, with the town closed after the floods, ‘increasedtheir prices and made a profit’.In addition to trauma, family families lost irreplaceable items, including items of sentimental value such asphotos, masi and wedding tapes. One respondent stated:I feel sorry for the neighbour who lost everything and even her daughter’s wedding materials. The weddinghas been cancelled …Additionally, financial and educational records were lost (table 9). The loss of educational certificates wassometimes raised with concern about how the loss of this information may affect employment prospects.While educational records and some administrative records may ultimately be replaced at a cost (assuminggovernment copies of these records exist), items of sentimental value will never be replaced.Table 9: Irreplaceable items lost by <strong>Nadi</strong> householdsPersonal recordsPersonal financial recordsEducational administrationItems of sentimental valueHeritage/heirloomsBirth certificates, marriage certificates, passports,identity cards, health cardsLand titles, lease documents, bank cards,insurance policies, FNPF cards, microfinancenote booksSchool reports, exam results, school certificates,work certificates, references, CVsPhotos, family journals, wedding attire, weddingtapes/DVDsMasi and mats for/from weddings, items fromfamily historySOPAC Technical Report 42624
D.Economic costs of January 2009 <strong>Nadi</strong> floodsBUSINESS SAMPLEIMPACTSResponses from 230 businesses across <strong>Nadi</strong> were analysed. Total losses reported by thebusinesses interviewed were around F$32 million gross (table 10). Reported loss per businessvaried extensively, from nil to over F$2 million worth of losses.Table 10: <strong>Nadi</strong> sample business loss, by loss sizeLoss per business(F$)NumbersampledShare ofsample(%)Totalsample loss(F$’000)Share of totalsample loss(%)0 85 37 0 01 – 10 000 39 17 177 110 001 – 50 000 34 15 835 350 001 – 100 000 23 10 1 649 5100 000 – 1 million 39 17 12 739 401 million + 10 4 16 719 52Total 230 100 32 119 100Over half (54 per cent) of businesses reported losses of F$10 000 or less (table 9), accountingfor only 1 per cent of total sample business losses. The greatest proportion of losses (52 percent), however, was attributable to a small proportion (4 per cent) of businesses that eachsustained losses of over F$1 million.Given the wide variety of businesses covered and losses reported, losses for the <strong>Nadi</strong> areawere grouped according to the broad type of business:• retail (including market vendors, travelling vendors and fuel outlets such as petrolbowsers)• eateries (restaurants, milk bars, takeaways etc.)• wholesalers and manufacturers (including exporters)• services (including transport such as freight and buses, accommodation and two ‘nondefined’businesses).Tables 10–14 summarise the business losses across these business types. The range of losseseven within these groups still varied extensively. A cut-off of no less than five observations persubgroup was used to maintain data accuracy.25SOPAC Technical Report 426
Economic costs of January 2009 <strong>Nadi</strong> floodsRetail business lossesRetail businesses include shops, market sellers, fuel outlets (garages and bowsers) and mobilevendors. Given the wide variety of retail outlets covered in the sample, the range of losses by<strong>Nadi</strong> retail businesses was large.A small proportion of businesses reported no losses because the floods did not reach theirbusiness. Others, however, reported losses in the millions. Over half the businesses interviewedreported losses of F$1–10 000, although they accounted for only 1 per cent of total retail losses.By comparison, 6 per cent of businesses each sustained losses of over F$500 000. These fewbusinesses accounted for two thirds of the total losses to the retail sector. Total losses reportedby the retail businesses sampled were around F$17.7 million (table 11).Table 11: <strong>Nadi</strong> sample retail* losses, by loss sizeNilF$1–10 000F$10 000–50 000F$50 000–500 000F$500 000+TotalShare of retail sample (%) 6 52 19 17 6 100Total losses (F$000) 0 118 397 5 120 12 049 17 684Share of total losses (%) 0 1 2 29 68 100Lost business (F$000) 0 68 136 2202 5 430 7837Lost business share oftotal losses (%)58 34 43 45 44* Includes petrol outlets.Interruption to business constituted a significant proportion of retail losses. Many businesseswere unable to operate during or after the floods because staff or customers were unableto reach the premises, because assets were damaged or because power or water outagesoccurred. Interruption to normal business accounted for 44 per cent of losses to the retailsector.Eatery lossesEateries include milk bars, restaurants, cafés and takeaways. Losses reported by eateriesranged from F$1500 to F$185 000, with the majority of eateries reporting losses of F$50 000 toF$100 000. This large number of businesses accounted for 95 per cent of total eatery losses.Total losses were around F$0.8 million (table 12).Table 12: <strong>Nadi</strong> sample eatery losses, by loss sizeSOPAC Technical Report 42626F$0–50 000 F$50 000+ TotalShare of eateries sample (%) 38 62 100Total losses (F$000) 40 786 825Share of total losses (%) 5 95 100Lost business (F$000) 25 180 205Lost business share of total losses (%) 62 23 25
Economic costs of January 2009 <strong>Nadi</strong> floodsAs with retail businesses, interruption to business constituted a significant proportion of lossesto eateries. It accounted for 25 per cent of losses to the eateries sector overall, affecting smalleroperators particularly badly (accounting for 62 per cent of their losses).Wholesaler/manufacturer/exporterlossesThis business category included large scale production (manufacturing and wholesale) as wellas export. Only a small number of these businesses could be interviewed during the surveyperiod, so losses are reported for the entire sample. None of these businesses interviewedreported zero losses from the floods: losses ranged from F$5000 to F$640 000, with mostinterviewees reporting losses of over F$100 000. Interruptions to business (from inability toreach clients or premises, or from damage to amenities and/or assets) accounted for 42 percent of the sector’s losses. Total losses reported by the wholesaler/manufacturer/exportersample were around F$1.8 million (table 13).Table 13: <strong>Nadi</strong> sample wholesaler/manufacturer/exporter lossesTotalTotal losses (F$000) 1805Share of total losses (%) 100Lost business (F$000) 761Lost business as share of total losses (%) 42Service sector lossesThe service sector includes legal and consultancy businesses, cleaning businesses, transport(taxis, buses, freight) and accommodation. In addition, the category includes two non-definedbusinesses. Losses reported by the service industry varied from nil to over F$2 million. Themajority of service businesses (46 per cent) sustained losses of up to F$50 000, and theircombined loss accounted for 4 per cent of the service sector damage. By comparison, 7 percent of service businesses sustained individual losses of over F$1 million, and their combinedloss accounted for over one third of the sector’s total losses. Total losses reported by theservice businesses were around F$12 million (table 14).Interruption to business was a significant issue for smaller operators; almost half the lossessuffered by the smaller service sector operators arose because they could not operate properlyduring the flood. Proportionally, this was less of a problem for large service providers.27SOPAC Technical Report 426
Economic costs of January 2009 <strong>Nadi</strong> floodsTable 14: <strong>Nadi</strong> sample service sector lossesNumber of businesssampledNilF$0–50 000F$50 000–100 000F$100 000–1 millionF$1million+Total6 26 6 14 4 56Share of service sample 11 46 11 25 7 100(%)Total losses (F$000) 0 452 380 6 685 4 287 11 804Share of total losses (%) 0 4 3 57 36 100Lost business (F$000) 0 206 63 1 097 74 1 440Lost business as shareof total losses (%)46 17 16 2 12Total business losses, by sampleTotal business losses sustained by the sample were around F$32 million gross, with the retailand manufacturer/exporter sectors accounting for 86 per cent of losses (table 15).Table 15: Total <strong>Nadi</strong> sample business lossesNumbersampledTotal samplelosses(F$’000)*Lostbusiness(F$’000)Lost businessas share oftotal losses(%)Retail (inc. petrol) 155 17684 7837 44Eateries 13 825 205 25Exporters, manufacturers,wholesalers6 1805 761 42Services 56 11804 1440 12Total 230 32 119* 10 243 32* Figures may vary due to rounding.The greatest source of loss was the destruction of business assets (products for sale, equipmentetc.). Another significant source of loss was businesses’ inability to operate normally during theflood period (because staff or customers were unable to access premises, because water andpower outages occurred etc.) (figure 4, table 16).SOPAC Technical Report 42628
Economic costs of January 2009 <strong>Nadi</strong> floodsFigure 4: Total <strong>Nadi</strong> sample business losses, by cost category*2%12%32%37%16%Total losses, by categoryStructural damageLost assetsClean-up costsDisrupted businessOther* Figure may not add to 100 due to rounding.Table 16: Total <strong>Nadi</strong> sample business losses, by cost categoryTotal sample losses(F$’000)Share of total samplelosses (%)Structural damage 5 175 16Lost assets 11 994 37Clean-up costs 4 001 12Disrupted business 10 242 32Evacuation costs 25 0Relocation/storage 147 0Extra salaries 301 1Other 232 1Total 32 119 100** Figure equals 100 with rounding.29SOPAC Technical Report 426
Economic costs of January 2009 <strong>Nadi</strong> floodsProfile of an average business operatorDespite originating from <strong>Nadi</strong>, the average business operator in the survey had only a one-intwochance of being aware of the risk of flooding there. The business was flooded this yearand incurred financial losses as a result.Once aware of the flood danger, the average business operator did not commonly preparefor flooding by moving items to higher ground. Even when they did act to protect possessions,this had a positive impact only one third of the time. Moving assets to higher ground mostlyhad no positive effect because the flood levels were higher than anticipated. Stall holders wereparticularly hard hit. The main marketplace in <strong>Nadi</strong> was up to 3 metres deep in flood water,such that not one stall holder interviewed benefited from having lifted their property to higherground—the goods were inundated regardless.For damage that was sustained, the business most likely had no insurance and would have torely on personal savings to replace items. Some businesses were faced with having to restarttheir businesses from nothing.Intangible lossesNumerous losses could not be expressed in monetary terms. These included the loss ofbusiness permits, records of goods, staff records, financial records and church records. Theloss of formal records is likely to affect the recovery of businesses, especially where clientcontacts and/or payment records are lost (because it will take time to re-establish the clientbase and/or recoup debts).SOPAC Technical Report 42630
E.Economic costs of January 2009 <strong>Nadi</strong> floodsTOTAL SAMPLE IMPACTSGross total losses for the survey sample of <strong>Nadi</strong> households and businesses were aroundF$35 million, of which businesses accounted for over 90 per cent (table 17).Table 17: Total <strong>Nadi</strong> community losses, by sampleF$000 Share (%)Household 2 670 8Business 32 119 92Total 34 789 100In addition to monetary losses and lost items that could be replaced, extensive trauma arosefrom the flood. Further, there were extensive losses of irreplaceable items or items that haveimportant but intangible benefits, including business and personal records and items ofsentimental and cultural value (see table 9).Interpretation of sample lossesLoss estimates are provisional because the data are imperfect:• Some respondents might have overstated their losses in the hope that the survey wouldaffect compensation payments. In these cases, losses would be overestimated.• Some respondents who stated they incurred losses were unable to estimate, even broadly,the scale of their losses. In other cases, businesses were not prepared to divulge losses.These cases would underreport losses.Ultimately, analysis was based on cleaned data (including data where unreliable or potentiallyinflated answers were removed) and estimates were based only on values recorded. Estimatesare thus likely to be an underestimate, especially given that the analysis did not include lossesto Denarau Island hotels (see below).Hotels on Denarau IslandDenarau Island is a reclaimed area of land located 3 kilometres to the west of <strong>Nadi</strong> town. Theisland hosts international hotel resorts as well as shopping complexes, tourist activities andhousing developments. Denarau Island was not flooded by river rise during the January 2009floods, but some businesses were affected by high tides, leading to salt water flooding ofpremises and associated problems (damaged carpets, blocked pipes etc.). Further, a numberof hotels suffered financially from the flood related tourist cancellations and from the islandbeing cut off as a result of flooded roads.31SOPAC Technical Report 426
Economic costs of January 2009 <strong>Nadi</strong> floodsThe business survey covered losses to businesses operating on Denarau Island, (see lossestimates reported in tables 12–16). However, the estimates ultimately did not include losses tothe Denarau hotels because those businesses presented as outliers that could skew damageestimates. (Generally, the island targets higher income tourists, with most hotels being five starquality.) Nevertheless, general observations can be made:• All hotels experienced cancellations of tourist visits. Some hotels even advised theirclients to reconsider their booking in light of the floods. One set of four hotels estimatedhaving lost a combined value of F$3 million from just the cancellation of two internationalconferences.• Most hotels lost furniture, fittings and/or appliances (ovens, computers, televisions,refrigerators) due to coastal flooding. One experienced damage to railings and concretesteps as well.• Some hotels had to make extra salary payments to staff to cover the clean-up andovertime.• Several hotels experienced disruption to business because tourists and/or staff wereunable to reach the premises along flooded roads.• Some hotels continued to lose earnings following the floods because they ran discountedaccommodation rates to re-attract overseas and local tourists.SOPAC Technical Report 42632
F.Economic costs of January 2009 <strong>Nadi</strong> floodsESTIMATED LOSSESFROM THE 2009 FLOODInformation on losses sustained during the 2009 floods was extrapolated to estimate totalhousehold and business losses for the survey area (figure 1). Sample values were notextrapolated for the entire greater <strong>Nadi</strong> area because:• it was not possible to sample all census areas in greater <strong>Nadi</strong>. Survey scope was limitedby time (being necessary to provide the government with feedback on losses as soon aswas practical) and resources (money and access to staff time). Extrapolation of losses toareas outside the survey area could generate unreliable results.• more importantly, most survey areas were specially targeted because they were flooded,and the intention was to obtain an impression of flood impacts. Because flooding did notoccur evenly across the greater <strong>Nadi</strong> area, extrapolation of sample results to greater <strong>Nadi</strong>would most likely overstate losses.Estimates of losses sustained across the survey are to be treated with caution, given thevarying data quality:• Some respondents might have overstated the value of losses in the hope that they wouldreceive compensation. This could lead to an overestimate.• Some respondents were unable to estimate the value of their losses at all. This could leadto an underestimate.The estimates supplied indicate only the magnitude of the community losses; they should notbe used to determine compensation. They should, however, provide planners with sufficientdata to assess likely development needs for future flood mitigation.Total losses over the survey areaIf the sample of households interviewed was representative of households across the surveyarea, then gross household losses across the survey area could be expected to be aroundF$14.5 million, of which almost F$13 million arose from structural damage and the loss ofpersonal possessions (table 18).If the sample of businesses interviewed was representative of businesses across the surveyarea, then gross business losses across the survey area could be expected to be aroundF$229 million (tables 19 and 20).33SOPAC Technical Report 426
Economic costs of January 2009 <strong>Nadi</strong> floodsBy comparison, the gross domestic product (GDP) for Fiji in 2007 was reported to be F$4447.3million (Fiji Islands Bureau of Statistics 2006). Estimated losses in the survey area alone, therefore,represent around 5 per cent of the GDP, which is a significant loss of wealth to Fiji. The loss tothe business community is a particular concern because businesses form an important partof Fiji’s tax base.Other lossesAside from monetary losses and items that could be replaced, extensive trauma arose fromthe flood. Additionally, there were extensive losses of irreplaceable items or items that haveimportant but intangible benefits. As noted earlier, intangibles lost included business andpersonal records as well as items of sentimental and or cultural value (see table 9).In the survey, businesses frequently mentioned they had lost formal records. This is likely toaffect business recovery (especially where client contacts or payment records are lost, becauseit will take time to re-establish the client base and/or recoup debts). For families, the loss ofeducational certificates used to secure employment was also frequently noted, along withoccasional concern about how the loss of this information may affect employment prospects.Most commonly, families lamented the loss of items that held sentimental value, such asphotos, masi and wedding tapes. These items can never be replaced, while educationalrecords and some administrative records may ultimately be replaced at a cost (assuminggovernment copies of these records exist).Interpretation of the estimatesTotal monetary losses to the <strong>Nadi</strong> community of the January floods were estimated to bearound F$244 million gross (table 21). Despite this value being based on sample responsesthat could contain some exaggerated losses, estimated losses are likely to underestimate totallosses, for the following reasons:• The survey results ultimately did not include the Denarau Island hotels, and thesebusinesses are likely to represent a substantial loss to the <strong>Nadi</strong> business community.• Many stakeholders were unable (or unwilling) to divulge the extent of some losses, and nilvalues were assigned in these cases.• Medical costs to families were understated because many medical costs were free duringthe emergency.• No values have been assigned to the loss of irreplaceable items such as business records,or to the trauma experienced by families.• Estimates of household and business losses were extrapolated within the survey areaonly. Areas of <strong>Nadi</strong> outside this area were also flooded and sustained losses. Becausethe survey area was more heavily damaged, however, average losses from the surveyarea could not be extrapolated to the greater <strong>Nadi</strong> area (because this would exaggeratelosses).Despite these limitations, the figures indicate the magnitude of private losses in <strong>Nadi</strong>.35SOPAC Technical Report 426
G.Economic costs of January 2009 <strong>Nadi</strong> floodsPOLICY ISSUESCommunity perceptions andexpectationsSeveral businesses and community members suggested the cause of the flood and/or how itshould be addressed. The most common perceived cause of the floods was poor drainage inthe <strong>Nadi</strong> area, which relates to many residents blaming the floods on the fact that no dredginghad been undertaken recently (table 22). Additionally, some residents considered that poorplanning controls had enabled some inappropriate developments to occur in the <strong>Nadi</strong> area,affecting the ability of the environment to safely channel water to the sea.Given the perceived causes of the flooding, much of the community considered numerousresponses should be undertaken, including improving the draining/culvert system anddredging or widening the <strong>Nadi</strong> River (table 22).SOPAC Technical Report 42636Table 22: Perceived flood causes / needed responsesPerceived cause/ needed responseNumber ofrespondents raisingissueNeed to address poor drainage system/ improve culverts 46Need to dredge/widen river 15Need to improve disaster warnings 5Need to improve infrastructure (build higher bridges, upgrade4roads to reduce flooding, build retaining walls etc.)Need to extend the <strong>Nadi</strong> Bridge 3Need to improve development processes/planning* 3New Qeleloa bridge** 3Need to relocate town (<strong>Nadi</strong>) 2Need to improve flood management system 1* Perception that housing schemes in villages or housing developments generally do not consider flood risk whenlocation is decided.** Perception from some residents that this was inappropriately designed/located and impedes the natural flow ofwater.
Economic costs of January 2009 <strong>Nadi</strong> floodsIn addition to flood management generally, community members made requests orrecommendations that they considered would speed recovery the floods. Aside from requestsfor financial assistance from the government, the most common requests related to improvingthe litter and waste situation around <strong>Nadi</strong>. This was perceived by Some residents perceivedthat the waste was contributing to dengue outbreaks following the flood. The following wereother suggestions:• Improve the immediate response:—Identify all evacuation centres in <strong>Nadi</strong> and communicate that information to thecommunity.—Improve evacuation procedures.—Provide wider immediate assessment and help to families/businesses (including croprehabilitation).—Continue food rations for at least three months.—Increase communications and transparency across representatives of the Red Cross,DISMAC, nongovernment organisations etc. to ensure more widespread assistanceand fewer gaps in assistance.—Provide assistance to clean up houses, businesses and farms.• Improve response planning over the medium term:—Upgrade the weather station in <strong>Nadi</strong> to improve flood warnings.—Improve warning dissemination.—Build more community halls in case needed for an emergency evacuation centre.—Keep water supply always ready in case of emergency.—Locate DISMAC and Red Cross teams in different places so they can be contacted byaffected areas.—Introduce a crop insurance scheme for households and businesses.• Improve recovery:—Hire private contractors to help clean up following a flood.—Spray blocked drains to control mosquitoes during floods.—Landlords give a grace period for rent payment because not much profit is gained.—Conduct dialogue with the consumer council to lower food prices to meet needs.—Make <strong>Nadi</strong> a tax free zone for at least five years. Cut the rate over the years.—Improve access to insurance, by either the government establishing its own insuranceor it forcing insurance agencies to agree to insure operators in <strong>Nadi</strong>.—Improve security following floods to minimise looting.—Improve access to funds through loans.• Reduce risk:—Assess flood risks (that is, calculate the risk of flooding, assess the causes of changesto river flow etc.).—Ensure development plans incorporate disaster risk.—Improve the regulation of dams.—Improve dredging and drainage.37SOPAC Technical Report 426
Economic costs of January 2009 <strong>Nadi</strong> floodsTable 26: Household membership of Christian groupsShare of householdssampled (%)MethodistAssemblyof GodCatholicChristianMissionFellowshipOther8 3 1 1 3Table 27: Household membership of other religionsSanatan <strong>Nadi</strong> Muslim League OtherShare of households sampled (%) 4 2 0Table 28: Household membership of community groupsRugbyteamYouthgroupRedCrossChamber ofCommerceShare of households sampled (%) 1 1 1 1Business operators also stated that they were actively involved in a number of religious groups(tables 29 and 30), with Sanatans by far the most frequently mentioned (reflecting the largeproportion of the <strong>Nadi</strong> business community that is IndoFijian). They were also actively involvedin a number of community groups, such as the Chamber of Commerce and the Rotary Club(table 31). Targeting awareness activity through these religious and community organisationsmay be useful for raising awareness in the <strong>Nadi</strong> business community.Table 29: Business membership of Christian groupsShare ofbusinessessampled (%)BethanyMethodistMethodistCatholicLatterDaySaintsChristianMissionFellowshipOther1 1 1 1 1 2Table 30: Business membership of other religionsSanatanUnspecifiedchurch/templeFijiMuslimLeagueSangamShare of businesses sampled (%) 11 3 5 2SOPAC Technical Report 42640Table 31: Business membership of community groupsChamber ofCommerceYouthgroupRotaryClubShare of businesses sampled (%) 2 1 1 4Other
Economic costs of January 2009 <strong>Nadi</strong> floodsTo disseminate warnings or alerts in the future, the use of the mobile phone is likely to becritical. Eight and nine out of 10 households and businesses respectively had access to atleast one mobile phone. By comparison, only one third of households and just over half ofbusinesses had access to landlines (table 32). Some businesses also noted that landlines wereunavailable to them when the business was closed, so this form of communication would havelimited value in passing on warnings. The majority of households also had access to radios toreceive messages, although this medium held value only during the day when the radio wason. Just over half the businesses (54 per cent) also had access to the radio to hear warnings.Table 32: Access to phones and radiosLandlinesMobilephonesRadiosShare of households (%) 38 93 81Share of businesses (%) 56 86 54Given the widespread use of mobile phones by the business and household community (table32), the majority of households and businesses stated that the mobile phone is the best optionfor contacting them in an emergency (table 33), especially at night when businesses are closedand business operators are away from the landline (table 34).Table 33: Best means of emergency contact (day time)MobilephoneLandlineBoth mobilephone andlandlineOtherTotalShare of households (%) 69 24 2 5* 100Share of businesses (%) 60 36 3 1** 100* Shouting, personal contact, neighbours/neighbour’s phone, village Head Man, government officers, Turaga ni Koro,police, local priest etc.** Personal contact, radio.Table 34: Best means of emergency contact (night time)MobilephoneLandlineBoth mobilephone andland lineOther *TotalShare of households (%) 73 21 2 4* 100Share of businesses (%) 82 14 2 1** 100**** Shouting, personal contact, neighbours/neighbour’s phone, village Head Man, government officers, Turaga ni Koro,police, local priest etc.** Personal contact, radio.*** May not add to 100 due to rounding.There may be value in the Government of Fiji meeting with mobile phone companies to sharealerts and warnings through these media, as well as through more conventional media (suchas the radio). This approach would also have advantages for:• night time warnings when media such as the radio are switched off• warning during power cuts.41SOPAC Technical Report 426
Economic costs of January 2009 <strong>Nadi</strong> floodsInsuranceInsurance coverage of <strong>Nadi</strong> households and businesses is very low. Only 1 per cent ofhouseholds reported having any insurance to recover from flood losses, while 88 per centof business operators reported having no insurance (table 35). Of this latter group, not onemarket vendor had any insurance, yet immediate damage to market vendors was frequentlythousands of dollars. (Damage to market stalls and produce was reported in the range of nil toF$20 000. 3 ) Some business operators stated that insurance was not an option because privateinsurers would not cover businesses for floods around <strong>Nadi</strong>. Of those that did report havingsome insurance, over half were located on Denarau Island, targeting the high end of the touristmarket.Table 35: Insurance coverageNumber ofobservationsNumber with someinsurance coverageShare with someinsurance (%)Households 717 7 1Businesses 230 27 12Households and businesses that had no insurance would have to absorb all losses. Whenasked how they would recover from the floods, many considered their losses were so severethat they might never recover, and many would have to start again. Others stated they wouldrely on assistance from families, the government and/or their savings. In February 2009, theGovernment of Fiji’s (2009) final flood assessment report noted the government’s intent to reviewthe insurance industry to better support developments in the country. This review is likely to becritical for speeding recovery in the future.Benefits from the floodA small proportion of businesses reported a business benefit from the flood, having receivedcustomers diverted from elsewhere or experienced increased demand for repair services. Dataon the increased income for these businesses were limited, however, so it was not possible toestimate the increase in incomes generally.SOPAC Technical Report 426423One stall holder reportedly lost up to F$65 000. This total loss included damage to machinery and pipes, so thisinterviewee was counted with businesses instead.
Economic costs of January 2009 <strong>Nadi</strong> floodsREFERENCESFiji Island Bureau of Statistics 2006, Fiji national accounts—summary table, www.statsfiji.gov.fj/Economic/gdp_summary.htm (accessed 20 April 2009).Government of Fiji 2009, Consolidated report on flash floods 8–16 January 2009, damagessustained and necessary responses, rehabilitation and reconstruction, Office of the PrimeMinister, Suva, Fiji.Holland, P 2008, An economic analysis of flood warning in Navua, EU-SOPAC Project Report122, Suva, Fiji.OCHA 2009, Fiji floods, OCHA Situational Report no. 1, Suva, Fiji.Woodruff, A 2008, Economic analysis of flood management in the lower Vaisigano catchmentarea, EU EDF – SOPAC Project Report 69g, Suva, Fiji.43SOPAC Technical Report 426
ANNEX 1Economic costs of January 2009 <strong>Nadi</strong> floodsTERMS OF REFERENCESUPPORT TO FIJI FOR POST-FLOODING TECHNICALASSESSMENTS, JANUARY 2009PHASE 2—SOCIOECONOMIC ASSESSMENTObjective:Conduct an economic assessment of flooding to households and private businesses (plus aneconomic valuation of damage to infrastructure, where possible).Outcomes:Improved advocacy for flood mitigation and warning, improved decision making and investmentanalysis for flood management and mitigation. The output will be a technical report with plainEnglish summary/policy brief.Activities:Previous economic assessments of the economic costs of flooding (Holland 2008, Woodruff2008) indicate that the potential monetary costs include losses to households, businesses(local and international) and government (offices, material, infrastructure), as well as the costof humanitarian assistance. Non-monetary costs include interruption to schooling, the loss ofirreplaceable items (including records) and trauma. In <strong>Nadi</strong>, tourism is a focal aspect of theeconomy, and the impact of flooding on the hotel industry and services that support and relyon it (tours, shops, airlines) will also be critical.SOPAC Technical Report 42644Data to assess the economic cost of the floods will be sourced from government records,consultation with agencies, media and sample surveys. SOPAC assistance in economicassessment will focus on the last three items. The single largest activity will be sample surveysof:• international tourist operations (hotels, tours, international and domestic flights)—thesebusinesses will be assessed rapidly through a random sample survey, stratified by businesstype if possible (as yet unclear)• local businesses (shops and stalls)—these local businesses will be assessed using arandom sample initially but stratified after the fact if necessary
Economic costs of January 2009 <strong>Nadi</strong> floods• households—these will be sampled using random sampling on the basis of censusenumeration districts. Information on the enumeration districts for towns and greater areaswould need to be accessed from the Department of Statistics.Government of Fiji counterpart support:••Information on the enumeration districts in the area as the basis for household surveysGovernment data on the number, size category and type of businesses operating in theaffected <strong>Nadi</strong> area (necessary for stratifying samples)• Enumerators (people to conduct interviews with businesses and householders in bothFijian and Hindustani. Must also be fluent in English and literate.)SOPAC support:••••Funding (possible co-funding with other partners)Facilitation/coordination of surveysTraining for enumeratorsSupport for processing of survey results and report developmentPotential partners•• Fiji Red Cross•United Nations Development Programme (UNDP) – <strong>Pacific</strong> CentreNon-government organisations / community service organisations<strong>Nadi</strong> scheduleActivity Date DurationPreparation (questionnaires drafting, media 2–8 February One weekreleases, preparatory reading, planning)<strong>Nadi</strong>Briefing to <strong>Nadi</strong> stakeholders 12 February One day<strong>Nadi</strong> survey training and <strong>Nadi</strong> survey 16–24 February 1.5 weeksData entry and analysis of <strong>Nadi</strong> economiclosses23 February – 20 March Four weeksReporting of preliminary findings on <strong>Nadi</strong>economic lossesDrafting of report, policy briefsMarch/AprilOne dayAs time permits45SOPAC Technical Report 426
ANNEX 2Economic costs of January 2009 <strong>Nadi</strong> floodsQUESTIONNAIRESFIJI FLOOD HOUSEHOLD SURVEYFOR HOUSEHOLDSQuestionnaire # (data entry, e.g. hh1, hh2 etc.)DateInterviewer’s nameSurvey district:..................................................................................................................................................................................APERSONAL BACKGROUNDThe purpose in this section is to get an understanding of the number of people affected byfloods, how frequently they experience flooding in the area and how they came to rely on <strong>Nadi</strong>/Ba to begin with.A1A2Name of interviewee............................................................................................................................................................................................................Position in the household (head of household etc.).............................................................................................................A3 Male or female person being interviewed? (circle) Male FemaleA4A5Street address...............................................................................................................................................................................................................................How many people normally live in this house?SOPAC Technical Report 42646Person 1Person 2Person 3Person 4Person 5Person 6Person 7Person 8Person 9Person 10AgeHighest education level
Economic costs of January 2009 <strong>Nadi</strong> floodsA6 When did you come to <strong>Nadi</strong>/Ba to live? (circle/complete)(i) Always lived here(ii) Moved here from (town, island).................................................................................................in (year)...........................................A7If you came here to live from elsewhere, why did you move here to begin with?.............................................................................................................................................................................................................................................................................A8Do you rely on the river for any particular purposes? (circle)Fishing IrrigationTransport of produce by boatTransport of self by boat Disposal of water/sewerage RecreationOther (specify)................................................................................................................................................................................................................................A9Do you own a business here in <strong>Nadi</strong>/Ba? If YES, would you also participate in abusiness survey after this interview too?.................................................................................................................................................If YES, interviewer please attach business questionnaire to this householdquestionnaire.BFLOOD WARNINGSThe purpose in this section is to get an understanding of whether or not a short term warningsystem (1–3 hours) would make any difference to people in reducing losses in the future. Thiswill determine whether or not a warning system could be developed or not. It also gives usinformation on how people find out about and cope with floods so that we could work out howto reach them using an early warning system.B1B2B3Were you aware of the risk of flooding in this area before the floods hit this year?(circle) Y NHow many floods have you experienced here before?...................................................................................................Before January this year, when did you last suffer from flooding here?.....................................................................................................................................................................................................................................................................................................................................................................................................................................................................................................................................................................................................B4When the 2009 flood happened, how did you first find out about it? (circle)(i) Water entering the building (ii) Radio (iii) Television(iv) Phone call from friend/colleague (v) Text message (vi) Saw heavy rain(vii) Saw river rise(viii) Contacted in person by friends/neighbours(ix) Other (specify) .................................................................................................................................................................................................................... .............................................................................................................................................................................................................................................................................47SOPAC Technical Report 426
Economic costs of January 2009 <strong>Nadi</strong> floodsB5Did you get flooded this year? If NO, go to section C. If YES, how much warning didyou get before water came in?..........................................................................................................................................................................................................................................................................................................................................................................................................................................................................................................................................................B6Did you take any other measures to protect your property (lift/move possessionsetc.)? Y NIf YES, what did you do?.........................................................................................................................................................................................................................................................................................................................................................................................................................................................................................................................................................B7What effect did it have (how did it help)?.......................................................................................................................................................................................................................................................................................................................................................................................................................................................................................................................................................................................................................................................................................................................................................................................................................................CWATER QUALITYThe purpose in this section is to understand the scale of flooding and its impact on waterquality. This information can be used to predict future flood impacts in the future.C1What changes in the river did you notice during the flood (if any)?Increase in unpleasant smellsBad taste in tap waterIncreased murkinessOther (specify)...............................................................................................................................................................................................................................................................................................................................................................................................................................................................................................................................................................................................................................................................................C2How many days after the flood was it before those changes went away?.......................................................................................................................................................................................................................................................................................................................................................................................................................................................................................................................................................................................................................................................................................................................................................................................................................................SOPAC Technical Report 42648
Economic costs of January 2009 <strong>Nadi</strong> floodsDPERSONAL LOSSESThe purpose in this section is to get an understanding of how much householders lost as aresult of the flood.D1Did the people from your household lose any personal possessions, suffer physicallyor get disadvantaged personally in any other way as a result of this flood?YNIf NO, go section E.D2If YES, what were the types of item lost? (SHOW DISPLAY CARD TO INTERVIEWEE.Circle all that apply.)Electrical appliances (TV, radio, telephone, refrigerator etc.) Livestock/animalsFurniturePurchased food itemsTransport (car, tractor, etc.)Cash crops that you are producingSubsistence cropsStructural damage to houseOther (broadly)......................................................................................................................................................................................................................................................................................................................................................................................................................................................................................................................................................................................................................................................................................................................................................................................D2aIf YES, what was the total value of structural damage to the house?$........................................................................................................................................................................................................................................................................D3What would you say was the approximate total value of the personal possessionsyour household lost (value of item or cost of replacement or repair)? SHOW DISPLAYCARD TO INTERVIEWEE........................................................................................................................................................................................................................................................................................................................................................................................................................................................................................................................................................................................................................................................................................................................................................................................................................................D4How did/will you replace the lost items?(i) Won’t replace (ii) Insurance (iii) Private savings(iv) Extended family (v) Charity donations (vi) Government assistance(vii) Other (specify).............................................................................................................................................................................................................................................................................................................................................................................................................................................................................................................................................................................................................................................................................................................................................................................49SOPAC Technical Report 426
Economic costs of January 2009 <strong>Nadi</strong> floodsD11Up till now, have you or other members of your household suffered any sickness lateron because of the effects of the flood (e.g., cuts and infections from slipping in floods,diarrhea, severe diarrhea, dysentery, respiratory infection, measles, malaria, dengue,high fever etc.)? Y NIf NO, go to question D15.D12If YES, please provide details (what sicknesses? how many persons affected?):..........................................................................................................................................................................................................................................................................................................................................................................................................................................................................................................................................................D13Did you have to pay for any medical treatment? If NO, why (free service for emergency,other)?.........................................................................................................................................................................................................................................................................................................................................................................................................................................................................................................................................................If NO, go to question D15..D14If YES, how much roughly did it cost to treat these subsequent illnesses?Doctors visitsMedicine (painkillers, creams,antibiotics etc.) Dressings (purchaseof bandages etc.)Days in hospitalType of illness#1 #2 #3 #4Other (specify)D15Did your household lose any employee wages because of the flood?YNIf NO, go to question D19.D16If YES, how many members of your household were unable to work?..............................................peopleD17D18D19How many days were they unable to work?.............................................daysApproximately how much did the household lose in wages due to missed days?$........................................................................................................................................................................................................................................................................How many days did it take to clean up your house and land after the flood?.............................................days51SOPAC Technical Report 426
Economic costs of January 2009 <strong>Nadi</strong> floodsD20Did you experience disruption in basic services?If YES, what services were disrupted? (Circle all that apply.)TransportElectricityWater supplyTelephoneD21On average, how long did you have to wait for these services to resume?.............................................................................................................................................................................................................................................................................D22 Did you have to evacuate your home? Y NIf NO, go to question D28.D23If YES, how did you evacuate? (circle)(i) On foot (ii) Own vehicle (iii) Taxi(iv) Bus (v) Used family/friend’s vehicle (vi) Boat(vii) Evacuation team(viii) Other (specify)..........................................................................................................................................................................................................................................................................................................................................................................................................................................................................................................................................................D24D25For how long did you evacuate?.............................................daysWhere did you go (evacuation centre, house of family/friend etc.)?..........................................................................................................................................................................................................................................................................................................................................................................................................................................................................................................................................................D26Did evacuating your home cost you anything? If NO, go to question D28. If YES, whatdid you have to pay for?....................................................................................................................................................................................................................................................................................................................................................................................................................................................................................................................................................................................................................................................................................................................................................................................................................................................................................................................................................................................................................................................................................................................SOPAC Technical Report 42652D27D28How much did evacuating cost you?........................................................................................................................................................Did any children in the household miss any days of school as a result of the flood?If NO, go to section E. If YES, why?..........................................................................................................................................................................................................................................................................................................................................................................................................................................................................................................................................................
Economic costs of January 2009 <strong>Nadi</strong> floodsD29D30How many children missed school? ..............................................................................childrenHow many days did they miss each? ..............................................................................daysEACCESS TO COMMUNICATIONSThe purpose in this section is to get an understanding of how we might be able to advisepeople of an oncoming flood in the future.E1Does your household/business have any of the following items operating daily?ElectricityPhone land lineMobile phoneElectricity powered radioBattery powered radioTelevisionComputer with access to the internetFiji Times newspaperThe Sun newspaperDaily Post newspaperFaxTick if ‘yes’E2E3Are you an active member of a community or church group where you obtaininformation about this town? Y NIf YES, which one(s)?..........................................................................................................................................................................................................................................................................................................................................................................................................................................................................................................................................................E4How do you get information on the latest developments in town? (circle)(i) Family (ii) Friends (iii) Church (iv) Community group(v) Public notice board (vi) Newspaper (vii) Radio (viii) District Officer(ix) Other (specify)..........................................................................................................................................................................................................................................................................................................................................................................................................................................................................................................................................................53SOPAC Technical Report 426
Economic costs of January 2009 <strong>Nadi</strong> floodsE5Generally speaking, what is the best way to contact you in an emergency (phone,neighbours etc.):During the day?.............................................................................................................................................................................................................................................................................At night?.............................................................................................................................................................................................................................................................................E6How would you contact others in the event of an emergency?..........................................................................................................................................................................................................................................................................................................................................................................................................................................................................................................................................................JFINAL COMMENTSExplain that this is the end of questionnaire.Thank the respondent for their time and effort.J1Would you like to add any comments about the flooding?....................................................................................................................................................................................................................................................................................................................................................................................................................................................................................................................................................................................................................................................................................................................................................................................................................................................................................................................................................................................................................................................................................................................Explain that the results of the survey will be made available to the government around Marchto April and that these will be released to the public after verification. The results of the surveywill be produced in a report that goes to the government later in the year.If respondents would like to find out more about the survey, they should in the first instancecontact:Mosese SikivouSOPACPh. 338-1377 x.252SOPAC Technical Report 42654THANK YOU FOR HELPING US IN THIS WORK
Economic costs of January 2009 <strong>Nadi</strong> floodsFIJI FLOOD FIXED BUSINESS ANDTOURIST OPERATOR SURVEYQuestionnaire # (data entry, e.g., fb, fb2 etc.)DateInterviewer’s nameSurvey district:..................................................................................................................................................................................FBACKGROUNDThe purpose in this section is to get an understanding of the number and types of businessesaffected by floods.F1Name of interviewee.............................................................................................................................................................................................................................................................................F2Position of interviewee (owner, director, manager etc.).............................................................................................................................................................................................................................................................................F3Kind of business..........................................................................................................................................................................................................................................................................................................................................................................................................................................................................................................................................................F4Street address of business.............................................................................................................................................................................................................................................................................F5F6When was the business established?.............................................................................................................................................................................................................................................................................When did you join the business?.............................................................................................................................................................................................................................................................................F7Are you yourself from <strong>Nadi</strong>/Ba?.............................................................................................................................................................................................................................................................................55SOPAC Technical Report 426
Economic costs of January 2009 <strong>Nadi</strong> floodsBFLOOD WARNINGSThe purpose in this section is to get an understanding of whether or not a short term warningsystem (1–3 hours) would make any difference to people in reducing losses in the future. Thiswill determine whether or not a warning system could be developed or not. It also gives usinformation on how people find out about and cope with floods so that we could work out howto reach them using an early warning system.B1B2B3Were you aware of the risk of flooding in this area before the floods hit this year?(circle) Y NHow many floods have you experienced here before?...................................................................................................Before January this year, when did you last suffer from flooding here?.....................................................................................................................................................................................................................................................................................................................................................................................................................................................................................................................................................................................................B4When the 2009 flood happened, how did you first find out about it? (circle)(i) Water entering the building (ii) Radio (iii) Television(iv) Phone call from friend/colleague (v) Text message(vi) Saw heavy rain(vii) Saw river rise(viii) Contacted in person by friends/neighbours(ix) Other (specify) ...............................................................................................................................................................................................................................................................................................................................................................................................................................................................................................B5Did you get flooded this year? If NO, go to section C. If YES, how much warning didyou get before water came in?..........................................................................................................................................................................................................................................................................................................................................................................................................................................................................................................................................................B6Did you take any other measures to protect your property (lift/move possessionsetc.)? Y NIf YES, what did you do?..........................................................................................................................................................................................................................................................................................................................................................................................................................................................................................................................................................B7What effect did it have (how did it help)?SOPAC Technical Report 42656.......................................................................................................................................................................................................................................................................................................................................................................................................................................................................................................................................................................................................................................................................................................................................................................................................................................
Economic costs of January 2009 <strong>Nadi</strong> floodsCWATER QUALITYThe purpose in this section is to understand the scale of flooding and its impact on waterquality. This information can be used to predict future flood impacts in the future.C1What changes in the river did you notice during the flood (if any)?Increase in unpleasant smellsBad taste in tap waterIncreased murkinessOther (specify)...............................................................................................................................................................................................................................................................................................................................................................................................................................................................................................................................................................................................................................................................................C2How many days after the flood was it before those changes went away?.......................................................................................................................................................................................................................................................................................................................................................................................................................................................................................................................................................................................................................................................................................................................................................................................................................................GCOMMERCIAL LOSSESThe purpose in this section is to get an understanding of how much businesses lost as a resultof the flood.G1Was your business affected by the floods? If NO, go to section E. If YES, what damageoccurred generally? (circle)Business totally destroyed Assets lost Building damageBusinesses/clientele lostProduce lostOther (specify)..........................................................................................................................................................................................................................................................................................................................................................................................................................................................................................................................................................G2SHOW DISPLAY CARD TO INTERVIEWEE. If some of your business assets weredamaged or lost because of the flood, which ones were damaged or lost? (circle)Structural damage to buildingsAppliancesOffice furnitureFurnishingsAssets (store stock, perishable food, cars etc.) Administration (files, records)Other (please specify) ....................................................................................................................................................................................................................................................................................................................................................................................................................................................................................57SOPAC Technical Report 426
Economic costs of January 2009 <strong>Nadi</strong> floodsG2aWhat would say was the total value of structural damage to the buildings?$.....................................................................................................................................................................................................................................................................................................................................................................................................................................................................................................................................................G3What would you say was the total value of the business assets lost (value of item orcost of replacement or repair)? $..........................................................................................................................................................................G4 What do you estimate to have been the total clean-up cost? $.........................................................................G5Did you lose any items that are irreplaceable to your business (records etc.) If YES,which items?..........................................................................................................................................................................................................................................................................................................................................................................................................................................................................................................................................................G6If your business was disrupted because of the floods, what was the specific reason?(circle)Premises/assets floodedUnable to operate because of poor weatherWater cutsStaff unable to reach premisesPower outagesUnable to access provisions/shopsCustomers/clients/tourists unable to reach businessesOther (specify)..........................................................................................................................................................................................................................................................................................................................................................................................................................................................................................................................................................G7How many days business did you lose due to this flood disruption?..........................................................................................................................................................................................................................................................................................................................................................................................................................................................................................................................................................G8Roughly how much did your business lose due to this flood disruption?Either Estimated total $.......................................................................................................Or Average revenue lost per day $.......................................................................................................SOPAC Technical Report 42658G9 During the flood, did you have to evacuate the business premises? Y NIf NO, go to question G15.
Economic costs of January 2009 <strong>Nadi</strong> floodsG10If YES, how did you evacuate? (circle)(i) on foot (ii) own vehicle (iii) taxi(iv) bus (v) used family/friend’s vehicle(vii) evacuation team(vi) boat(viii) other (specify)..........................................................................................................................................................................................................................................................................................................................................................................................................................................................................................................................................................G11Where did you go (evacuation centre, house of family/friend etc.)?..........................................................................................................................................................................................................................................................................................................................................................................................................................................................................................................................................................G12G13For how long did you evacuate?................................................................................................daysDid evacuating your business cost anything? If YES, what did you have to pay for? (e.g.,fuel, use of vehicles etc.)....................................................................................................................................................................................................................................................................................................................................................................................................................................................................................................................................................................................................................................................................................................................................................................................................................................................................................................................................................................................................................................................................................................................G14How much did evacuating cost you?..........................................................................................................................................................................................................................................................................................................................................................................................................................................................................................................................................................G15 Did you relocate your business to somewhere else? Y NIf NO, go to question G18.G16If YES, where did you go?.......................................................................................................................................................................................................................................................................................................................................................................................................................................................................................................................................................................................................................................................................................................................................................................................................................................G17Did you have to pay for any temporary quarters, additional transportation,communications or storage expenses? Y NIf YES, how much did this cost?..........................................................................................................................................................................................................................................................................................................................................................................................................................................................................................................................................................59SOPAC Technical Report 426
Economic costs of January 2009 <strong>Nadi</strong> floodsG18Following the flood, did you have to use any paid staff to clean up premises rather thanproducing or selling for you? Y NIf NO, go to question G20.G19If YES, how much would it have cost you in salaries to get them to do this work?Either Estimated total cost ..................................................................Or No. of paid staff ..................................................................No. of days paid to clean up ..................................................................Average salary cost ..................................................................G20Were there any other business costs that you incurred because of the floods? Whatand how much?....................................................................................................................................................................................................................................................................................................................................................................................................................................................................................................................................................................................................................................................................................................................................................................................................................................................................................................................................................................................................................................................................................................................G21Did you experience disruption in basic services? If YES, what services were disrupted?(circle all that apply)TransportElectricityWater supplyTelephoneG22On average, how long did you have to wait for these services to start again?..........................................................................................................................................................................................................................................................................................................................................................................................................................................................................................................................................................G23Is your business (property and assets) currently covered by insurance? If NO, go toquestion G26.If YES (circle):None Some AllG24If only some are covered, which ones are covered?SOPAC Technical Report 42660Building Assets for sale FurnishingsOther (specify)..........................................................................................................................................................................................................................................................................................................................................................................................................................................................................................................................................................
Economic costs of January 2009 <strong>Nadi</strong> floodsG25Would you say that the insurance you have covers the full value of your losses?Why?..........................................................................................................................................................................................................................................................................................................................................................................................................................................................................................................................................................G26 Did your business increase in any way because of the floods? If NO, go to section E.If YES, say how it increased (customers diverted from elsewhere etc.)...........................................................................................................................................................................................................................................................................................................................................................................................................................................................................................................................................................G27Would you be able to say by how much your income increased?..........................................................................................................................................................................................................................................................................................................................................................................................................................................................................................................................................................EACCESS TO COMMUNICATIONSThe purpose in this section is to get an understanding of how we might be able to advisepeople of an oncoming flood in the future.E1Does your household/business have any of the following items operating daily?ElectricityPhone land lineMobile phoneElectricity powered radioBattery powered radioTelevisionComputer with access to the internetFiji Times newspaperThe Sun newspaperDaily Post newspaperFaxTick if ‘yes’E2E3Are you an active member of a community or church group where you obtaininformation about this town? Y NIf YES, which one(s)?..........................................................................................................................................................................................................................................................................................................................................................................................................................................................................................................................................................61SOPAC Technical Report 426
Economic costs of January 2009 <strong>Nadi</strong> floodsE4How do you get information on the latest developments in town? (circle)(i) Family (ii) Friends (iii) Church (iv) Community group(v) Public notice board (vi) Newspaper (vii) Radio (viii) District Officer(ix) Other (specify) .................................................................................................................................................................................................................................................................................................................................................................................................................................................................................................E5Generally speaking, what is the best way to contact you in an emergency (phone,neighbours etc.):During the day?.............................................................................................................................................................................................................................................................................At night?.............................................................................................................................................................................................................................................................................E6How would you contact others in the event of an emergency?..........................................................................................................................................................................................................................................................................................................................................................................................................................................................................................................................................................JFINAL COMMENTSExplain that this is the end of questionnaire.Thank the respondent for their time and effort.J1Would you like to add any comments about the flooding?.......................................................................................................................................................................................................................................................................................................................................................................................................................................................................................................................................................................................................................................................................................................................................................................................................................................Explain that the results of the survey will be made available to the government around Marchto April and that these will be released to the public after verification. The results of the surveywill be produced in a report that goes to the government later in the year.SOPAC Technical Report 42662If respondents would like to find out more about the survey, they should in the first instancecontact:Mosese SikivouSOPACPh. 338-1377 x.252THANK YOU FOR HELPING US IN THIS WORK
Economic costs of January 2009 <strong>Nadi</strong> floodsFIJI FLOOD MARKET/HAWKERSURVEYQuestionnaire # (data entry, e.g., m1, m2 etc.)DateInterviewer’s nameSurvey district:..................................................................................................................................................................................HBACKGROUNDThe purpose in this section is to get an understanding of the number and types of marketvendors affected by floods.H1H2H3H4Name of interviewee............................................................................................................................................................................................................Kind of market business................................................................................................................................................................................................How long have you been operating?.........................................................................................................................................................Do you sell at the market every day? If so, for how many hours usually?.............................................................................................................................................................................................................................................................................H5Are you yourself from <strong>Nadi</strong>/Ba?...........................................................................................................................................................................BFLOOD WARNINGSThe purpose in this section is to get an understanding of whether or not a short term warningsystem (1–3 hours) would make any difference to people in reducing losses in the future. Thiswill determine whether or not a warning system could be developed or not. It also gives usinformation on how people find out about and cope with floods so that we could work out howto reach them using an early warning system.B1B2B3Were you aware of the risk of flooding in this area before the floods hit this year?(circle) Y NHow many floods have you experienced here before?...................................................................................................Before January this year, when did you last suffer from flooding here?.....................................................................................................................................................................................................................................................................................................................................................................................................................................................................................................................................................................................................63SOPAC Technical Report 426
Economic costs of January 2009 <strong>Nadi</strong> floodsB4When the 2009 flood happened, how did you first find out about it? (circle)(i) Water entering the building (ii) Radio (iii) Television(iv) Phone call from friend/colleague (v) Text message(vi) Saw heavy rain(vii) Saw river rise(viii) Contacted in person by friends/neighbours(ix) Other (specify) ...............................................................................................................................................................................................................................................................................................................................................................................................................................................................................................B5Did you get flooded this year? If NO, go to section C. If YES, how much warning didyou get before water came in?..........................................................................................................................................................................................................................................................................................................................................................................................................................................................................................................................................................B6Did you take any other measures to protect your property (lift/move possessionsetc.)? Y NIf YES, what did you do?..........................................................................................................................................................................................................................................................................................................................................................................................................................................................................................................................................................B7What effect did it have (how did it help)?.......................................................................................................................................................................................................................................................................................................................................................................................................................................................................................................................................................................................................................................................................................................................................................................................................................................CWATER QUALITYThe purpose in this section is to understand the scale of flooding and its impact on waterquality. This information can be used to predict future flood impacts in the future.C1What changes in the river did you notice during the flood (if any)?Increase in unpleasant smellsBad taste in tap waterIncreased murkinessOther (specify)..................................................................................................................................................................................................................................................................................................................................................................................................SOPAC Technical Report 42664C2.............................................................................................................................................................................................................................................................................How many days after the flood was it before those changes went away?.........................................................................................................................................................................................................................................................................................................................................................................................................................................................................................................................................................
Economic costs of January 2009 <strong>Nadi</strong> floodsIMARKET/HAWKER LOSSESThe purpose in this section is to get an understanding of how much market vendors lost as aresult of the flood.I1If you suffered any damage to your business because of the 2009 floods, what typesof damage did you suffer?Loss of produce that you grew for saleLoss of items that you purchasedDestroyed tablesDestroyed bagsOther (please specify).....................................................................................................................................................................................................................................................................................................................................................................................................................................................................................I2SHOW DISPLAY CARD TO INTERVIEWEE. What would you say was the total value ofthose losses?$ ......................................................................................................................................................................................................................................................................I3Did you lose any items that were irreplaceable to your business and are difficult to puta value on (records, permits etc.)? If YES, which items?..........................................................................................................................................................................................................................................................................................................................................................................................................................................................................................................................................................I4 During the flood, did you have to evacuate the market/street? Y NIf NO, go to question I9.I5If YES, how did you evacuate? (circle)(i) Own vehicle (ii) Taxi (iii) Bus(iv) Used family/friend’s vehicle (v) Boat (vi) Evacuation team(vii) Other (specify).....................................................................................................................................................................................................................I6 For how long did you evacuate? ....................................................................daysI7 Did you relocate your business to somewhere else? Y NIf NO, go to question I9.65SOPAC Technical Report 426
Economic costs of January 2009 <strong>Nadi</strong> floodsI8If YES, where did you go?.........................................................................................................................................................................................................................................................................................................................................................................................................................................................................................................................................................I9Did you experience disruption in basic services affecting your business?If YES, what services were disrupted? (circle all that apply)TransportElectricityWater supplyTelephoneI10On average, how long did you have to wait for these services to start again?..........................................................................................................................................................................................................................................................................................................................................................................................................................................................................................................................................................I11If your business was disrupted because of the floods, what was the specific reason?(circle)Market floodedUnable to operate due to poor weatherUnable to reach market/place of sale/townUnable to access provisions/shopsOther (specify).............................................................................................................................................................................................................................................................................................................................................................................................................................................................................................................I12To date, how many days business did you lose due to this flood disruption?....................................................................daysI13Roughly how much did your business lose due to this disruption?Either Estimated total $.............................. Or Average revenue lost per day $.....................................I14Is your business (property and assets) currently covered by insurance? If NO, go toquestion I16. If YES (circle):SOPAC Technical Report 42666I15None Some AllIf only some items are covered, which ones are covered?Building Assets for sale FurnishingsOther (specify) ............................................................................................................................................................................................................................................................................................................................................................................................................................................................................................................
Economic costs of January 2009 <strong>Nadi</strong> floodsI16Would you say that the insurance you have covers the full value of your losses?Why?..........................................................................................................................................................................................................................................................................................................................................................................................................................................................................................................................................................I17 Did your business benefit in any way because of the floods? If NO, go to section E.If YES, how did it benefit (customers diverted from elsewhere etc.)?..........................................................................................................................................................................................................................................................................................................................................................................................................................................................................................................................................................I18Would you be able to say by how much your income increased?.............................................................................................................................................................................................................................................................................EACCESS TO COMMUNICATIONSThe purpose in this section is to get an understanding of how we might be able to advisepeople of an oncoming flood in the future.E1Does your household/business have any of the following items operating daily?ElectricityPhone land lineMobile phoneElectricity powered radioBattery powered radioTelevisionComputer with access to the internetFiji Times newspaperThe Sun newspaperDaily Post newspaperFaxTick if ‘yes’E2E3Are you an active member of a community or church group where you obtaininformation about this town? Y NIf YES, which one(s)?..........................................................................................................................................................................................................................................................................................................................................................................................................................................................................................................................................................67SOPAC Technical Report 426
Economic costs of January 2009 <strong>Nadi</strong> floodsE4How do you get information on the latest developments in town? (circle)(i) Family (ii) Friends (iii) Church (iv) Community group(v) Public notice board (vi) Newspaper (vii) Radio (viii) District Officer(ix) Other (specify) .................................................................................................................................................................................................................................................................................................................................................................................................................................................................................................E5Generally speaking, what is the best way to contact you in an emergency (phone,neighbours etc.):During the day?.............................................................................................................................................................................................................................................................................At night?.............................................................................................................................................................................................................................................................................E6How would you contact others in the event of an emergency?..........................................................................................................................................................................................................................................................................................................................................................................................................................................................................................................................................................JFINAL COMMENTSExplain that this is the end of questionnaire.Thank the respondent for their time and effort.J1Would you like to add any comments about the flooding?.......................................................................................................................................................................................................................................................................................................................................................................................................................................................................................................................................................................................................................................................................................................................................................................................................................................Explain that the results of the survey will be made available to the government around Marchto April and that these will be released to the public after verification. The results of the surveywill be produced in a report that goes to the government later in the year.SOPAC Technical Report 42668If respondents would like to find out more about the survey, they should in the first instancecontact:Mosese SikivouSOPACPh. 338-1377 x.252THANK YOU FOR HELPING US IN THIS WORK
ANNEX 3Economic costs of January 2009 <strong>Nadi</strong> floodsFIJI FLOOD IMPACTASSESSMENT: TRAININGNOTES1 BACKGROUNDThe Government of Fiji has requested help to assess the impact of the floods that occurredacross Fiji in early 2009. To address this, SOPAC and the UNDP are conducting surveys in <strong>Nadi</strong>and Ba to estimate the losses to families and local businesses. The information generated willbe used to lobby for greater investment in flood mitigation and warning systems (for example,designing better warning systems) as well as to support the Government of Fiji to better managethe <strong>Nadi</strong> and Ba catchments in the future.1.1 The surveysThe surveys will collect information on:• the types of damage families and businesses experienced because of flooding• the financial costs of any damage or losses• how people might avoid flood damage in the future.Interviewers will be asked to interview key household members or business operators to findout about their experiences and views of the flood situation. They will log the answers inEnglish on questionnaires. Data analysis will be conducted by SOPAC. Once the data havebeen analysed, a policy brief will be given to the government to explain how much people lost.This information will be made public. A technical report with more details will also be publishedlater on but this will take some time before it is ready.Household and business surveys will be conducted as follows:<strong>Nadi</strong>: 16–20 February (plus two days of discussions with groups but you will not be requiredfor this)Ba: 23–27 February.It is possible that the household and business surveys may need to be extended for a fewmore days than currently planned. If this occurs, we may invite you to stay on with us to assistin the survey for a few more days.69SOPAC Technical Report 426
Economic costs of January 2009 <strong>Nadi</strong> floods2 INFORMATION FOR NADIINTERVIEWERS: HOW THESURVEY WILL OPERATEThere are up to three sets of questionnaires, as follows:• householders• businesses, including market stall operators and hawkers (people who travel from placeto place selling)• hotels.You will use the questionnaires to find out about people’s experiences and losses. You willwrite down the answers on the questionnaire during the interview. Later on, you will pass thecompleted forms to a data person.2.1 Piloting the surveyThe first day of the survey will involve checking to see that the questionnaire actually works. Thismeans conducting the surveys to see if the questions make sense or if people get confused. Ifpeople get confused, please mark down which questions are the problem, what’s happeningand, if you have an opinion, why you think it may be happening. Tell SOPAC when you getback at the end of the day. SOPAC will change the question to make it easier for people tounderstand2.2 Who to targetYou will be asking people whether they suffered any financial losses during the flood (and howmuch). You will conduct the survey with households and businesses that were flooded andthose that were not.To get the information we need, you must only interview adults who are based permanentlyat the address of the household or business. You cannot interview any children, students,extended family or employees because they may not know about the financial costs orinsurance. Likewise, you cannot interview the elderly members of households such as Grandmaor Granddad. Although these people may be the senior heads of the household, they may notbe in charge of the purse strings. Finally, you cannot interview visiting guests who are notpermanently residing in houses because the early warning flood system is not intended totarget them so their views are not the most critical.SOPAC Technical Report 42670HouseholdsOnce you have introduced yourself to whoever answers the door, ask to speak to the head ofthe house who looks after finances and who lives at the house permanently. (This person maybe male or female.)
Economic costs of January 2009 <strong>Nadi</strong> floodsWho to interview in household surveys• Target the active head of household for information on losses.• Don’t interview children or students.• Don’t interview the elderly.• Make sure the person lives there permanently (no temporary guests).BusinessesOnce you have introduced yourself to whoever answers, ask to speak to the owner of thebusiness or whoever looks after finances or the office. The owner, accountant or office managerwould be the best person to speak to (unless he or she refers you to someone else).Who to interview in business surveys• Target the owner for information on insurance, finances.• Don’t interview employees unless directed to by the boss.2.3 Daily routine for the surveyInterviewers will:• assemble at a meeting/briefing point each morning before setting off. The reason to meetis to:- sign in. This is a rare occasion in that you will be paid for assisting in the survey. This isnot usual and is unlikely to happen again. You will only be paid for those days whereyou have signed in.- debrief. The team can exchange any views on how the surveys are going generally,what aspects of the survey need to be changed and whether there are any otherproblems we need to know about.- get access to the SOPAC driver who will take people working in more distant areas tokey drop-off/pick-up points• conduct interviews throughout the day• submit completed questionnaire forms to SOPAC.Daily schedule• Meet each morning at District Office Ba at 8.30 am; sign in.• Discuss survey/plans for the day (who is going where etc.).• Go off and do interviews.• Return to District Office Ba each afternoon between 4.30 and 5 pm. Submit completedquestionnaires to SOPAC. Explain any problems with the survey or questionnaires that youmay be having.71SOPAC Technical Report 426
Economic costs of January 2009 <strong>Nadi</strong> floods3 TRAINING SESSION ISSUES3.1 What each question means and why it isneededWe will take you through the meaning of each of the questions during the training sessionitself. It is critical that you understand why we need each set of information as you may needto clarify the question for people who are confused. (The chances are you will need to do thisclarification in either Fijian or Hindustani.)3.2 TeamsInterviewers will work in pairs, preferably one each of indigenous Fijian and IndoFijianbackground. This is to ensure that we have coverage of English, Fijian and Hindustani for allinterviews but we will have to be flexible. We will organise teams at morning tea on the day oftraining.3.3 Who is going whereEach team will be given a map marked with specific districts to target.Target households first and, when these are done, target businesses. Take houses/businessesone at a time. Note each house/business as you approach it. Note any houses/businesseswhere no one is home so that you know to come back again and try later. Note any houses/businesses where people say they don’t want to participate in the survey. Note times to returnto houses/businesses when people ask you to try again later.When you have finished your assigned districts, come back to SOPAC for new districts orfurther instructions.Vili’s housesHousehold 1 …..Household 2 ….. no one homeHousehold 3 ….. said ‘no’Household 4 …..Household 5 ….. try again at 5 pm…..…..SOPAC Technical Report 42672
Economic costs of January 2009 <strong>Nadi</strong> floods4 PRACTICAL ISSUES4.1 Number of questionnaires to fillHouseholdsPlease aim to interview every sixth house in your districts. Try to get 20 household questionnairescompleted per district. This will include households that were affected by the flooding andthose that were not. Where households were not affected by flooding, it just means that theinterview will be very short.BusinessesPlease aim to interview every fifth business in your district. Please include surveys by businessesthat got flooded as well as completed surveys for those that did not.4.2 Greeting householdersPlease introduce yourself by name.Explain that the government is trying to understand how much the floods have cost thecommunity (families and businesses). Explain that this survey is being undertaken to do this.Explain that you are helping collect this information by interviewing families and businesses.Ask whether it would be convenient to speak to the male or female head of the house toconduct the survey. Note that you would need a permanent resident of the household and thatthe person would need to know about finances etc.4.3 Greeting prospective intervieweesThank the person for coming out. Introduce yourself as before.Ask whether the person would be available to conduct the survey. Explain that the questionnairewould take between half an hour and an hour to complete. If the person is not available then,ask when might you able to come back to interview them. If they agree, mark down the timeto return on your address list and make sure you return at that time. If they will not participate,thank the person for their time and move onto the next house. Make sure you write downimmediately on your address list which houses declined to participate in the survey.When interviewing families, always remember to ask whether the household also runs abusiness. If YES, ask if they will participate in the business survey too.4.4 During the interviewPlease conduct your interview in whichever language is easiest for you and the person beinginterviewed. However, you must write all answers on the questionnaire in English only.73SOPAC Technical Report 426
Economic costs of January 2009 <strong>Nadi</strong> floodsAsk the question and let the respondent answer it themselves. If people take a while to answerthe question, do not prompt them. Under no circumstances can you answer the question onbehalf of the person. If you prompt the person, you may influence their answer and we may endup with the wrong data. If you answer the question yourself, the answer will be invalid.If people look like they are having difficulty with a question, ask whether they would like you torepeat the question or ask if they understand what you mean.If you need more space to give an answer:• use the sheets on the note pad provided• mark the name of the person being interviewed on the top of the note pad paper• attach these to the questionnaire.5 LOGISTICS5.1 What we will provide to you• Training• Pens• Questionnaires• Name badges• Extra note paper for notes/emergencies• Interview district maps• Payment for complete days worked. (You will need to provide your own lunch.)• Transport to and from remote interview districts. For those interviewing in downtown <strong>Nadi</strong>,you will be expected to walk.5.2 What you will need to carry with you• Your maps of districts to target to interview• Pen and questionnaire forms• Extra paperYou may also want to carry around some personal effects such as something to drink, somerepellent or sun screen etc.SOPAC Technical Report 42674You are responsible for your own transport to and from the meeting/briefing point each morning.You are also responsible for bringing your own wet weather gear if it rains during the survey.5.3 Meeting/ briefing pointThis is located at the District Office <strong>Nadi</strong>.
ANNEX 4Economic costs of January 2009 <strong>Nadi</strong> floodsCALCULATING HOUSEHOLDPOPULATION SIZEData on the number of households and their location by enumeration district within the greater(urban and rural) <strong>Nadi</strong> area were sourced from the Fiji Islands Bureau of Statistics census datafor 2008. Boundaries for the <strong>Nadi</strong> urban and rural areas were mapped digitally and linked tothe census data for each district. The number of enumeration districts and accompanyinghouseholds falling within the greater <strong>Nadi</strong> boundaries were then calculated using a geographicinformation system (GIS) (table 4A).Table 4A: Greater <strong>Nadi</strong> household populationPhysical areatotal (ha)Number ofhouseholdsNumber ofpeopleUrban 494 1 525 2 283Rural 10 750 8 099 16 887Total 11 244 9 624 19 170Similarly, the enumeration districts used for the survey <strong>Nadi</strong> areas were mapped digitally. Thetotal number of households and population falling within the survey enumeration districts werecalculated using GIS (table 4B).Table 4B: Survey area’s household populationNumber ofhouseholds insurvey areaShare of surveyhouseholds in<strong>Nadi</strong> (%)Number ofpeople insurvey areaShare of peoplecovered insurvey area (%)Urban 557 37 2 283 40Rural 3 348 41 16 887 44Total 3 905 4175SOPAC Technical Report 426
ANNEX 5Economic costs of January 2009 <strong>Nadi</strong> floodsCALCULATINGBUSINESS POPULATIONSIZEData on urban <strong>Nadi</strong> businesses were provided in an Excel spreadsheet. Data on rural <strong>Nadi</strong>businesses were provided as photocopies of the licensing book.Number of businesses in greater <strong>Nadi</strong>Licensing information provided by the two administrations was different, with one set providingmore detail on the type of business. Both data sets contained some gaps (for example,sometimes only a person’s name was provided, or the broad area in which the businessoperated) so it was not always possible to determine the location of the business. It was thusnot practical in the time available for the survey to determine the total number of businessesacross enumeration district. It was also not possible to determine the total number of businessesby size. Given the purpose of licensing data is not to describe the size of the business (onlyits existence), the data seldom provided sufficient information to, for example, consistentlydistinguish between market vendors and shops. This issue is important for extrapolating thebusiness losses calculated from the survey sample to the overall population.The number of businesses was calculated by type: retail, eatery, exporter/wholesaler/manufacturer, accommodation, petrol outlet, service, buses and taxis, and ‘other’ (for businessesthat could not be defined due to lack of information). Entries reflecting schools were removedbecause flood assessment of education losses is the remit of the Department of Educationand not part of this flood assessment. Businesses were then manually classified, includinga calculation of the number of each type of business. (Businesses from the urban data setwere counted using Excel. Entries for rural <strong>Nadi</strong> were counted manually.) Table 5A shows thenumber of observed businesses for the greater (rural and urban) <strong>Nadi</strong> area in each category.SOPAC Technical Report 42676Table 5A: Greater <strong>Nadi</strong> businesses, by categoryTotal business populationBusiness populationrepresented in surveyRetail (inc. petrol) 1431 524Eateries 337 123Exporters, manufacturers,wholesalers165 60Services* 1862 682Total 3795 1389* Including accommodation, buses and taxis, and ‘other’.
Economic costs of January 2009 <strong>Nadi</strong> floodsNumber of businesses across survey areaGIS was used to determine the area covered by the survey. Boundaries for the <strong>Nadi</strong> urbanand rural areas were mapped digitally, as were enumeration districts used for surveying. Thetotal area of greater <strong>Nadi</strong> and the total area covered by the survey enumeration districts werecalculated and compared: the survey area was estimated to cover around 37 per cent ofgreater <strong>Nadi</strong> (table 5B). Total businesses for greater <strong>Nadi</strong> were then estimated to be around 37per cent of greater <strong>Nadi</strong> totals (table 5C).Table 5B: Total area surveyedPhysical areatotal (ha)Physical areasurveyed (ha)Share of landarea surveyed(%)Urban 494 247 50Rural 10750 3869 36Total 11244 4116 37Table 5C: Commercial enterprises around the <strong>Nadi</strong> survey areaLicensedurbanpopulation*Licensedruralpopulation**Populationrepresentedin surveyRetail(inc. petroloutlets)Eateries(restaurants,milk bars,takeawaysetc.)Wholesalers,manufacturersand exportersServices (inc.transport,buses andtaxis, hoteland nondefined)Total906 257 139 1533 2835525 80 26 329 960529 125 61 689 1404Total 1431 337 165 1862 3795Source: * <strong>Nadi</strong> Town Council,** <strong>Nadi</strong> District Office.77SOPAC Technical Report 426
ANNEX 6Economic costs of January 2009 <strong>Nadi</strong> floodsSUMMARY OUTCOMESOF FOCUS GROUPDISCUSSIONSFollowing the sample survey of businesses and families across <strong>Nadi</strong>, focus group sessionswere conducted with respondents who were keen to discuss the floods further, and withgovernment representatives. The purpose of the focus group sessions was to provide depth tocommunity perceptions of the floods (for example, flood causes and problems with the disasterresponse). The government focus group was intended to provide government representativeswith an opportunity to consider the views of the community and share their own views.1. Community focus group summarySection i—likelihood and impact of flooding1 What differences have you noticed regarding the river and its quality? Are therechanges over time?• River becoming shallower• River expansion due to soil erosion, thus affecting houses• Soil erosion and increase of sedimentation2 How are these problems affecting your business or quality of life and theenvironment?• Boats get stuck and have problems passing the river to go fishing.• Soil erosion. The consequences are less space for livestock and farming.• People rely on river water for washing. But water cuts mean they now also useriver for drinking etc., even though river water is polluted.SOPAC Technical Report 426783 Do you think that any members of the community suffered particularly badly becauseof the flood? If so, what are the reasons?• Housing schemes in villages don’t assess buildings or work out the best placesto build houses.• Housing regulations don’t incorporate flood risk.• There is no assessment looking at the risk and vulnerability of the place where thehouses are supposed to be built.• Mostly women are badly affected by the floods because women are the onestaking care of the family and they are the ones losing jobs• Freshwater mussels are destroyed because of the floods. These provide incometo families. Also, freshwater fish and green leafy vegetables are destroyed. Womenare more concerned about this than are the men.
Economic costs of January 2009 <strong>Nadi</strong> floodsSection ii—assistance/response/mitigation/recovery1 What did you do when your house got flooded? What would have helped you to bettercope with the flood?• Contacted family.• People focused more on the weather forecast and the tides, thinking that thewater would go down when the tides went out. However, the flood level got higheranyway.• Received no immediate assistance.• DISMAC and the Red Cross team should be stationed/used in different places sothey can be contacted by affected areas.• Police should be present during and after the floods to avoid looting and to makehouses safe.• The Health Department needs to be on time with cleaning materials (gloves,masks etc.).• Spraying insect controllers need to be on time.2 What are your three highest priorities to recover from the damages caused by theflood?• Access funds (loans). People have lost everything and start from nothing. Mosthave no money to pay bills, to buy food, to send kids to school etc. They would findit helpful if they would have access to funds/loans to take care of those financialburdens.• Undertake dialogue with the consumer council to lower prices of food to meetneeds• Repair houses.• Seek assistance from experts.• Conduct more awareness programs.79SOPAC Technical Report 426
Economic costs of January 2009 <strong>Nadi</strong> floodsSection iii—responsibilities1 What do you think would be responsibilities of the government and the community tobetter respond and be prepared for future scenarios?Key actionResponsibilityGovernment Community Private sectorProper plan P P PImmediate assessment and help,with all evacuation centres in <strong>Nadi</strong> tobe identifiedP P PBetter communication from local tonational levelMore transparency amongrepresentatives of the Red Cross,DISMAC and non-governmentorganisationsP P PP P PTuranga ni koro P P PAwareness raising workshops,programs etc.P P PTraining of local resource peoplePPMorecommunityservicesSOPAC Technical Report 42680
Economic costs of January 2009 <strong>Nadi</strong> floods2. Government stakeholder focus groupsummaryKey actionsProper plans thatincorporate disaster riskGovernmentSOPAC forpreparation,response, reliefNongovernmentorganisations/internationaldevelopmentagenciesCommunityPrivateSectorP People PImmediate assessment/help P P P PRisk sensitive development P P PImproved dredging anddrainagePCalculation of the risk offloodingAssessment of why the riverflow and size changedRegulation of dams P PBetter transport forevacuation (e.g. boats)PIdentification of safeevacuation centres in allcommunitiesDevelopment activities thatdo not increase the floodriskAwareness programs invillagesImprovement of warningdisseminationA crop insurance schemefor households andbusinessesPrompt crop rehabilitation(seeds, fertiliser, farmimplements)Food rations for at leastthree monthsAssistance in cleaning uphouses, business, farmsLandowners,chiefsP P PP P PP P PP P P PPPP P P PP P PP P PP P PP P P PP81SOPAC Technical Report 426
Economic costs of January 2009 <strong>Nadi</strong> floodsSOPAC Technical Report 42682
Economic costs of January 2009 <strong>Nadi</strong> floods83SOPAC Technical Report 426
Economic costs of January 2009 <strong>Nadi</strong> floodsSOPAC Technical Report 42684