Brunswick UBS Conference in Moscow - Mobile TeleSystems
Brunswick UBS Conference in Moscow - Mobile TeleSystems
Brunswick UBS Conference in Moscow - Mobile TeleSystems

You also want an ePaper? Increase the reach of your titles
YUMPU automatically turns print PDFs into web optimized ePapers that Google loves.
<strong>Mobile</strong> <strong>TeleSystems</strong>Vassily SidorovPresident and CEO<strong>Brunswick</strong> <strong>UBS</strong> <strong>Conference</strong><strong>Moscow</strong>, September 2005Look<strong>in</strong>g to the Future…Internet site: www.mtsgsm.com/iremail address: ir@mts.ru
Safe HarborSome of the <strong>in</strong>formation <strong>in</strong> this presentation may conta<strong>in</strong> projections or other forwardlook<strong>in</strong>gstatements regard<strong>in</strong>g future events or the future f<strong>in</strong>ancial performance of MTS, asdef<strong>in</strong>ed <strong>in</strong> the safe harbor provisions of the U.S. Private Securities Litigation Reform Act of1995. You can identify forward look<strong>in</strong>g statements by terms such as “expect,” “believe,”“anticipate,” “estimate,” “<strong>in</strong>tend,” “will,” “could,” “may” or “might” the negative of such termsor other similar expressions. We wish to caution you that these statements are onlypredictions and that actual events or results may differ materially. We do not <strong>in</strong>tend toupdate these statements to reflect events and circumstances occurr<strong>in</strong>g after the datehereof or to reflect the occurrence of unanticipated events. We refer you to the documentsMTS files from time to time with the U.S. Securities and Exchange Commission,specifically, the Company’s most recent Form 20-F. These documents conta<strong>in</strong> and identifyimportant factors, <strong>in</strong>clud<strong>in</strong>g those conta<strong>in</strong>ed <strong>in</strong> the section captioned “Risk Factors,” thatcould cause the actual results to differ materially from those conta<strong>in</strong>ed <strong>in</strong> our projections orforward-look<strong>in</strong>g statements, <strong>in</strong>clud<strong>in</strong>g, among others, potential fluctuations <strong>in</strong> quarterlyresults, our competitive environment, dependence on new service development and tariffstructures; rapid technological and market change, acquisition strategy, risks associatedwith telecommunications <strong>in</strong>frastructure, risks associated with operat<strong>in</strong>g <strong>in</strong> Russia, volatilityof stock price, f<strong>in</strong>ancial risk management, and future growth subject to risks.2
Key Highlights• Strong year of subscriber and revenue growth• Expansion plans; acquisitions <strong>in</strong> Russia & FSU• i-mode launched• new growth prospects• platform for differentiation• CAPEX to go down <strong>in</strong> 2006• Increas<strong>in</strong>g returns to shareholders3
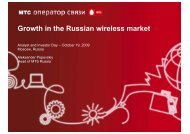
Strong Market Growth<strong>Mobile</strong> Market Growth <strong>in</strong>Russia and Ukra<strong>in</strong>eRussian penetrationUkra<strong>in</strong>ian penetration51%∼ 100%∼ 80%∼ 70%∼ 50%• Several years of +100%annual subscriber growth• Ukra<strong>in</strong>e follow<strong>in</strong>gRussia’s growth pattern12%6%4%0% 1% 2%25%8%14%29%• Increas<strong>in</strong>g effect of multi-SIM card usage1998 1999 2000 2001 2002 2003 2004 2005E 2006ESource: AC&M-Consult<strong>in</strong>g, MTS4
Evolution of <strong>Mobile</strong> Market <strong>in</strong> RussiaBeforeNowThe MarketEvolv<strong>in</strong>gMatur<strong>in</strong>gCustomerFocusAcquisitionRetentionMarketDevelopmentPrice warsBrand leadershipRevenueDriversCall volumePremium services5
Lead<strong>in</strong>g Operator <strong>in</strong> Russia and CIS• Strong subscriber growthcont<strong>in</strong>uesMTS’ Consolidated Subscriber Base2000-Aug 2005 (mln)• Leadership <strong>in</strong> all marketsRussiaUzbekistan48.30.10.5• Opportunities for furtherbus<strong>in</strong>ess expansionUkra<strong>in</strong>eTurkmenistan34.20.37.410.537.316.73.326.51.22.76.66.613.42000 2001 2002 2003 2004 Aug 2005Source: MTS6
MTS: #10 Largest CellCo <strong>in</strong> the WorldSubscribers (mln)1 Ch<strong>in</strong>a <strong>Mobile</strong> 231.02 Vodafone 165.03 Ch<strong>in</strong>a Unicom 121.84 T-<strong>Mobile</strong> 80.95 America Movil 73.86 Telefonica Moviles 69.97 Orange 66.78 C<strong>in</strong>gular 54.09 NTT DoCoMo 50.810 MTS 48.311 Verizon 47.412 Spr<strong>in</strong>t Nextel 44.4Source: Companies’ Data7
Bus<strong>in</strong>ess Expansion Opportunities• FSU countries offer significant growth potential• good macro-economic outlook• relatively low mobile and fixed-l<strong>in</strong>e penetrationCountryPopulation (mln)Penetration (%)PresenceFixed-l<strong>in</strong>e <strong>Mobile</strong> MTS VimpelCom MegafonRussia 143.2 25% 74% №1 #2 #3Ukra<strong>in</strong>e 47.5 21% 47% №1Uzbekistan 26.5 7% 3% №1Kazakhstan 15.1 16% 19% #2Belarus 9.8 32% 35% №1Azerbaijan 8.4 13% 19%Tajikistan 6.9 4% 2% #1Kyrgyzstan 5.1 8% 6%Georgia 4.4 21% 21%Turkmenistan 6.6 6% 1% №1Armenia 3.2 15% 5%Moldova 3.6 21% 22%(as of YE 2004 except for Russia, Ukra<strong>in</strong>e, Belarus, and Uzbekistan for which <strong>in</strong>formation is as of August 31, 2005)Source: MTS, AC&M-Consult<strong>in</strong>g8
Strong Underly<strong>in</strong>g GrowthUS$ mln H1/05 H1/04ChangeY-o-YRevenues 2,294 1,721 33.3%OIBDA 1,188 962 23.5%OIBDA marg<strong>in</strong>51.8% 55.9%-4.1ppNet <strong>in</strong>come 536 475 12.8%Source: MTS9
Grow<strong>in</strong>g Contribution from VAS• GPRS offered to pre-paidcustomers <strong>in</strong> Q2/05Consolidated Revenuesfrom VAS (US$ mln)229.4273.9165.6• Infota<strong>in</strong>ment: key futuredriver for VAS revenues75.7107.4H1/03 H2/03 H1/04 H2/04 H1/05• i-mode: MTS’ most recentlylaunched VAS platform<strong>Mobile</strong> Internet10%Basic VAS7%Source: MTSMessag<strong>in</strong>g62%Infota<strong>in</strong>ment21%Source: MTS10
BlackBerry: for Premium Subscribers• Scheduled for localized versionlaunch <strong>in</strong> Q4/05• Niche product• competitive advantage• premium subscriber loyalty• Revenue growth from premiumsubscriber segment12
CAPEX Driven by Subs Growth• $2bn CAPEX planned for 2005:• Russia $1,450m• Ukra<strong>in</strong>e $500m• Uzbekistan $50m• Ma<strong>in</strong> <strong>in</strong>vestments <strong>in</strong>:• coverage ~ 15%• capacity ~ 35%• IT & new technologies ~ 30%$176CAPEX /New OrganicSubscribersCAPEX /RevenuesMTS Group CAPEX (US$ mln)42%574$12295938%1,359$8135%~ 2bn~$100~40%• As core markets mature,CAPEX will start to decl<strong>in</strong>e2002 2003 2004 2005ESource: MTS13
Increas<strong>in</strong>g Returns to Shareholders• Recent dividend payoutratio ~ 40% of netearn<strong>in</strong>gsDividends 2002-2004$403m• Committed to <strong>in</strong>creas<strong>in</strong>g$220mdividends per share$111m40%43%41%$0.3 per ADS $0.6 per ADS $1.0 per ADS200220032004% of net earn<strong>in</strong>gsSource: MTS14
Significantly Increased Free Float• 10% share “overhang”removedFree Float47.4%• More domestic liquidity• Prospect of <strong>in</strong>creasedweight<strong>in</strong>g <strong>in</strong> MSCI• Independent Board membersSistema50.6%Others2.0%Source: MTS15
Criteria for LeadershipF<strong>in</strong>ancialВосприятиеEfficiencyабонентовLeadership <strong>in</strong> revenuesSubscriberPerceptionLeadership <strong>in</strong> subscriber perceptionCorporateВосприятиеCulture абонентовBus<strong>in</strong>essВосприятиеFootpr<strong>in</strong>t абонентовLeadership <strong>in</strong> attract<strong>in</strong>g, reta<strong>in</strong><strong>in</strong>gand develop<strong>in</strong>g best professionalsLeadership <strong>in</strong> geographical andcoverage footpr<strong>in</strong>tShareholderValueLeadership <strong>in</strong> <strong>in</strong>creas<strong>in</strong>g returns toshareholders*For FY 200416
AppendixNon-GAAP f<strong>in</strong>ancial measures. This presentation <strong>in</strong>cludes f<strong>in</strong>ancial <strong>in</strong>formation prepared <strong>in</strong> accordance with account<strong>in</strong>gpr<strong>in</strong>ciples generally accepted <strong>in</strong> the United States of America, or US GAAP, as well as other f<strong>in</strong>ancial measures referred toas non-GAAP. The non-GAAP f<strong>in</strong>ancial measures should be considered <strong>in</strong> addition to, but not as a substitute for, the<strong>in</strong>formation prepared <strong>in</strong> accordance with US GAAP.Operat<strong>in</strong>g Income Before Depreciation and Amortization (OIBDA). OIBDA represents operat<strong>in</strong>g <strong>in</strong>come before depreciationand amortization. OIBDA marg<strong>in</strong> is def<strong>in</strong>ed as OIBDA as a percentage of our net revenues. OIBDA may not be similar toOIBDA measures of other companies, is not a measurement under account<strong>in</strong>g pr<strong>in</strong>ciples generally accepted <strong>in</strong> the UnitedStates and should be considered <strong>in</strong> addition to, but not as a substitute for, the <strong>in</strong>formation conta<strong>in</strong>ed <strong>in</strong> our consolidatedstatement of operations. We believe that OIBDA provides useful <strong>in</strong>formation to <strong>in</strong>vestors because it is an <strong>in</strong>dicator of thestrength and performance of our ongo<strong>in</strong>g bus<strong>in</strong>ess operations, <strong>in</strong>clud<strong>in</strong>g our ability to fund discretionary spend<strong>in</strong>g such ascapital expenditures, acquisitions of mobile operators and other <strong>in</strong>vestments and our ability to <strong>in</strong>cur and service debt. Whiledepreciation and amortization are considered operat<strong>in</strong>g costs under generally accepted account<strong>in</strong>g pr<strong>in</strong>ciples, theseexpenses primarily represent the non-cash current period allocation of costs associated with long-lived assets acquired orconstructed <strong>in</strong> prior periods. Our OIBDA calculation is commonly used as one of the bases for <strong>in</strong>vestors, analysts and creditrat<strong>in</strong>g agencies to evaluate and compare the periodic and future operat<strong>in</strong>g performance and value of companies with<strong>in</strong> thewireless telecommunications <strong>in</strong>dustry. OIBDA can be reconciled to our consolidated statements of operations as follows:US$ mln H1/05 H1/04Operat<strong>in</strong>g <strong>in</strong>come 773.4Add: depreciation and amortization 415.1OIBDA 1,188.5678.6283.6962.2OIBDA marg<strong>in</strong> can be reconciled to our operat<strong>in</strong>g marg<strong>in</strong> as follows:US$ mlnOperat<strong>in</strong>g marg<strong>in</strong>Add: depreciation and amortization as apercentage of revenuesOIBDA marg<strong>in</strong>H1/05 H1/0433.7%18.1%51.8%39.4%16.5%55.9%17