Chemicals and Cleaning Products Production - PMMI
Chemicals and Cleaning Products Production - PMMI
Chemicals and Cleaning Products Production - PMMI

Create successful ePaper yourself
Turn your PDF publications into a flip-book with our unique Google optimized e-Paper software.
ECONOMICANDMARKETOUTLOOK•INVESTMENTPLANS•ECONOMICDOWNTURN •CAPITALINVESTMENT•PROSPECTIVESALES•LEADINGINDICATORS•MACROECONOMICFORECASTSQuarterlyEconomicOutlookPlanningfor1 st Quarter201311911FreedomDrive,Suite600,Reston,VA20190USAAquarterlyanalysisofthecurenteconomicsituationfacingmembers,withpurchasingplansforecast.
Table of ContentsEconomic Overview………………………………………………………………………………………………………………………….. 1Business Cycle………………………………………………………………………………………………………………………………….. 2Pharmaceutical <strong>and</strong> Medical Devices <strong>Production</strong>……………………………………………………………………………… 3Personal Care <strong>Products</strong> <strong>Production</strong>…………………………………………………………………………..………………………. 4Beverages, Coffee, <strong>and</strong> Tea <strong>Production</strong>……………………………………………………………………………..……………… 5<strong>Chemicals</strong> <strong>and</strong> <strong>Cleaning</strong> <strong>Products</strong> <strong>Production</strong>……………..…………………………………………………………….……… 6Durables, Hardgoods, Components <strong>and</strong> Parts <strong>Production</strong>………………...……………………..………………………. 7Food <strong>and</strong> Foods Preparation <strong>Production</strong>……………...…………………………………………………………..………………. 8Click Here for a Brief Explanation of How to Read This Report© 2013 ITR Economics - 603.796.2500 - www.itreconomics.com - All Rights Reserved
Table of ContentsCanada Industrial <strong>Production</strong>…………………………………………………………………………………………………………….. 9Southeast Asia Industrial <strong>Production</strong>…………………………………………………………………………………………………. 10Europe Industrial <strong>Production</strong>…………………………………………………………………………………………………………….. 11Latin America Industrial <strong>Production</strong>……………………………………………………………………..…………………………... 12Leading Indicators……………………………………………………………………………..………………………………………………. 13Appendix………………………..……………………………………………………………..………………………………………………….. 14Management Objectives……………...………………………………………………………………………………………………… 15© 2013 ITR Economics - 603.796.2500 - www.itreconomics.com - All Rights Reserved
overview105US Industrial <strong>Production</strong> Trend105100100Growth in the US economy is uneven <strong>and</strong> mild as post-recessions go.The general economy is growing despite the oft mentioneduncertainties (fiscal cliff, health care costs, sequestration, EU, China),<strong>and</strong> we have not changed our outlook for 2013 or 2014. At present,there are no negative signals in our repertoire of leading indicators toindicate that economic expansion will collapse over the next fewquarters. We anticipate that the US economy, as measured by GDP <strong>and</strong>US Industrial <strong>Production</strong>, will maintain a growth trend through themiddle of 2013.That is not to say that there is not weakness evident in some sectors.Nondefense Capital Goods New Orders (excluding Aircraft), a measureof business-to-business activity, has slowed significantly over the pastsix months <strong>and</strong> is projected to end this year slightly below 2011.Businesses have been hesitant to make capital expenditures due tolooming economic uncertainties including the presidential election <strong>and</strong>the so-called “fiscal cliff.” A rising trend will return in 2013 asreluctance due to the presidential election dissolves <strong>and</strong> 2013 tax ratesbecome a little clearer.Annual Retail Sales (excluding Automobiles) are at a record high <strong>and</strong>2.5% above the year earlier level, telling us that consumers are engagedin a favorite pastime—shopping. Although this pace is not as robust aswe would like to see, the fact that the level of spending isunprecedented sheds additional positivity on the overall economy.Light Vehicle Retail Sales rose 13.3% in the last three months compared959590908585'06 '07 '08 '09 '10 '11 '12 '13 '14 '15 '16to the same period in 2011 as consumers loosened their wallets a little<strong>and</strong> began to make substantial investments once again. The OctoberPurchasing Managers Index (PMI) was above the key-50 benchmark,indicating the US manufacturing sector is exp<strong>and</strong>ing. The PMIthroughout 2011 <strong>and</strong> the first half of 2012 signaled that the USeconomy will continue to grow through early 2013.Our own ITR Leading Indicator is mildly rising, suggesting that theoverall economy will quicken in its rate of growth into mid-2013. TheUS Leading Indicator has been generally increasing since the March2009 low <strong>and</strong> is above the year-earlier level, indicating additional rise inannual US Industrial <strong>Production</strong> ahead.The second half of 2013 will not provide as many opportunities as theremainder of this year <strong>and</strong> early 2013. Tax increases, as well as federal,state, <strong>and</strong> local government budget cuts will weigh heavily on theoverall economy. Expect a mild recession to begin in late 2013 in somesectors <strong>and</strong> early 2014 for Industrial <strong>Production</strong> <strong>and</strong> extend throughoutthe year.ITR Economics 1 1st Quarter - 2013
654321Business CycleOrder Industry Phase Where it’s at 2012 2013 2014 20151<strong>Chemicals</strong> & <strong>Cleaning</strong> <strong>Products</strong><strong>Production</strong>C 1.5% 0.4% 0.2% 2.3% 1.7%2 Personal Care <strong>Products</strong> <strong>Production</strong> C 6.2% 6.6% 5.1% -0.7% 4.3%345Durables, Hardgoods, Components<strong>and</strong> Parts <strong>Production</strong>Food <strong>and</strong> Foods Preparation<strong>Production</strong>C 6.6% 7.3% 3.5% -4.0% 0.8%C 2.5% 2.2% 1.3% -0.2% 1.1%Pharmaceutical <strong>and</strong> MedicalDevices <strong>Production</strong> B 2.4% 2.6% 1.9% 3.3% 4.1%6Beverages, Coffee, <strong>and</strong> Tea<strong>Production</strong>B 3.5% 3.9% 2.8% -5.1% 0.9%ITR Economics 2 1st Quarter - 2013
MarketPharmaceutical <strong>and</strong> Medical Devices <strong>Production</strong>SegmentsAnnual Trend: 98.8 Phase: B Year-over-Year: 2.4%Pharmaceutical <strong>and</strong> Medical Devices <strong>Production</strong>12-Month Moving AverageYear-over-Year Growth Rate12/12 Rate-of-Change11011088661051054410010020209595-2-2-4-490'06 '07 '08 '09 '10 '11 '12 '13 '14 '15 '1690-6'06 '07 '08 '09 '10 '11 '12 '13 '14 '15 '16-6IndustryOutlook2012: 2.6%2013: 1.9%2014: 3.3%2015: 4.1%Annual Pharmaceutical <strong>and</strong> Medical Devices <strong>Production</strong>rose 2.4% over the past year, <strong>and</strong> <strong>Production</strong> st<strong>and</strong>s atthe highest level in over three years. A generally agingpopulation, as well as m<strong>and</strong>atory health insurancecoverage for the US population, will keep <strong>Production</strong>growing through 2015, although the pace of rise willdiminish in the near term.Tension exists between the FDA, medical devicemanufacturers, <strong>and</strong> medical service providers asincidents of malware infecting medical devices raisequestions of patient safety. Medical devicemanufacturers often refuse to update operatingsystems for fear of violating FDA rules. In addition,fears exist regarding hackers overtaking such medicaldevices as pacemakers which could endanger patients’lives. These tensions, combined with the soon to beimplemented medical device tax, will result in slowergrowth for the industry in 2013.ITR Economics 3 1st Quarter - 2013
MarketSegmentsPersonal Care <strong>Products</strong> <strong>Production</strong>Annual Trend: 108.3 Phase: C Year-over-Year: 6.2%Personal Care <strong>Products</strong> <strong>Production</strong>12-Month Moving AverageYear-over-Year Growth Rate12/12 Rate-of-Change1201209911511566110110105105331001000095959090-3-385'06 '07 '08 '09 '10 '11 '12 '13 '14 '15 '1685-6'06 '07 '08 '09 '10 '11 '12 '13 '14 '15 '16-6IndustryOutlook2012: 6.6%2013: 5.1%2014: -0.7%2015: 4.3%Personal Care <strong>Products</strong> <strong>Production</strong> is at a record highafter gaining 6.2% over the past year. Although resultscame in within the forecast range, we have adjusted theforecast as we expect the rate of decline to be milderthrough 2014. Despite the slowing rate, <strong>Production</strong> willrise into early 2014, before a mild recession beginsaround mid-year. Rise resumes in early 2015.Soap & Toiletries <strong>Production</strong> rose 5.6% over the pastyear, <strong>and</strong> annual <strong>Production</strong> is now at a 54-month high.Internal trends suggest the pace of rise will diminish inthe near term, which will weigh on Personal Care<strong>Products</strong> <strong>Production</strong> in 2013.Aggressive sales tactics will serve you two-fold in thecoming years: they will help <strong>PMMI</strong> members increasesales in the short run <strong>and</strong> provide new clients who cansupport you during the mild 2014 recession.ITR Economics 4 1st Quarter - 2013
MarketSegmentsBeverages, Coffee, <strong>and</strong> Tea <strong>Production</strong>Annual Trend: 111.5 Phase: B Year-over-Year: 3.5%Beverages, Coffee <strong>and</strong> Tea <strong>Production</strong>12-Month Moving AverageYear-over-Year Growth Rate12/12 Rate-of-Change12012099115115661101103310510500100100-3-39595-6-690'06 '07 '08 '09 '10 '11 '12 '13 '14 '15 '1690-9'06 '07 '08 '09 '10 '11 '12 '13 '14 '15 '16-9IndustryOutlook2012: 3.9%2013: 2.8%2014: -5.1%2015: 0.9%Annual Beverage, Coffee, <strong>and</strong> Tea <strong>Production</strong> is at arecord high. Annual <strong>Production</strong> will rise though themajority of 2013 before declining late in the year.Expect a recovery to take hold around mid-2015.Annual Coffee <strong>and</strong> Tea <strong>Production</strong> has risen in recentmonths after being flat through the first half of theyear. Quarterly <strong>Production</strong> is up 7.1% from the yearagolevel, <strong>and</strong> additional gains in <strong>Production</strong> are likelyin the near term.Brewery <strong>Production</strong> has begun a long-awaited risingtrend that is likely to persist in the coming months.This is good news for an industry segment that hasbeen operating below year-ago levels since April 2011.<strong>PMMI</strong> members involved in this industry shouldmonitor their inventory levels <strong>and</strong> ensure they haveenough on h<strong>and</strong> to capitalize on the next four quartersof record levels of activity.ITR Economics 5 1st Quarter - 2013
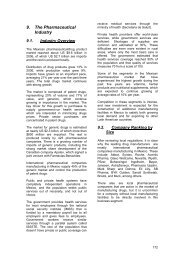
MarketSegments<strong>Chemicals</strong> <strong>and</strong> <strong>Cleaning</strong> <strong>Products</strong> <strong>Production</strong>Annual Trend: 93.5 Phase: C Year-over-Year: 1.5%<strong>Chemicals</strong> <strong>and</strong> <strong>Cleaning</strong> <strong>Products</strong> <strong>Production</strong>12-Month Moving AverageYear-over-Year Growth Rate12/12 Rate-of-Change102102996697973392920-30-38787-6-6-9-982'06 '07 '08 '09 '10 '11 '12 '13 '14 '15 '1682-12'06 '07 '08 '09 '10 '11 '12 '13 '14 '15 '16-12IndustryOutlook2012: 0.4%2013: 0.2%2014: 2.3%2015: 1.7%Annual Chemical <strong>and</strong> <strong>Cleaning</strong> <strong>Products</strong> <strong>Production</strong> has We expect the flat trend in <strong>Production</strong> to persist intofallen during the past four months but remains 1.5% early 2013, before growth resumes around mid-year.above the year ago level. Lackluster activity in theDespite near-term weakness in <strong>Production</strong>, low Naturalchemical industry caused us to revise the forecast.Gas Futures will help make American chemical<strong>Production</strong> will decline into mid-2013, before risingmanufacturing highly competitive in the globalthrough 2014. A mild decline will take hold in earlymarketplace. Manage overhead costs during this slow2015, before rise resumes in the second half of 2015.period, but be prepared for activity to reaccelerate inChemical <strong>Products</strong> <strong>Production</strong> is moving horizontally, the second half of 2013.with annual <strong>Production</strong> a mere 0.1% ahead of last year.ITR Economics 6 1st Quarter - 2013
MarketDurables, Hardgoods, Components, <strong>and</strong> Parts <strong>Production</strong>SegmentsAnnual Trend: 95.2 Phase: C Year-over-Year: 6.6%Durables, Hardgoods, Components, <strong>and</strong> Parts <strong>Production</strong>12-Month Moving AverageYear-over-Year Growth Rate12/12 Rate-of-Change103103151598981010559393008888-5-5-10-108383-15-1578'06 '07 '08 '09 '10 '11 '12 '13 '14 '15 '1678-20'06 '07 '08 '09 '10 '11 '12 '13 '14 '15 '16-20IndustryOutlook2012: 7.3%2013: 3.5%2014: -4.0%2015: 0.8%Durables, Hardgoods, Components, <strong>and</strong> Partsst<strong>and</strong>s at the highest level since December 2006.<strong>Production</strong> is 6.6% above the year-ago level, <strong>and</strong> Internal trends indicate additional growth is likely<strong>Production</strong> now st<strong>and</strong>s at a 45-month high. <strong>Production</strong> through the majority of 2013. <strong>PMMI</strong> members will findwill rise though 2013, before recession comes in early sales opportunities within this market in 2013.2014. Expect <strong>Production</strong> to decline through mid-2015;Furniture <strong>Production</strong> has been steadily improving, butrise resumes in the second half of the year.still remains 34.3% below the pre-recession peak. AAutomobile <strong>Production</strong> is a growing sector of this generally improving housing market will support gainsindustry. Annual North America Light Vehiclein <strong>Production</strong>. Currently, annual <strong>Production</strong> is at a<strong>Production</strong> surpassed the 15 million unit mark, <strong>and</strong> now three-year high, gaining 3.4% over the past year.ITR Economics 7 1st Quarter - 2013
MarketSegmentsFood <strong>and</strong> Foods Preparation <strong>Production</strong>Annual Trend: 102.5 Phase: C Year-over-Year: 2.5%Food <strong>and</strong> Foods Preparation <strong>Production</strong>12-Month Moving AverageYear-over-Year Growth Rate12/12 Rate-of-Change10610644104104331021022211100100009898-1-196'06 '07 '08 '09 '10 '11 '12 '13 '14 '15 '1696-2'06 '07 '08 '09 '10 '11 '12 '13 '14 '15 '16-2IndustryOutlook2012: 2.2%2013: 1.3%2014: -0.2%2015: 1.1%Annual Food <strong>and</strong> Foods Preparation <strong>Production</strong> reacheda record high in October, gaining 2.5% over the pastyear. <strong>Production</strong> will rise mildly over the next threequarters before the pace of rise accelerates in late2013. Recession takes hold in mid-2014 <strong>and</strong> laststhrough early 2015. Expect activity to surpass recordlevels by the end of 2015.Grocery Store Retail Sales totaled a record $566.3 billionin October (annual basis). Internal trends suggest Saleswill rise in the near term, albeit at a slower pace thanearlier in the year. The trend in Retail Sales will supportincreased Food <strong>Production</strong> into 2013.Animal Slaughtering (except Poultry) has been generallyflat this year, with annual <strong>Production</strong> coming in just0.2% below last year. When allocating resources for2013, plan on a relatively flat level of activity in thismarket early in the year.ITR Economics 8 1st Quarter - 2013
MarketSegmentsCanada Industrial <strong>Production</strong>Annual Trend: 97.0 Phase: C Year-over-Year: 2.1%Canada Industrial <strong>Production</strong>12-Month Moving AverageYear-over-Year Growth Rate12/12 Rate-of-Change105105101010010055009595-5-59090-10-1085'06 '07 '08 '09 '10 '11 '12 '13 '14 '15 '1685-15'06 '07 '08 '09 '10 '11 '12 '13 '14 '15 '16-15IndustryOutlook2012: 2.0%2013: 3.7%2014: -1.6%2015: 2.2%Annual Canada Industrial <strong>Production</strong> fell for the firsttime in 29 months in August, but we expect theeconomy to maintain an overall upward trajectorythrough 2013. Our forecast calls for Industrial<strong>Production</strong> to grow at a mildly accelerating rate throughthe majority of 2013, concluding the year up 3.7% from2012. Recession will set in come 2014, before recoverytakes hold in 2015.Canada Food <strong>Production</strong> is in Phase D, Recession, withannual <strong>Production</strong> falling to C$19.2 billion, a loss of1.6% from last year. Quarterly <strong>Production</strong> is 1.8% belowthe year-ago level, indicating additional decline is likelyin the near term. Look to control costs, such asovertime, during this recessionary period. Generaleconomic expansion in Canada next year will likely liftFood <strong>Production</strong> in 2013.ITR Economics 9 1st Quarter - 2013
MarketSegmentsSoutheast Asia Industrial <strong>Production</strong>Annual Trend: 116.6 Phase: C Year-over-Year: 0.3%Southeast Asia Industrial <strong>Production</strong>12-Month Moving AverageYear-over-Year Growth Rate12/12 Rate-of-Change135135202012512515151151151010105105559595008585-5-575'06 '07 '08 '09 '10 '11 '12 '13 '14 '15 '1675-10'06 '07 '08 '09 '10 '11 '12 '13 '14 '15 '16-10IndustryOutlook2012: 1.0%2013: 2.7%2014: 0.4%2015: 4.6%Recessions in Thail<strong>and</strong> (-13.4%), Taiwan (-2.4%), <strong>and</strong>Hong Kong (-2.7%) are quickening the Southeast AsiaIndustrial <strong>Production</strong> rate-of-change decline. Note thatwe downward revised our forecast to reflect weaksignals emanating from leading indicators. Internaltrends indicate annual Industrial <strong>Production</strong> will plateauinto early 2013 <strong>and</strong> then mildly grow through the end ofthe year. Expect <strong>Production</strong> to plateau again in 2014 asthe global economies deal with a mild recession, butrise resumes by 2015. <strong>PMMI</strong> members should consideropportunities to create sales channels in this region dueto increasing personal incomes.Consumer markets are exp<strong>and</strong>ing in many SoutheastAsian countries. Retail Sales are rising in Hong Kong(13.6%), Singapore (4.0%), Thail<strong>and</strong> (7.2%), <strong>and</strong> Korea(1.6%). Internal trends suggest retail activity willcontinue to rise into 2013.ITR Economics 10 1st Quarter - 2013
MarketSegmentsEurope Industrial <strong>Production</strong>Annual Trend: 99.5 Phase: D Year-over-Year: -1.3%Europe Industrial <strong>Production</strong>12-Month Moving AverageYear-over-Year Growth Rate12/12 Rate-of-Change11011010105510510500100100-5-5-10-109595-15-1590'06 '07 '08 '09 '10 '11 '12 '13 '14 '15 '1690-20'06 '07 '08 '09 '10 '11 '12 '13 '14 '15 '16-20IndustryOutlook2012: -2.3%2013: 0.8%2014: 0.8%2015: 0.8%Annual Europe Industrial <strong>Production</strong> is at a 17-monthlow, declining at the fastest rate in over two years. The3/12 rate-of-change is falling, providing an indicationthat the 12/12 rate-of-change will decline further in thenear term. Annual <strong>Production</strong> will mildly improve inlate 2013 through mid-2014, before recession returns inlate 2014. <strong>Production</strong> begins to rise again in the secondhalf of 2015.Europe Retail Sales are growing slowly, increasing 1.6%during the past year (annual basis). An uncertainEuropean economy will moderate growth in consumermarkets during the rest of the year. Germany, France,<strong>and</strong> UK Retail Sales are improving <strong>and</strong> will help retailersmitigate losses in other countries. Spain, Italy, <strong>and</strong>Portugal Retail Sales are diminishing, <strong>and</strong> ongoingausterity measures will yield less favorable marketconditions into 2013.ITR Economics 11 1st Quarter - 2013
MarketSegmentsLatin America Industrial <strong>Production</strong>Annual Trend: 147.5 Phase: D Year-over-Year: -1.7%Latin America Industrial <strong>Production</strong>12-Month Moving AverageYear-over-Year Growth Rate12/12 Rate-of-Change160160151515015010101401405513013000120120-5-5110'06 '07 '08 '09 '10 '11 '12 '13 '14 '15 '16110-10'06 '07 '08 '09 '10 '11 '12 '13 '14 '15 '16-10IndustryOutlook2012: -3.7%2013: 4.1%2014: -1.2%2015: 4.2%Latin America Industrial <strong>Production</strong> fell to an 18-monthlow in September, 1.7% below the year-ago level(annual basis). Annual <strong>Production</strong> will decline into early2013, but rise resumes around mid-year, lasting thoughmid-2014. A mild recession then takes hold throughearly 2015.Weakness in the Brazilian economy is the main sourceof drag in Latin America. Brazil Industrial <strong>Production</strong> is3.1% below the year-ago level. However, quarterly<strong>Production</strong> is 2.8% below the year ago level <strong>and</strong>improving, indicating the decline in annual <strong>Production</strong> isnearing an end.The Mexican economy is at a record size, exp<strong>and</strong>ing4.1% during the past year (annual Industrial <strong>Production</strong>basis). Industrial <strong>Production</strong> will maintain an upwardtrajectory through 2013, as the US economy, Mexico’sdominant export market, continues to exp<strong>and</strong> in 2013.ITR Economics 12 1st Quarter - 2013
INDICATORSUS Leading IndicatorsITR Leading Indicator(Actual)IndicatorHousing Starts(Most recent 12 months compared to same 12 months one year ago)Consumer Expectations Index(Most recent 12 months compared to same 12 months one year ago)Chicago Fed National Activity Index(Three-month average)US Leading Indicator(Raw Data)Purchasing Managers Index(Raw Data)S&P 500 Stock Prices(Raw Data)DirectionRisingRisingRisingAbove -0.7RisingTicked UpwardGenerallyRisingWhat it means for the US economyExpansion in the overall economy into mid-2013Economic growth into 2013Consumer confidence is on the rise, suggesting gains inconsumer spending aheadNo recession for the next 11 monthsContinued economic growth through early 2013Economic growth through the first half of 2013Near-term indications are positiveThe Leading Indicators are suggesting the US Economy will continue toexp<strong>and</strong> through the majority of 2013. Begin missionary efforts into newmarkets to help build a client base for the 2014 recession.ITR Economics 13 1st Quarter - 2013
Appendix—Market DefinitionsPharmaceutical <strong>and</strong> Medical Devices <strong>Production</strong> - Index, 2007 = 100. This industry comprises establishments primarily engaged in manufacturing medicalequipment <strong>and</strong> supplies <strong>and</strong> establishments primarily engaged in one or more of the following: (1) manufacturing biological <strong>and</strong> medicinal products; (2)processing (i.e., grading, grinding, <strong>and</strong> milling) botanical drugs <strong>and</strong> herbs; (3) isolating active medicinal principals from botanical drugs <strong>and</strong> herbs; <strong>and</strong> (4)manufacturing pharmaceutical products intended for internal <strong>and</strong> external consumption in such forms as ampoules, tablets, capsules, vials, ointments,powders, solutions, <strong>and</strong> suspensions.Personal Care <strong>Products</strong> <strong>Production</strong> - Index, 2007 = 100. This industry comprises establishments primarily engaged in manufacturing <strong>and</strong> packaging soap <strong>and</strong>other cleaning compounds, surface active agents, <strong>and</strong> textile <strong>and</strong> leather finishing agents used to reduce tension or speed the drying process.Beverages, Coffee & Tea <strong>Production</strong> - Index, 2007 = 100. This industry comprises establishments primarily engaged in one or more of the following: (1)manufacturing soft drinks; (2) manufacturing ice; <strong>and</strong> (3) purifying <strong>and</strong> bottling water <strong>and</strong> establishments primarily engaged in one or more of the following: (1)roasting coffee; (2) manufacturing coffee <strong>and</strong> tea concentrates (including instant <strong>and</strong> freeze-dried); (3) blending tea; (4) manufacturing herbal tea; <strong>and</strong> (5)manufacturing coffee extracts, flavorings, <strong>and</strong> syrups.<strong>Chemicals</strong> <strong>and</strong> <strong>Cleaning</strong> <strong>Products</strong> <strong>Production</strong>s - Index, 2007 = 100 . This industry comprises establishments who transform organic <strong>and</strong> inorganic raw materialsby a chemical process <strong>and</strong> the formulation of products.Industrial Durables, Hardgoods, Components <strong>and</strong> Parts - Index, 2007 = 100. This industry comprises establishments primarily engaged in the manufacture ofconsumer <strong>and</strong> commercial durable goods incl. metals, computer parts, electrical components, transportation equipment, <strong>and</strong> furniture.Food <strong>and</strong> Foods Preparation <strong>Production</strong> - Index, 2007 = 100. The food products manufactured in these establishments are typically sold to wholesalers orretailers for distribution to consumers, but establishments primarily engaged in retailing bakery <strong>and</strong> c<strong>and</strong>y products made on the premises not for immediateconsumption are included.Canada Industrial <strong>Production</strong> - Industrial production index for Canada, 2000 = 100, SA.Southeast Asia Industrial <strong>Production</strong> - Industrial production index for Southeast Asia, 2000 = 100, NSA.Europe Industrial <strong>Production</strong> - Industrial production index for Europe, 2000=100, NSA.Latin America Industrial <strong>Production</strong> - Industrial production index for Latin America, 2000=100, NSA.ITR Economics 14 1st Quarter - 2013
Management Objectives1 Positive leadership modeling (culture turns to behavior)Phase2 Establish goals: tactical goals which lead to strategic achievement3 Develop a system for measurement <strong>and</strong> accountability re:#24 Align compensation plans with #2 <strong>and</strong> #35 Be keenly aware of the BE (Break Even) point <strong>and</strong> check it regularly6 Judiciously exp<strong>and</strong> credit7 Check distributions systems for readiness to accommodate increased activity8 Review <strong>and</strong> uncover competitive advantages9 Invest in customer market research (know what they value)10 Improve efficiencies with investment in technology <strong>and</strong> software11 Start to phase out marginal opportunities12 Add sales staffA13 Build inventories (consider lead time <strong>and</strong> turn rate)14 Introduce new product lines15 Determine capital equipment needs <strong>and</strong> place orders16 Begin advertising <strong>and</strong> sales promotions17 Hire "top" people18 Implement plans for facilities expansion19 Implement training programsITR Economics 15 1st Quarter - 2013
Management Objectives1 Accelerate training2 Check the process flow for possible future bottlenecks3 Continue to build inventory4 Increase prices5 Consider outside manufacturing sources if internal pressures becoming tight6 Find the answer to “What next?”7 Open distribution centers8 Use improved cash flow to improve corporate governance9 Use cash to create new competitive advantages10 Watch your debt-to-equity ratio <strong>and</strong> ROI11 Maintain/pursue quality: don’t let complacency set in12 Stay in stock on A items, be careful with C items13 Consider selling the business in a climate of maximum “goodwill”14 Penetrate new selected accounts15 Develop plan for lower activity in traditional, mature markets16 Freeze all expansion plans (unless related to “what is next”)17 Spin off undesirable operations18 Consider taking on subcontract work if the backside of the cycle looks recessionary19 Stay realistic – beware of linear budgets20 Begin missionary efforts into new markets21 Communicate competitive advantages to maintain marginsPhaseBITR Economics 16 1st Quarter - 2013
Management Objectives1 Begin work force reductionsPhase2 Set budget reduction goals by department3 Avoid long-term purchase commitments late in the price cycle4 Concentrate on cash <strong>and</strong> balance sheet5 Reduce advertising & inventories6 De-emphasize commodity/services in anticipation of diminishing margins7 Weed out inferior products (lose the losers)8 Encourage distributors to decrease inventory9 Identify <strong>and</strong> overcome any competitive disadvantages10 Make sure you <strong>and</strong> the management team are not in denialC11 Cross train key people12 Watch Accounts Receivable aging13 Increase the requirements for justification of capital expenditures14Evaluate vendors for strength (don’t get caught honoring their warranties with no oneto accept returned goods)15 Manage the backlog through pricing <strong>and</strong> delivery, try to fill the funnelITR Economics 17 1st Quarter - 2013
Management Objectives1 Continue force reduction2 Reduce advertising – be very selective3 Continue to avoid long-term purchase commitments4 Review all lease agreements5 Increase the requirements for justification of capital equipment6 Eliminate all overtime7 Reduce overhead labor8 Combine departments with like capabilities <strong>and</strong> reduce management9 Select targets of opportunity where price will get the business10 Tighten credit policies – increase scrutiny11 Look for opportunistic purchases12 Grab market share as your competitor dies13 Prepare training programs14 Negotiate union contracts if possible15 Develop advertising & marketing programs16 Enter or renegotiate long-term leases17 Look for additional vendors18 Capital expenditures & acquisitions considered in light of market-by-market potential19 Make acquisitions – use pessimism to your advantage20 People will be scared – lead with optimism <strong>and</strong> “can do” attitudePhaseDITR Economics 18 1st Quarter - 2013