Problem Set 2
Problem Set 2
Problem Set 2

You also want an ePaper? Increase the reach of your titles
YUMPU automatically turns print PDFs into web optimized ePapers that Google loves.
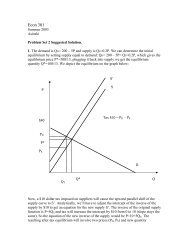
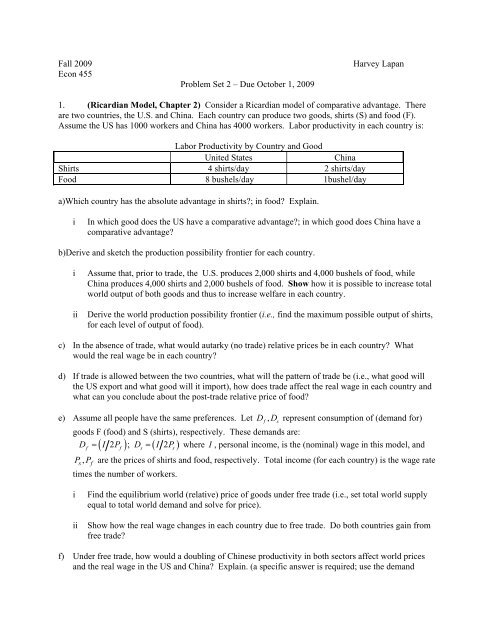
Fall 2009Econ 455<strong>Problem</strong> <strong>Set</strong> 2 – Due October 1, 2009Harvey Lapan1. (Ricardian Model, Chapter 2) Consider a Ricardian model of comparative advantage. Thereare two countries, the U.S. and China. Each country can produce two goods, shirts (S) and food (F).Assume the US has 1000 workers and China has 4000 workers. Labor productivity in each country is:Labor Productivity by Country and GoodUnited StatesChinaShirts 4 shirts/day 2 shirts/dayFood 8 bushels/day 1bushel/daya)Which country has the absolute advantage in shirts?; in food? Explain.iIn which good does the US have a comparative advantage?; in which good does China have acomparative advantage?b)Derive and sketch the production possibility frontier for each country.iiiAssume that, prior to trade, the U.S. produces 2,000 shirts and 4,000 bushels of food, whileChina produces 4,000 shirts and 2,000 bushels of food. Show how it is possible to increase totalworld output of both goods and thus to increase welfare in each country.Derive the world production possibility frontier (i.e., find the maximum possible output of shirts,for each level of output of food).c) In the absence of trade, what would autarky (no trade) relative prices be in each country? Whatwould the real wage be in each country?d) If trade is allowed between the two countries, what will the pattern of trade be (i.e., what good willthe US export and what good will it import), how does trade affect the real wage in each country andwhat can you conclude about the post-trade relative price of food?e) Assume all people have the same preferences. Let Df, Dsrepresent consumption of (demand for)goods F (food) and S (shirts), respectively. These demands are:D = I 2 P ; D = I 2Ps where I , personal income, is the (nominal) wage in this model, and( ) ( )f f sPs, P f are the prices of shirts and food, respectively. Total income (for each country) is the wage ratetimes the number of workers.iiiFind the equilibrium world (relative) price of goods under free trade (i.e., set total world supplyequal to total world demand and solve for price).Show how the real wage changes in each country due to free trade. Do both countries gain fromfree trade?f) Under free trade, how would a doubling of Chinese productivity in both sectors affect world pricesand the real wage in the US and China? Explain. (a specific answer is required; use the demand
curves from part (e) to find the new equilibrium relative price of shirts).g) Suppose the US and China, which already had an agreement to allow trade between themselves, agreeto add India to their trade agreement (and none of these countries trades with any other country).Rewriting the earlier table, the productivity of all 3 countries is given by:United States China IndiaShirts 4 shirts/day 2 shirts/day 2 shirts/dayFood 8 bushels/day 1bushel/day (1/2)bushel/dayiiiHow will the addition of India to this agreement affect which good the US exports and whichgood China exports? Can you tell which good India will export? (a verbal, not a quantitative,answer is expected here).How will the addition of India to the US-China trade agreement affect the (free trade) equilibriumrelative price of shirts (in terms of food). A verbal answer suffices.iii How will the addition of India to the US-China trade agreement affect welfare (real wages) in theUS and in China? Will both countries necessarily benefit by allowing India to join? Will Indiabenefit by joining this free trade zone? Explain carefully.2. (Extension of Ricardian model to many goods) To illustrate how the model can be extended tomore than two goods, consider the following example:Labor Productivity by Country and GoodFood Shirts TVs CDs ShoesUnited States 8 bushels/day 4 shirts/day 6 TVs/day 8 CDs/day 12 shoes/dayChina 1 bushels/day 2 shirts/day 2 TVs/day 2 CDs/day 12 shoes/daya) In which good(s) does the U.S. have an absolute advantage? In which good(s) does China have anabsolute advantage?b) Does China have a comparative advantage in shirts? If so, explain why?c) Find autarky relative prices in each country (for example, express the price of each good in terms ofshirts).d) If trade were allowed, what can you predict about the pattern of trade? (i.e., which goods the U.S.exports and which it imports)? Explain.e) Let W denote the wage in the U.S., and W denote the Chinese wage. Show where each good isproduced based upon the ratio of wages ( W / W ) between the two countries.f) Given relative labor supplies for each country, draw a graph to show how the equilibrium relativewage (US wage to Mexican wage) is determined. Explain the graph.g) Use the graph to discuss how a doubling of the Chinese population (and hence labor supply) willaffect: (1)US real wages; (2)the set of goods the US exports; (3)the relative prices of goods; and2
(4)Chinese real wages.3. (Specific Factor Model, Chapter 3) In the “simple” version of the specific factor model, thereare two sectors (goods), one factor (labor) that is perfectly mobile between the two sectors, and one fixed– or specific – factor in each sector. To be concrete, suppose the two goods are food and clothing, thespecific factor in food is “land” – represented by “T”, and the specific factor in clothing is “capital”,represented by “K”. The production functions for each sector are given by:( ) 12 12( ) ; ( ) 12( ) 12C = K L F = T Lf ; resource constraint: Lc + Lf= Lcwhere CF , represents the output of clothing and food, and Lc,Lfrepresent labor employed in clothingand food, respectively, and “L” represents the total amount of labor available in the economy.a) Derive the production possibility frontier for this economy (that is, express C as a function of F, andalso of the resources available: K,T,L).b) Assume in a market (capitalist) economy that labor mobility in the economy guarantees the wagewill be the same in the two sectors. Let Pc,Pfrepresent output prices and W the wage rate.Recognizing that labor demand in each sector is determined by profit maximiziation – which impliesequating the marginal value product of labor to the wage rate:iiiGiven output prices, show graphically how the equilibrium wage rate and the allocation of laborbetween the two sectors is determined.Using the production functions, show mathematically how the equilibrium wage rate and thesupply curve for each good (C, F) is determined (as a function of output prices). Also, discusshow the returns to land and capital are determined.iii Using your result in part ii, given output prices, show how an increase in the amount of land (T)available for production affects: (1)the quantity supplied of each good; (2)the real return to land;(3)the real return to capital; and (4)the real wage rate.c) Now assume there are two countries, the US and the UK, that are almost identical. They have thesame tastes (the same demand curves), the same technology, and the same amount of capital andlabor; however, the US has more land than the UK.iiiBased upon your results from part (b), what predictions would you make concerning the autarky(no trade) relative price of food in the UK as compared to the US? (a verbal answer suffices)If trade is allowed between the two countries, what will the pattern of trade be and how will therelative price of clothing change in each country?iii Finally, discuss how trade affects the real return to each factor (capital, land and labor) in eachcountry. Does each country as a whole potentially gain from trade? Does each interest group(factor owner) in each country also gain? Be as precise as possible (a verbal answer suffices).3