Summary of Consolidated Full Year Results for 2011
Summary of Consolidated Full Year Results for 2011
Summary of Consolidated Full Year Results for 2011

Create successful ePaper yourself
Turn your PDF publications into a flip-book with our unique Google optimized e-Paper software.
(English Translation)<br />
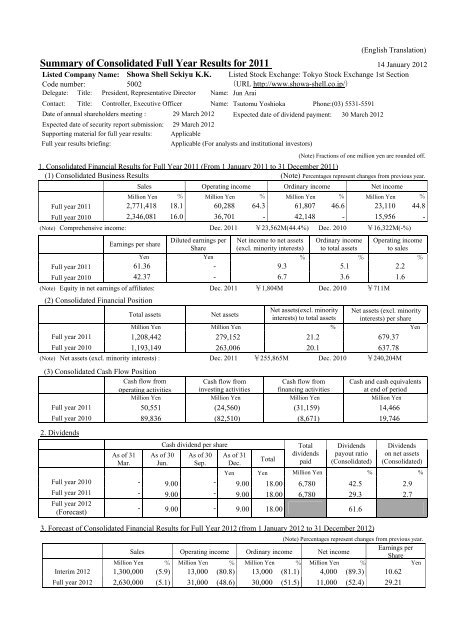
<strong>Summary</strong> <strong>of</strong> <strong>Consolidated</strong> <strong>Full</strong> <strong>Year</strong> <strong>Results</strong> <strong>for</strong> <strong>2011</strong> 14 January 2012<br />
Listed Company Name: Showa Shell Sekiyu K.K. Listed Stock Exchange: Tokyo Stock Exchange 1st Section<br />
Code number: 5002 (URL http://www.showa-shell.co.jp/)<br />
Delegate: Title: President, Representative Director Name: Jun Arai<br />
Contact: Title: Controller, Executive Officer Name: Tsutomu Yoshioka Phone:(03) 5531-5591<br />
Date <strong>of</strong> annual shareholders meeting : 29 March 2012 Expected date <strong>of</strong> dividend payment: 30 March 2012<br />
Expected date <strong>of</strong> security report submission: 29 March 2012<br />
Supporting material <strong>for</strong> full year results: Applicable<br />
<strong>Full</strong> year results briefing: Applicable (For analysts and institutional investors)<br />
(Note) Fractions <strong>of</strong> one million yen are rounded <strong>of</strong>f.<br />
1. <strong>Consolidated</strong> Financial <strong>Results</strong> <strong>for</strong> <strong>Full</strong> <strong>Year</strong> <strong>2011</strong> (From 1 January <strong>2011</strong> to 31 December <strong>2011</strong>)<br />
(1) <strong>Consolidated</strong> Business <strong>Results</strong> (Note) Percentages represent changes from previous year.<br />
Sales Operating income Ordinary income Net income<br />
Million Yen % Million Yen % Million Yen % Million Yen %<br />
<strong>Full</strong> year <strong>2011</strong> 2,771,418 18.1 60,288 64.3 61,807 46.6 23,110 44.8<br />
<strong>Full</strong> year 2010 2,346,081 16.0 36,701 - 42,148 - 15,956 -<br />
(Note) Comprehensive income: Dec. <strong>2011</strong> ¥23,562M(44.4%) Dec. 2010 ¥16,322M(-%)<br />
Earnings per share<br />
Yen<br />
Diluted earnings per<br />
Share<br />
Yen<br />
Net income to net assets<br />
(excl. minority interests)<br />
%<br />
Ordinary income<br />
to total assets<br />
%<br />
Operating income<br />
to sales<br />
%<br />
<strong>Full</strong> year <strong>2011</strong> 61.36 - 9.3 5.1 2.2<br />
<strong>Full</strong> year 2010 42.37 - 6.7 3.6 1.6<br />
(Note) Equity in net earnings <strong>of</strong> affiliates: Dec. <strong>2011</strong> ¥1,804M Dec. 2010 ¥711M<br />
(2) <strong>Consolidated</strong> Financial Position<br />
Total assets Net assets<br />
Net assets(excl. minority<br />
interests) to total assets<br />
Net assets (excl. minority<br />
interests) per share<br />
Million Yen Million Yen % Yen<br />
<strong>Full</strong> year <strong>2011</strong> 1,208,442 279,152 21.2 679.37<br />
<strong>Full</strong> year 2010 1,193,149 263,006 20.1 637.78<br />
(Note) Net assets (excl. minority interests) : Dec. <strong>2011</strong> ¥255,865M Dec. 2010 ¥240,204M<br />
(3) <strong>Consolidated</strong> Cash Flow Position<br />
Cash flow from<br />
operating activities<br />
Cash flow from<br />
Cash flow from<br />
investing activities financing activities<br />
Million Yen Million Yen Million Yen Million Yen<br />
<strong>Full</strong> year <strong>2011</strong> 50,551 (24,560) (31,159) 14,466<br />
<strong>Full</strong> year 2010 89,836 (82,510) (8,671) 19,746<br />
2. Dividends<br />
As <strong>of</strong> 31<br />
Mar.<br />
Cash dividend per share<br />
As <strong>of</strong> 30<br />
Jun.<br />
As <strong>of</strong> 30<br />
Sep.<br />
As <strong>of</strong> 31<br />
Dec.<br />
Total<br />
Total<br />
dividends<br />
paid<br />
Cash and cash equivalents<br />
at end <strong>of</strong> period<br />
Dividends<br />
payout ratio<br />
(<strong>Consolidated</strong>)<br />
Dividends<br />
on net assets<br />
(<strong>Consolidated</strong>)<br />
Yen Yen Million Yen % %<br />
<strong>Full</strong> year 2010 - 9.00 - 9.00 18.00 6,780 42.5 2.9<br />
<strong>Full</strong> year <strong>2011</strong> - 9.00 - 9.00 18.00 6,780 29.3 2.7<br />
<strong>Full</strong> year 2012<br />
(Forecast)<br />
- 9.00 - 9.00 18.00 61.6<br />
3. Forecast <strong>of</strong> <strong>Consolidated</strong> Financial <strong>Results</strong> <strong>for</strong> <strong>Full</strong> <strong>Year</strong> 2012 (from 1 January 2012 to 31 December 2012)<br />
(Note) Percentages represent changes from previous year.<br />
Sales Operating income Ordinary income Net income<br />
Earnings per<br />
Share<br />
Million Yen % Million Yen % Million Yen % Million Yen % Yen<br />
Interim 2012 1,300,000 (5.9) 13,000 (80.8) 13,000 (81.1) 4,000 (89.3) 10.62<br />
<strong>Full</strong> year 2012 2,630,000 (5.1) 31,000 (48.6) 30,000 (51.5) 11,000 (52.4) 29.21
4. Others<br />
(1) Important changes in scope <strong>of</strong> consolidated subsidiaries during the period : None<br />
(2) Changes in accounting principles and procedures used in the preparation or in the presentation<br />
<strong>of</strong> consolidated financial statements<br />
(Items contained in “Changes in the basis <strong>of</strong> presenting consolidated financial statements”)<br />
( I ) by new accounting standard : Applicable<br />
( II ) by others : None<br />
(Note) Please refer to “Changes in the basis <strong>of</strong> presenting consolidated financial statements” on page 23 <strong>for</strong> details.<br />
(3) Number <strong>of</strong> shares issued (Common shares)<br />
( I ) Number <strong>of</strong> shares issued<br />
(Inc. treasury shares)<br />
As <strong>of</strong> 31 Dec. <strong>2011</strong> : 376,850,400 As <strong>of</strong> 31 Dec. 2010 : 376,850,400<br />
( II ) Number <strong>of</strong> treasury shares As <strong>of</strong> 31 Dec. <strong>2011</strong> : 226,299 As <strong>of</strong> 31 Dec. 2010 : 225,209<br />
(III) Average number <strong>of</strong> shares As <strong>of</strong> 31 Dec. <strong>2011</strong> : 376,624,751 As <strong>of</strong> 31 Dec. 2010 : 376,626,724<br />
【Reference】<strong>Summary</strong> <strong>of</strong> Non-consolidated Financial <strong>Results</strong><br />
1. Non-consolidated Financial <strong>Results</strong> <strong>for</strong> <strong>Full</strong> <strong>Year</strong> <strong>2011</strong> (from 1 January <strong>2011</strong> to 31 December <strong>2011</strong>)<br />
(1) Non-consolidated Business <strong>Results</strong> (Note) Percentages represent changes from previous year.<br />
Sales Operating income Ordinary income Net income<br />
Million Yen % Million Yen % Million Yen % Million Yen %<br />
<strong>Full</strong> <strong>Year</strong> <strong>2011</strong> 2,631,231 18.6 79,557 117.1 83,227 108.2 2,184 (90.2)<br />
<strong>Full</strong> <strong>Year</strong> 2010 2,203,807 16.2 36,650 - 39,977 - 22,399 -<br />
Earnings per share Diluted earnings per share<br />
Yen Yen<br />
<strong>Full</strong> <strong>Year</strong> <strong>2011</strong> 5.80 -<br />
<strong>Full</strong> <strong>Year</strong> 2010 59.46 -<br />
(2) Non-consolidated Financial Position<br />
Total assets Net assets<br />
Net assets(excl. minority<br />
interests) to total assets<br />
Net assets (excl. minority<br />
interests) per share<br />
Million Yen Million Yen % Yen<br />
<strong>Full</strong> <strong>Year</strong> <strong>2011</strong> 1,080,445 218,171 20.2 579.18<br />
<strong>Full</strong> <strong>Year</strong> 2010 1,086,829 223,222 20.5 592.59<br />
(Note) Net Assets (excl. minority interests) Dec. <strong>2011</strong> ¥218,171M Dec. 2010 ¥223,222M<br />
2. Forecast <strong>of</strong> Non-consolidated Financial <strong>Results</strong> <strong>for</strong> <strong>Full</strong> <strong>Year</strong> 2012 (from 1 January 2012 to 31 December 2012)<br />
(Note) Percentages represent changes from previous year.<br />
Sales Ordinary income Net income<br />
Earnings per<br />
Share<br />
Million Yen % Million Yen % Million Yen % Yen<br />
Interim 2012 1,220,000 (6.8) 21,000 (72.1) 13,000 (72.9) 34.51<br />
<strong>Full</strong> <strong>Year</strong> 2012 2,450,000 (6.2) 41,000 (50.7) 24,000 998.9 63.71<br />
* Explanation regarding appropriate use <strong>of</strong> the <strong>for</strong>ecast, other special instructions<br />
Figures in the above <strong>for</strong>ecast are based on currently available in<strong>for</strong>mation, and includes various risks and uncertainty. Actual results could<br />
differ from this <strong>for</strong>ecast due to changes in economic conditions, market trends, exchange rate and other factors. Please refer to “Outlook <strong>for</strong><br />
<strong>2011</strong>” on page 4 <strong>for</strong> the details <strong>of</strong> this <strong>for</strong>ecast <strong>of</strong> business per<strong>for</strong>mance.
〔 Supporting material 〕<br />
Contents<br />
1.Business results P.2<br />
(1) Analysis <strong>of</strong> business results P.2<br />
(2) Analysis <strong>of</strong> financial conditions P.5<br />
(3) Basic policy <strong>for</strong> distributions <strong>of</strong> pr<strong>of</strong>its and dividend payments <strong>for</strong> the current period P.6<br />
and next period<br />
2. Scope <strong>of</strong> consolidation and equity associates P.7<br />
3. Management policy P.8<br />
4. <strong>Consolidated</strong> financial statements P.9<br />
(1) <strong>Consolidated</strong> balance sheets P.9<br />
(2) <strong>Consolidated</strong> statement <strong>of</strong> income and <strong>Consolidated</strong> statement <strong>of</strong> comprehensive P.11<br />
income<br />
(3) <strong>Consolidated</strong> statement <strong>of</strong> changes in shareholder’s equity P.14<br />
(4) <strong>Consolidated</strong> statement <strong>of</strong> cash flows P.16<br />
(5) Notes <strong>for</strong> premises <strong>of</strong> going concern P.18<br />
(6) Basis <strong>of</strong> presenting consolidated financial statements P.18<br />
(7) Changes in the basis <strong>of</strong> presenting consolidated financial statements P.23<br />
(8) Notes to consolidated financial statements P.24<br />
Notes to consolidated balance sheet P.24<br />
Notes to consolidated statement <strong>of</strong> comprehensive income P.25<br />
Notes to consolidated statement <strong>of</strong> changes in stockholder’s equity P.25<br />
Notes to consolidated statement <strong>of</strong> cash flows P.26<br />
Segment In<strong>for</strong>mation P.27<br />
In<strong>for</strong>mation on per share data P.29<br />
Significant subsequent event P.29<br />
5. Non-consolidated financial statements P.30<br />
(1) Non-consolidated balance sheets P.30<br />
(2) Non-consolidated statement <strong>of</strong> income P.34<br />
(3) Non-consolidated statement <strong>of</strong> changes in shareholder’s equity P.36<br />
(4) Notes <strong>for</strong> premises <strong>of</strong> going concern P.39<br />
6. Others P.39<br />
(1) Appointment and retirement <strong>of</strong> directors P.39<br />
(2) Others P.39<br />
- 1 -
1.Business <strong>Results</strong><br />
(1) Analysis <strong>of</strong> business results<br />
A. Business results <strong>for</strong> the current period<br />
[Analysis <strong>of</strong> consolidated business results]<br />
For the current fiscal year, the Japanese economy suffered from the continued uncertain outlook as it experienced a rapid<br />
downturn due to effects <strong>of</strong> the Great East Japan Earthquake and, despite production and consumer spending recovery at the<br />
midpoint <strong>of</strong> the year, saw slowing production and export growth in the second half mainly due to the overseas slowdown,<br />
the higher yen, and floods in Thailand.<br />
Dubai crude oil prices started at the 91-dollar per barrel level <strong>for</strong> the current fiscal year. It rose to around 120 dollars at end<br />
<strong>of</strong> April be<strong>for</strong>e sharply declining to the 101-dollar level in May, however it returned to the 110-dollar level in July.<br />
Subsequently, after temporally falling below 100 dollars in October, it turned to an upward trend again and closed at the<br />
105-dollar-per-barrel level <strong>for</strong> the current fiscal year.<br />
The exchange rate <strong>for</strong> Japanese yen to the U.S. dollar started at the 81-yen level <strong>for</strong> the current fiscal year and rapidly rose to<br />
the 76-yen level immediately after the Great East Japan Earthquake. However, it sharply fell into the 85-yen level in April<br />
through coordinated G7 intervention, etc. Then, the yen remained high due to weaker business sentiment in the U.S. and a<br />
resumption <strong>of</strong> the European debt problem, and the rate hit a record high <strong>of</strong> 75.32 yen at the end <strong>of</strong> October. However, it<br />
slightly declined through interventions <strong>of</strong> the government and the BOJ closing at the higher part <strong>of</strong> the 77-yen level <strong>for</strong> the<br />
current fiscal year.<br />
Under such a business environment, our group recorded consolidated sales <strong>of</strong> 2,771.4 billion yen, up 18.1% from the<br />
previous year, mainly due to the effects <strong>of</strong> the higher prices <strong>of</strong> oil products. Looking at pr<strong>of</strong>it and loss, the group posted<br />
consolidated operating income <strong>of</strong> 60.2 billion yen (an increase <strong>of</strong> 23.5 billion yen over the previous year) and consolidated<br />
ordinary pr<strong>of</strong>it <strong>of</strong> 61.8 billion (an increase <strong>of</strong> 19.6 billion yen over the previous year). Contributors to this include increased<br />
demand <strong>for</strong> heating fuels resulting from a cold wave at beginning <strong>of</strong> the year and a recovery in the oil product markets. The<br />
elimination <strong>of</strong> the effects <strong>of</strong> inventory valuation, etc., would result in consolidated ordinary pr<strong>of</strong>it standing at 30.0 billion<br />
yen (a decrease <strong>of</strong> 4.2 million yen over the previous year).<br />
As <strong>for</strong> extraordinary pr<strong>of</strong>it and loss, the group recorded net loss <strong>of</strong> 5.0 billion yen partially because an impairment loss was<br />
recognized <strong>for</strong> some production facilities <strong>of</strong> the solar cell business though a gain on disposal <strong>of</strong> real estate <strong>for</strong> property<br />
letting business was posted. <strong>Consolidated</strong> net income be<strong>for</strong>e taxes stood at 56.7 billion yen (an increase <strong>of</strong> 20.4 billion yen<br />
over the previous year). As a result, consolidated net income after income taxes, income tax adjustments, and minority<br />
interest increased to 23.1 billion yen, an increase <strong>of</strong> 7.1 billion yen over the previous year.<br />
The business results by segment are as follows.<br />
(Billion Yen)<br />
Petroleum Energy<br />
Solution<br />
Others * <strong>Consolidated</strong><br />
Sales 2,695.2 65.7 10.3 2,771.4<br />
Oper ting income/(loss) 87.2 (28.8) 1.9 60.2<br />
*Operating income in “Others” includes the other segment and internal trade.<br />
Income by business segments reported are calculated based on operating income.<br />
- 2 -
[Petroleum business]<br />
In crude oil acquisition, we maintained the relationship with Saudi Aramco as the main supplier, coordinating other Middle<br />
East oil producers and the Shell Group to carry out flexible crude oil acquisition in order to optimize the crude oil mix <strong>for</strong><br />
our refineries.<br />
As <strong>for</strong> production and supply, we ensured safe and stable operations <strong>of</strong> the group refineries while striving <strong>for</strong> further cost<br />
reductions and a higher ratio <strong>of</strong> high-value-added products in production volumes.<br />
For the current fiscal year, we also closed the Ogimachi factory at the Keihin Refinery in September as scheduled in order to<br />
deal with shrinking domestic demand. In relation to this, a terminal was newly constructed in Yokohama <strong>for</strong> the stable<br />
supply <strong>of</strong> asphalt in August. Oil products were flexibly exported to improve utilization rates <strong>of</strong> oil refineries despite a<br />
year-on-year decline resulting from responses to the Great East Japan Earthquake and the closing <strong>of</strong> the Ogimachi factory at<br />
the Keihin Refinery.<br />
As <strong>for</strong> domestic sales, we <strong>of</strong>fered various products and services suited to customer needs in order to attract new customers<br />
and increase repeat customers. For the current fiscal year, RAI-TEN, a coupon delivery service in<strong>for</strong>ming customers <strong>of</strong><br />
useful in<strong>for</strong>mation on gas stations, was launched and the Shell multi-pad, a tablet terminal giving customers simple<br />
explanations <strong>of</strong> products and services optimal to their cars with video, etc., was introduced. We also strived to increase<br />
utilization <strong>of</strong> Ponta, a common point program customers can use at affiliated stores. This resulted in numbers <strong>of</strong> members<br />
and partner companies <strong>of</strong> the point program increasing to about 39 million and 45 at the end <strong>of</strong> December, respectively.<br />
Additionally, the public wireless LAN service S<strong>of</strong>tBank Wi-Fi Spot was further introduced so that customers can spend<br />
waiting time more com<strong>for</strong>tably with the number <strong>of</strong> supported gas stations increasing to 1,428 at the end <strong>of</strong> December.<br />
For the current fiscal year, the special kerosene <strong>for</strong> kerosene fan heaters produced with the Gas to Liquids (GTL)<br />
technology, which permits us to compound liquidity fuels from natural gas, has been renamed “Shell heat clean.” The<br />
product is sold online across the country through home delivery as well as at the counter <strong>of</strong> gas stations. The<br />
over-the-counter sales network has been expanded to about 400 gas stations in 37 prefectures. In the ef<strong>for</strong>t to utilize biomass<br />
fuels, we mix bio ethyl tertiary butyl ether (ETBE) and regular gasoline at the Keihin Refinery <strong>of</strong> TOA Oil Co., Ltd., to ship<br />
the mixed products. It was decided that the mixing would also start at Yokkaichi Refinery <strong>of</strong> Showa Yokkaichi Sekiyu Co.,<br />
Ltd., in 2013.<br />
As a result, with regard to the oil business, sales amounted to 2,695.2 billion yen, an increase <strong>of</strong> 17.0% versus a year ago. As<br />
<strong>for</strong> pr<strong>of</strong>it and loss, we posted an operating income <strong>of</strong> 87.2 billion yen, an increase <strong>of</strong> 41.6 billion yen versus a year ago. The<br />
relevant consolidated ordinary income excluding the effects <strong>of</strong> inventory valuation was 55.4 billion yen, an increase <strong>of</strong> 17.7<br />
billion yen versus a year ago. This figure is the highest ever since 2000, as we adopted current stock valuation method.<br />
[Energy solution businesses]<br />
In the solar cell business, the third Miyazaki plant (Kunitomi plant), which has the largest production capacity in Japan and<br />
one <strong>of</strong> the largest production capacities in the world, started commercial production as scheduled, and all production lines<br />
were launched in July. A system to supply high quality products worldwide has been constructed as the 150-watt CIS thin<br />
film solar cell manufactured at the plant is proud <strong>of</strong> the highest conversion efficiency rate in the world as mass-produced<br />
CIS solar cells.<br />
With regard to sales, we aimed at further penetrating the Solar Frontier brand and actively conducted sales activities in<br />
- 3 -
Japan and abroad with bases being located in Japan, Germany, and the U.S. In Japan, our products were installed in a solar<br />
power generating facility in Tokyo Soramachi®, a commercial facility in Tokyo Sky Tree Town®, a power generating<br />
facility <strong>for</strong> electric vehicles at Nissan global headquarters, and our products were also adopted by the project <strong>for</strong> the<br />
diffusion and promotion <strong>of</strong> solar power generation in Ota City, Gunma Prefecture. Abroad, we have completed several<br />
projects in Europe with Belectric (German-based), the world’s largest system integrator <strong>for</strong> solar power generation, and<br />
expanded sales in the U.S., India, Thailand, and South Africa where demand is growing. At Farasan Island in Saudi Arabia,<br />
the first national commercial solar power plant, which is operated by Saudi Electricity Company, has been constructed and<br />
started generating electricity in July.<br />
As <strong>for</strong> R&D, we promote further technology innovation at the Atsugi Research Center by renewing the world record <strong>for</strong><br />
energy conversion efficiency with a 30 cm square CIS solar cell sub-module.<br />
With regard to the electric power business, Ogimachi Power Station, a high-efficiency natural gas-fired large power station<br />
in which we have equity, ensured continued stable operations by meeting retail electricity demand as well as contributing to<br />
a bridge <strong>for</strong> the gap between electricity supply and demand in the East Japan area by urgently supplying electricity to<br />
general electric utilities.<br />
The Energy Solution business segment, including the above-mentioned activities, reported sales <strong>of</strong> 65.7 billion yen (an<br />
increase <strong>of</strong> 128.0% versus a year ago) and an operating loss <strong>of</strong> 28.8 billion yen (a decrease <strong>of</strong> 17.3 billion yen versus a year<br />
ago).<br />
[Other businesses]<br />
Other business segment, which includes construction, sale <strong>of</strong> automobile accessories, <strong>of</strong>fice building lease business and<br />
other various businesses, reported sales <strong>of</strong> 10.3 billion yen (a decrease <strong>of</strong> 21.7% versus a year ago) and an operating income<br />
<strong>of</strong> 1.9 billion yen (a decrease <strong>of</strong> 0.7 billion yen versus a year ago) <strong>for</strong> the period.<br />
B. Outlook <strong>for</strong> 2012<br />
As <strong>for</strong> the outlook <strong>for</strong> 2012, we expect that the business environment will remain unchanged from the previous year while<br />
anticipating another decrease in demand <strong>for</strong> oil products in Japan. We there<strong>for</strong>e estimate that consolidated net sales will be<br />
2,630.0 billion yen.<br />
Turning to pr<strong>of</strong>it and loss, while we estimate the streamlining effects <strong>of</strong> the Keihin Refinery Ohgimachi Factory closure, we<br />
will encounter the severe market compared to previous year. In the solar cell business in energy solution segment, we<br />
estimate product price will continue to fall, although we will enhance our sales network in Japan, as the introduction <strong>of</strong><br />
“purchase-all program <strong>of</strong> renewable energy” is expected to increase demand, and we will continue stable and efficient<br />
production in our Miyazaki Third (Kunitomi) Plant, which started commercial production last year.<br />
In consideration <strong>of</strong> the above, we estimate that consolidated ordinary income <strong>for</strong> the period will be 30.0 billion yen (41.0<br />
billion yen on a nonconsolidated basis) and consolidated net income <strong>for</strong> the period will be 11.0 billion yen (24.0 billion yen<br />
on a nonconsolidated basis). The above <strong>for</strong>ecast is calculated on the assumption that crude oil price will be 100 dollars per<br />
barrel and that the exchange rate will be 80 yen per dollar, and we will not calculate the effects <strong>of</strong> inventory valuation.<br />
- 4 -
(2) Analysis <strong>of</strong> financial conditions<br />
A. Balance sheet analysis<br />
<strong>Consolidated</strong> total assets as <strong>of</strong> the end <strong>of</strong> the year were 1,280.4 billion yen, an increase <strong>of</strong> 15.2 billion yen compared with the<br />
end <strong>of</strong> the previous year. This was mainly attributable to the increase in accounts receivables and inventories, which were<br />
caused by the hike in crude oil prices. <strong>Consolidated</strong> net assets as <strong>of</strong> the end <strong>of</strong> the year were 279.1 billion yen, an increase <strong>of</strong><br />
16.1 billion yen compared with the end <strong>of</strong> the previous year. This was mainly attributable to positive factors, such as net<br />
income <strong>for</strong> the current year exceeding negative factors like the interim and final dividend.<br />
<strong>Consolidated</strong> total liabilities were 929.2 billion yen, a decrease <strong>of</strong> 0.8 billion yen compared with the end <strong>of</strong> the previous<br />
year. This was chiefly due to decreases in interest-bearing liabilities. Short and long-term interest-bearing liabilities<br />
(borrowings, CP, and bonds) were 278.3 billion yen, a decrease <strong>of</strong> 22.6 billion yen from the end <strong>of</strong> the previous year.<br />
As a result, equity ratio at the end <strong>of</strong> the year was 21.2%. The net assets (excl. minority interests) per share based on the total<br />
number <strong>of</strong> shares issued as <strong>of</strong> the end <strong>of</strong> the year were 679.37 yen, up from 637.78 yen <strong>for</strong> the previous year.<br />
B. Cash flow analysis<br />
The cash and cash equivalents (hereinafter referred to as funds) as <strong>of</strong> the end <strong>of</strong> the year was 14.4 billion yen, a decrease <strong>of</strong><br />
5.2 billion yen from the end <strong>of</strong> the previous year. The details are as follows:<br />
a) Cash flows from operating activities<br />
As a result <strong>of</strong> operating activities, 50.5 billion yen was generated, chiefly attributable to positive factors such as net income<br />
be<strong>for</strong>e income tax (56.7 billion yen).<br />
b) Cash flows from investing activities<br />
As a result <strong>of</strong> investing activities, 24.5 billion yen was used, mainly due to capital investment in fixed assets <strong>for</strong> construction<br />
<strong>of</strong> the Kunitomi Plant (third plant) <strong>of</strong> solar cell business in Energy Solution Businesses.<br />
c) Cash flows from financing activities<br />
As a result <strong>of</strong> financing activities, 31.1 billion yen was used, mainly because negative factors such as decrease in<br />
interest-bearing liabilities and dividend payment.<br />
The Showa Shell Sekiyu Group’s cash flow indicators are summarised as follows.<br />
2007 <strong>Year</strong> end 2008 <strong>Year</strong> end 2009 <strong>Year</strong> end 2010 <strong>Year</strong> end <strong>2011</strong> <strong>Year</strong> end<br />
Equity ratio (%) 25.3 25.4 20.1 20.1 21.2<br />
Market value equity<br />
ratio<br />
Interest-bearing debts /<br />
(%) 34.9 27.3 24.3 23.5 16.2<br />
Cash flow from<br />
operating activities<br />
(Times) 4.1 10.5 - 3.4 5.5<br />
Interest coverage ratio 11.5 5.5 - 24.7 12.4<br />
(Note) Equity ratio: (Net assets – Minority interest) / Total assets<br />
Market value equity ratio: Gross market capitalisation (*1) / Total assets<br />
Interest-bearing debts / Cash flow from operating activities: (*2) / (*3)<br />
Interest coverage ratio: Cash flow from operating activities / Interest payment (*3)<br />
- 5 -
Each indicator is calculated by the numbers in the consolidated financial statements.<br />
(*1) Gross market capitalisation is calculated by multiplying the closing price <strong>of</strong> the Company's shares at the<br />
year-end by the number <strong>of</strong> shares issued and outstanding (excluding treasury shares) at the year-end.<br />
(*2) Debts include all the interest-bearing liabilities in the consolidated balance sheets.<br />
(*3) Cash flow from operating activities is the "cash flow from operating activities" in the consolidated cash flow<br />
statement. Interest payments equate with the amount <strong>of</strong> interest paid in the consolidated cash flow statements.<br />
C. Commitment-line contract<br />
In order to finance working capital efficiently, we concluded commitment-line contracts (credit line amount: 140,000<br />
million yen) with a banking syndicate group and a commitment-line contract (overdraft agreement <strong>for</strong> the current<br />
account/credit line amount: 10,000 million yen) with Mizuho Corporate Bank, Ltd. As <strong>of</strong> the end <strong>of</strong> this year, there is no<br />
outstanding loan balance <strong>for</strong> the contracts above mentioned.<br />
(3) Basic policy <strong>for</strong> distribution <strong>of</strong> pr<strong>of</strong>its and dividend payments <strong>for</strong> the current period and next period<br />
In consideration <strong>of</strong> our business per<strong>for</strong>mance and financial position, as well as <strong>of</strong> the financial market conditions, we make<br />
it a basic policy to realise distribution <strong>of</strong> pr<strong>of</strong>its that are lucrative and stable enough to satisfy shareholders. At the same<br />
time, we strive to attain sufficient retained earnings in order to accomplish our mid-and-long-term growth strategy <strong>for</strong> the<br />
purpose <strong>of</strong> maximising corporate value. In order to do this, our policy is to distribute pr<strong>of</strong>its twice a year, a year-end<br />
dividend (base date: 31 December) based on resolutions approved at meetings <strong>of</strong> the general shareholders and an interim<br />
dividend (base date: 30 June) based on resolutions approved by the board in accordance with the provisions <strong>of</strong> Article 454-5<br />
<strong>of</strong> the Corporate Law.<br />
- 6 -
2. Scope <strong>of</strong> Consolidation and Equity Associates<br />
<strong>Consolidated</strong> subsidiaries <strong>of</strong> Showa Shell Sekiyu (SSSKK) are 34, and equity associates are 13. Our core business is oil business. In<br />
addition we also run energy solution (solar cell and electricity), and other businesses such as property letting, construction, sales <strong>of</strong><br />
motorcar parts and distributed power supply. The following shows the subsidiaries' segment and positioning.<br />
Kinds <strong>of</strong> Business Detail <strong>of</strong> Business <strong>Consolidated</strong> Subsidiaries Equity Associates<br />
Oil Business Exploration & Production (E&P) Shoseki Overseas Oil Development (SODEC)<br />
Oil refining, manufacturing <strong>of</strong> oil products (SSSKK) Nippon Grease Seibu Oil<br />
Toa Oil Shoseki Kako<br />
Showa Yokkaichi Sekiyu (SYS)<br />
Crude & oil products transportation, (SSSKK) Heiwa Kisen Niigata Joint Oil Stockpiling<br />
Stockpiling & Loading Showa Shell Sempaku Japan Oil Network (JONET)<br />
Sale <strong>of</strong> oil products<br />
(SSSKK) Tokyo Shell Pack Marubeni Energy<br />
(gasoline, LPG, kerosene, gas oil, fuel oil, Nippon Grease Sun Road Central Sekiyu Gas<br />
asphalt, lubricants, chemical products etc.) Shoseki Kako Shinyo Sekiyu Shell Sekiyu Osaka Hatsubaisho<br />
Petro Star Kansai Wakamatsu Gas Dia Shoseki<br />
Chuo Shell Sekiyu Hanbai Nissho Koyu Toyotsu Sekiyu Hanbai<br />
Leef Energy Nagase Sekiyu Jyoyo Shell Sekiyu Hanbai<br />
Nakagawa Sekiyu Jonen Mie-seki Shoji<br />
Enessance Holdings Enessance Hokkaido Shell Tokuhatsu<br />
Enessance Touhoku Enessance Niigata<br />
Enessance Kanto Enessance Chubu<br />
Enessance Kyushu Enessance Sapporo<br />
Hakodate Gas<br />
Enessance Service<br />
Enessance Hokkaido Butsuryu<br />
Sales <strong>of</strong> Petrochemicals TS Aromatics<br />
Energy solution Solar cell and electricity (SSSKK) Genex Ogishima Power<br />
Business Solar Frontier<br />
Property letting, Construction, sales <strong>of</strong> (SSSKK) Rising Sun<br />
Other Businesses motor car parts and distributed power<br />
supply, etc.<br />
Shoseki Engineering On-Site Power<br />
- 7(1) -
Petroleum Business<br />
<br />
Showa Yokkaichi Sekiyu (SYS)<br />
Toa Oil *1<br />
Seibu Oil<br />
Nippon Grease<br />
Shoseki Kako<br />
<br />
Showa Shell Sempaku<br />
Heiwa Kisen<br />
Niigata Joint Oil Stockpiling<br />
Japan Oil Network (JONET)<br />
Energy Solution Businesses<br />
Solar Frontier<br />
Genex *2<br />
Ogishima Power<br />
Other Businesses<br />
Rising Sun<br />
Shoseki Engineering<br />
Onsite Power<br />
*1・・・Listed on Tokyo Stock Exchange (second section)<br />
*2・・・<strong>Consolidated</strong> subsidiary <strong>of</strong> Toa<br />
<br />
Shoseki Kako<br />
Leef Energy<br />
Sun Road<br />
Nakagawa Sekiyu<br />
Wakamatsu Gas<br />
Tokyo Shell Pack<br />
Nagase Sekiyu<br />
Enessance Hokkaido<br />
Enessance Touhoku<br />
Enessance Kanto<br />
Enessance Sapporo<br />
Enessance Hokkaido Butsuryu<br />
Dia Shoseki<br />
Central Sekiyu Gas<br />
Jyoyo Shell Sekiyu Hanbai<br />
Marubeni Energy<br />
S S S K K<br />
Crude &oil products<br />
supply<br />
Shell Eastern Trading (PTE) Limited<br />
Saudi Arabian Oil Company<br />
means other related companies and corporate shareholders, in the related parties.<br />
- 7(2) -<br />
Nippon Grease<br />
Petro Star Kansai<br />
Chuo Shell Sekiyu Hanbai<br />
Shinyo Sekiyu<br />
Nissho Koyu<br />
Jonen<br />
Enessance Holdings<br />
Enessance Niigata<br />
Enessance Chubu<br />
Enessance Kyushu<br />
Hakodate Gas<br />
Enessance Service<br />
Shell Sekiyu Osaka Hatsubaisho<br />
Shell Tokuhatsu<br />
Mie-seki Shoji<br />
Toyotsu Sekiyu Hanbai<br />
<br />
TS Aromatics, Shell Chemicals Japan<br />
E & P<br />
Shoseki Overseas Oil Development (SODEC)
3. Management policy<br />
(1) Fundamental policy <strong>of</strong> management, (2) Targeted corporate index and (3) Medium- and long-term<br />
strategies<br />
Disclosure is omitted <strong>for</strong> these items because there isn’t any important change from the Management Policy in<br />
the flash report <strong>of</strong> the previous year released on 16 February 2010.<br />
You can see the flash report <strong>of</strong> the previous year if you click the following URL.<br />
(Showa Shell Sekiyu)<br />
http://www.showa-shell.co.jp/english/ir/index.html<br />
(Tokyo Stock Exchange)<br />
http://www.tse.or.jp/listing/compsearch/index.html<br />
(4) Action measures<br />
In the petroleum business, in order to strengthen our competitiveness in the concentration <strong>of</strong> refining facilities<br />
and achieve optimal operation, we closed our Ogimachi Factory in the Keihin Refinery. By this initiative, we<br />
will boost the capacity utilization rate in our group refineries, and make more efficient production plan. We will<br />
also carry out stable as well as flexible product supply, corresponding supply-demand balance, by utilizing our<br />
domestic sales network and the international trading network <strong>of</strong> the Shell Group. In marketing, in order to<br />
survive in the demand-shrinking domestic market, we must obtain “unparalleled customer satisfaction No. 1”<br />
and we together with our dealers will open the way to the future. We there<strong>for</strong>e, seeing our business through the<br />
eyes <strong>of</strong> customers, will <strong>of</strong>fer differentiated products and services, facilities, training programs and other<br />
measures with a concept stated as “For your Smile & Smart Drive – All is <strong>for</strong> thanks from customers”, pursuing<br />
with our dealers ability to <strong>of</strong>fer value to customers in a timely manner.<br />
In the solar business, future demand is expected to increase continuously, although product price has been<br />
falling globally due to oversupply. We will continue stable and efficient production in our Miyazaki Third<br />
(Kunitomi) Plant, and strengthen our competitiveness by advancing our manufacturing technology further. We<br />
will also enhance our sales network in Japan, as the introduction <strong>of</strong> “purchase-all program <strong>of</strong> renewable energy”<br />
is expected to increase demand.<br />
- 8 -
4. <strong>Consolidated</strong> financial statements<br />
(1) <strong>Consolidated</strong> balance sheet<br />
Previous year end<br />
As <strong>of</strong> 31 Dec. 2010<br />
(Unit:Million Yen)<br />
Current year end<br />
As <strong>of</strong> 31 Dec. <strong>2011</strong><br />
Assets<br />
Current assets<br />
Cash and deposits 20,943 15,562<br />
Notes and accounts receivable-trade 291,104 325,622<br />
Merchandise and finished goods 108,200 143,721<br />
Work in process 1,158 943<br />
Raw materials and supplies 127,032 129,280<br />
Deferred tax assets 18,258 7,322<br />
Other 36,526 37,107<br />
Allowance <strong>for</strong> doubtful accounts (249) (856)<br />
Total current assets 602,975 658,704<br />
Noncurrent assets<br />
Property, plant and equipment<br />
Buildings and structures 320,756 314,271<br />
Accumulated depreciation and impairment loss (214,431) (204,785)<br />
Buildings and structures, net 106,324 109,486<br />
Oil tanks 89,861 84,071<br />
Accumulated depreciation and impairment loss (78,432) (73,179)<br />
Oil tanks, net 11,429 10,892<br />
Machinery, equipment and vehicles 535,602 570,366<br />
Accumulated depreciation and impairment loss (424,600) (403,119)<br />
Machinery, equipment and vehicles, net 111,001 167,247<br />
Land 162,795 158,856<br />
Construction in progress 75,858 1,843<br />
Other 26,354 26,006<br />
Accumulated depreciation and impairment loss (20,044) (19,761)<br />
Other, net 6,310 6,245<br />
Total property, plant and equipment 473,719 454,571<br />
Intangible assets<br />
Goodwill 2,065 1,731<br />
Leasehold right 4,109 4,057<br />
S<strong>of</strong>tware 6,385 4,983<br />
Other 276 259<br />
Total intangible assets 12,836 11,031<br />
Investments and other assets<br />
Investment securities 38,913 38,701<br />
Long-term loans receivable 8,006 6,159<br />
Deferred tax assets 41,129 22,977<br />
Other 16,459 17,047<br />
Allowance <strong>for</strong> doubtful accounts (892) (750)<br />
Total investments and other assets 103,617 84,135<br />
Total noncurrent assets 590,173 549,737<br />
Total assets 1,193,149 1,208,442<br />
- 9 -
Previous year end<br />
As <strong>of</strong> 31 Dec. 2010<br />
(Unit:Million Yen)<br />
Current year end<br />
As <strong>of</strong> 31 Dec. <strong>2011</strong><br />
Liabilities<br />
Current liabilities<br />
Notes and accounts payable-trade 273,531 294,276<br />
Short-term loans payable 40,381 58,340<br />
Current portion <strong>of</strong> bonds 200 ―<br />
Accounts payable-other 185,000 177,452<br />
Income taxes payable 2,151 3,725<br />
Accrued expenses 9,846 10,341<br />
Provision <strong>for</strong> bonuses 2,173 2,359<br />
Provision <strong>for</strong> directors' bonuses 40 32<br />
Commercial papers 115,000 52,000<br />
Other 40,191 39,824<br />
Total current liabilities 668,517 638,351<br />
Noncurrent liabilities<br />
Bonds payable 35,000 35,000<br />
Long-term loans payable 110,470 133,022<br />
Deferred tax liabilities 4,444 3,711<br />
Provision <strong>for</strong> retirement benefits 72,426 75,335<br />
Provision <strong>for</strong> directors' retirement benefits 475 479<br />
Provision <strong>for</strong> special repairs 11,687 16,308<br />
Other 27,122 27,080<br />
Total noncurrent liabilities 261,626 290,938<br />
Total liabilities 930,143 929,290<br />
Net assets<br />
Shareholders' equity<br />
Capital stock 34,197 34,197<br />
Capital surplus 22,113 22,113<br />
Retained earnings 182,959 199,182<br />
Treasury stock (183) (184)<br />
Total shareholders' equity 239,087 255,308<br />
Valuation and translation adjustments<br />
Valuation difference on available-<strong>for</strong>-sale securities 1,117 557<br />
Total valuation and translation adjustments 1,117 557<br />
Minority interests 22,801 23,286<br />
Total net assets 263,006 279,152<br />
Total liabilities and net assets 1,193,149 1,208,442<br />
- 10 -
(2) <strong>Consolidated</strong> statement <strong>of</strong> income and <strong>Consolidated</strong> statement <strong>of</strong> comprehensive income<br />
<strong>Consolidated</strong> statement <strong>of</strong> income<br />
Previous year<br />
(Unit:Million Yen)<br />
Current year<br />
From 1 Jan. 2010<br />
From 1 Jan. <strong>2011</strong><br />
To 31 Dec. 2010<br />
To 31 Dec. <strong>2011</strong><br />
Net sales 2,346,081 2,771,418<br />
Cost <strong>of</strong> sales 2,183,535 2,582,339<br />
Gross pr<strong>of</strong>it<br />
Selling, general and administrative expenses<br />
162,545 189,078<br />
Freightage related expenses 36,007 37,521<br />
Personal expenses 36,595 35,990<br />
Rent expenses 6,392 6,013<br />
Depreciation 6,475 7,274<br />
Other 40,371 41,990<br />
Total selling, general and administrative expenses 125,844 128,790<br />
Operating income<br />
Non-operating income<br />
36,701 60,288<br />
Interest income 230 213<br />
Dividends income 3,628 258<br />
Foreign exchange gains 913 1,507<br />
Amortization <strong>of</strong> negative goodwill 1,363 ―<br />
Equity in earnings <strong>of</strong> affiliates 711 1,804<br />
Gain on investments in silent partnership 1,374 1,472<br />
Other 1,692 1,385<br />
Total non-operating income<br />
Non-operating expenses<br />
9,913 6,642<br />
Interest expenses 2,206 2,423<br />
Sales discounts 1,428 1,700<br />
Other 832 998<br />
Total non-operating expenses 4,467 5,123<br />
Ordinary income<br />
Extraordinary income<br />
42,148 61,807<br />
Gain on sales <strong>of</strong> noncurrent assets 2,488 8,951<br />
Gain on sales <strong>of</strong> investment securities 2,050 284<br />
Reversal <strong>of</strong> provision <strong>for</strong> special repairs 785 62<br />
Subsidy 1,017 3,546<br />
Other 282 1,251<br />
Total extraordinary income 6,624 14,094<br />
- 11 -
Previous year<br />
(Unit:Million Yen)<br />
Current year<br />
From 1 Jan. 2010<br />
From 1 Jan. <strong>2011</strong><br />
To 31 Dec. 2010<br />
To 31 Dec. <strong>2011</strong><br />
Extraordinary loss<br />
Loss on disposal <strong>of</strong> noncurrent assets 3,203 3,210<br />
Loss on sales <strong>of</strong> investment securities 398 ―<br />
Loss on valuation <strong>of</strong> investment securities 156 53<br />
Impairment loss 5,280 11,423<br />
Loss on litigation 1,920 ―<br />
Other 1,555 4,504<br />
Total extraordinary losses 12,515 19,191<br />
Income be<strong>for</strong>e income taxes and minority interests 36,256 56,710<br />
Income taxes-current 2,736 4,136<br />
Income taxes-deferred 16,305 28,445<br />
Total income taxes 19,042 32,581<br />
Income be<strong>for</strong>e minority interests ― 24,129<br />
Minority interests in income 1,257 1,018<br />
Net income 15,956 23,110<br />
- 12 -
<strong>Consolidated</strong> statement <strong>of</strong> comprehensive income<br />
Previous year<br />
From 1 Jan. 2010<br />
To 31 Dec. 2010<br />
(Unit:Million Yen)<br />
Current year<br />
From 1 Jan. <strong>2011</strong><br />
To 31 Dec. <strong>2011</strong><br />
Income be<strong>for</strong>e minority interests<br />
Other comprehensive income<br />
― 24,129<br />
Valuation difference on available-<strong>for</strong>-sale securities ― (477)<br />
Share <strong>of</strong> other comprehensive income <strong>of</strong> associates accounted<br />
<strong>for</strong> using equity method<br />
― (89)<br />
Total other comprehensive income ― (566)<br />
Comprehensive income<br />
Comprehensive income attributable to<br />
― 23,562<br />
Comprehensive income attributable to owners <strong>of</strong> the parent ― 22,549<br />
Comprehensive income attributable to minority interests ― 1,012<br />
- 13 -
(3) <strong>Consolidated</strong> statement <strong>of</strong> changes in shareholders’ equity<br />
Previous year<br />
(Unit:Million Yen)<br />
Current year<br />
From 1 Jan. 2010<br />
From 1 Jan. <strong>2011</strong><br />
To 31 Dec. 2010<br />
To 31 Dec. <strong>2011</strong><br />
Shareholders' equity<br />
Capital stock<br />
Balance at the end <strong>of</strong> previous period<br />
Changes <strong>of</strong> items during the period<br />
34,197 34,197<br />
Total changes <strong>of</strong> items during the period ― ―<br />
Balance at the end <strong>of</strong> current period<br />
Capital surplus<br />
34,197 34,197<br />
Balance at the end <strong>of</strong> previous period<br />
Changes <strong>of</strong> items during the period<br />
22,113 22,113<br />
Disposal <strong>of</strong> treasury stock (0) (0)<br />
Total changes <strong>of</strong> items during the period (0) (0)<br />
Balance at the end <strong>of</strong> current period<br />
Retained earnings<br />
22,113 22,113<br />
Balance at the end <strong>of</strong> previous period<br />
Changes <strong>of</strong> items during the period<br />
177,408 182,959<br />
Dividends from surplus (10,170) (6,780)<br />
Net income 15,956 23,110<br />
Change <strong>of</strong> scope <strong>of</strong> equity method (234) ―<br />
Change <strong>of</strong> scope <strong>of</strong> consolidation ― (107)<br />
Total changes <strong>of</strong> items during the period 5,551 16,222<br />
Balance at the end <strong>of</strong> current period<br />
Treasury stock<br />
182,959 199,182<br />
Balance at the end <strong>of</strong> previous period<br />
Changes <strong>of</strong> items during the period<br />
(181) (183)<br />
Purchase <strong>of</strong> treasury stock (1) (0)<br />
Disposal <strong>of</strong> treasury stock 0 0<br />
Total changes <strong>of</strong> items during the period (1) (0)<br />
Balance at the end <strong>of</strong> current period<br />
Total shareholders' equity<br />
(183) (184)<br />
Balance at the end <strong>of</strong> previous period<br />
Changes <strong>of</strong> items during the period<br />
233,537 239,087<br />
Dividends from surplus (10,170) (6,780)<br />
Net income 15,956 23,110<br />
Purchase <strong>of</strong> treasury stock (1) (0)<br />
Disposal <strong>of</strong> treasury stock 0 0<br />
Change <strong>of</strong> scope <strong>of</strong> equity method (234) ―<br />
Change <strong>of</strong> scope <strong>of</strong> consolidation ― (107)<br />
Total changes <strong>of</strong> items during the period 5,549 16,221<br />
Balance at the end <strong>of</strong> current period 239,087 255,308<br />
- 14 -
Previous year<br />
(Unit:Million Yen)<br />
Current year<br />
From 1 Jan. 2010<br />
From 1 Jan. <strong>2011</strong><br />
To 31 Dec. 2010<br />
To 31 Dec. <strong>2011</strong><br />
Accumulated other comprehensive income<br />
Valuation difference on available-<strong>for</strong>-sale securities<br />
Balance at the end <strong>of</strong> previous period<br />
Changes <strong>of</strong> items during the period<br />
1,979 1,117<br />
Net changes <strong>of</strong> items other than shareholders' equity (861) (560)<br />
Total changes <strong>of</strong> items during the period (861) (560)<br />
Balance at the end <strong>of</strong> current period<br />
Total accumulated other comprehensive income<br />
1,117 557<br />
Balance at the end <strong>of</strong> previous period<br />
Changes <strong>of</strong> items during the period<br />
1,979 1,117<br />
Net changes <strong>of</strong> items other than shareholders' equity (861) (560)<br />
Total changes <strong>of</strong> items during the period (861) (560)<br />
Balance at the end <strong>of</strong> current period<br />
Minority interests<br />
1,117 557<br />
Balance at the end <strong>of</strong> previous period<br />
Changes <strong>of</strong> items during the period<br />
22,206 22,801<br />
Net changes <strong>of</strong> items other than shareholders' equity 594 485<br />
Total changes <strong>of</strong> items during the period 594 485<br />
Balance at the end <strong>of</strong> current period<br />
Total net assets<br />
22,801 23,286<br />
Balance at the end <strong>of</strong> previous period<br />
Changes <strong>of</strong> items during the period<br />
257,723 263,006<br />
Dividends from surplus (10,170) (6,780)<br />
Net income 15,956 23,110<br />
Purchase <strong>of</strong> treasury stock (1) (0)<br />
Disposal <strong>of</strong> treasury stock 0 0<br />
Change <strong>of</strong> scope <strong>of</strong> equity method (234) ―<br />
Change <strong>of</strong> scope <strong>of</strong> consolidation ― (107)<br />
Net changes <strong>of</strong> items other than shareholders' equity (267) (74)<br />
Total changes <strong>of</strong> items during the period 5,282 16,146<br />
Balance at the end <strong>of</strong> current period 263,006 279,152<br />
- 15 -
(4) <strong>Consolidated</strong> statement <strong>of</strong> cash flows<br />
Previous year<br />
(Unit:Million Yen)<br />
Current year<br />
From 1 Jan. 2010<br />
From 1 Jan. <strong>2011</strong><br />
To 31 Dec. 2010<br />
To 31 Dec. <strong>2011</strong><br />
Net cash provided by (used in) operating activities<br />
Income be<strong>for</strong>e income taxes and minority interests 36,256 56,710<br />
Depreciation and amortization 33,949 43,329<br />
Impairment loss 5,280 11,423<br />
Loss (gain) on disposal <strong>of</strong> noncurrent assets 3,203 3,210<br />
Loss (gain) on sales <strong>of</strong> noncurrent assets (2,488) (8,951)<br />
Loss (gain) on valuation <strong>of</strong> investment securities 156 53<br />
Increase (decrease) in allowance <strong>for</strong> doubtful accounts (537) 476<br />
Increase (decrease) in provision <strong>for</strong> retirement benefits 3,509 2,943<br />
Increase (decrease) in provision <strong>for</strong> special repairs (3,935) 4,621<br />
Interest and dividends income (3,859) (472)<br />
Interest expense and sales discount 3,634 4,124<br />
Decrease (increase) in notes and accounts receivable-trade (3,434) (34,817)<br />
Decrease (increase) in inventories 4,421 (37,663)<br />
Increase (decrease) in notes and accounts payable-trade 6,167 22,406<br />
Other, net 10,003 (9,697)<br />
Subtotal 92,327 57,698<br />
Interest and dividends income received 3,849 480<br />
Interest expenses paid (3,635) (4,061)<br />
Income taxes (paid) refund (2,705) (3,565)<br />
Net cash provided by (used in) operating activities<br />
Net cash provided by (used in) investing activities<br />
89,836 50,551<br />
Purchase <strong>of</strong> property, plant and equipment (82,569) (42,900)<br />
Purchase <strong>of</strong> intangible assets (3,320) (2,193)<br />
Proceeds from sales <strong>of</strong> property, plant and equipment 4,020 15,886<br />
Purchase <strong>of</strong> investment securities (380) (8)<br />
Proceeds from sales <strong>of</strong> investment securities 3,325 14<br />
Net decrease (increase) in short-term loans receivable (556) 4,091<br />
Payments <strong>of</strong> long-term loans receivable (2,328) (4)<br />
Collection <strong>of</strong> long-term loans receivable 9 4<br />
Other, net (712) 550<br />
Net cash provided by (used in) investing activities (82,510) (24,560)<br />
- 16 -
Previous year<br />
(Unit:Million Yen)<br />
Current year<br />
From 1 Jan. 2010<br />
From 1 Jan. <strong>2011</strong><br />
To 31 Dec. 2010<br />
To 31 Dec. <strong>2011</strong><br />
Net cash provided by (used in) financing activities<br />
Net increase (decrease) in short-term loans payable (54,539) 8,471<br />
Net increase (decrease) in commercial papers 11,000 (63,000)<br />
Proceeds from long-term loans payable 51,650 35,300<br />
Repayment <strong>of</strong> long-term loans payable (10,131) (3,260)<br />
Proceeds from issuance <strong>of</strong> bonds 20,000 ―<br />
Redemption <strong>of</strong> bonds (15,000) (200)<br />
Purchase <strong>of</strong> treasury stock (1) (0)<br />
Repayments <strong>of</strong> lease obligations (853) (1,165)<br />
Cash dividends paid (10,170) (6,780)<br />
Cash dividends paid to minority shareholders (623) (544)<br />
Other, net 0 20<br />
Net cash provided by (used in) financing activities (8,671) (31,159)<br />
Net increase (decrease) in cash and cash equivalents (1,346) (5,168)<br />
Cash and cash equivalents at beginning <strong>of</strong> period 21,030 19,746<br />
Increase (decrease) in cash and cash equivalents resulting from<br />
merger <strong>of</strong> subsidiaries<br />
62 ―<br />
Decrease in cash and cash equivalents resulting from exclusion <strong>of</strong><br />
subsidiaries from consolidation<br />
― (111)<br />
Cash and cash equivalents at end <strong>of</strong> period 19,746 14,466<br />
- 17 -
(5) Notes <strong>for</strong> premises <strong>of</strong> going concern<br />
Not applicable<br />
(6) Basis <strong>of</strong> presenting consolidated financial statements<br />
Previous <strong>Year</strong> Current <strong>Year</strong><br />
Item<br />
(From 1 Jan. 2010 (From 1 Jan. <strong>2011</strong><br />
To 31 Dec. 2010) To 31 Dec. <strong>2011</strong>)<br />
1. Scope <strong>of</strong> consolidation<br />
1. <strong>Consolidated</strong> Subsidiaries 36 1. <strong>Consolidated</strong> Subsidiaries 34<br />
Showa Yokkaichi Sekiyu, Toa Oil,<br />
Showa Shell Sempaku, Heiwa Kisen,<br />
Shoseki Overseas Oil Development,<br />
Shoseki Engineering, Nippon Grease,<br />
Shoseki Kako, Rising Sun, Sun Road,<br />
Chuo Shell Sekiyu Hanbai, Leef<br />
Energy, Shinyo Sekiyu, Tokyo Shell<br />
Pack, Nakagawa Sekiyu, Petro Star<br />
Kansai, Wakamatsu Gas, Genex,<br />
Marushin, On-Site Power, Nissho<br />
Koyu, Solar Frontier, Nagase Sekiyu,<br />
Jonen, Enessance Holdings,<br />
Other 11 companies<br />
Central Energy was merged with<br />
Petrostar Kansai. Petro Star Kanto and<br />
Hayawa, non-consolidated subsidiary,<br />
were merged with Chuo Shell Sekiyu<br />
Hanbai. Showa Shell Solar has<br />
changed its name to Solar Frontier, and<br />
Kanto Koyu Energy has changed its<br />
name to Leef Energy.<br />
Showa Yokkaichi Sekiyu, Toa Oil,<br />
Showa Shell Sempaku, Heiwa Kisen,<br />
Shoseki Overseas Oil Development,<br />
Shoseki Engineering, Nippon Grease,<br />
Shoseki Kako, Rising Sun, Sun Road,<br />
Chuo Shell Sekiyu Hanbai, Leef<br />
Energy, Shinyo Sekiyu, Tokyo Shell<br />
Pack, Nakagawa Sekiyu, Petro Star<br />
Kansai, Wakamatsu Gas, Genex, On-<br />
Site Power, Nissho Koyu, Solar<br />
Frontier, Nagase Sekiyu, Jonen,<br />
Enessance Holdings,<br />
Other 10 companies<br />
The number <strong>of</strong> consolidated<br />
subsidiaries has decreased because<br />
Marushin disposed <strong>of</strong> its main<br />
business, and Marushin became to<br />
have no importance.<br />
The stock <strong>of</strong> Enessance Toyama was<br />
transferred to the third party and<br />
Enessance Toyama became not to be<br />
the affiliated company.<br />
2. Primary Nonconsolidated<br />
2. Primary Nonconsolidated<br />
Subsidiaries<br />
Subsidiaries<br />
Watani Energy Watani Energy<br />
(Reasons <strong>for</strong> removing the scope) (Reasons <strong>for</strong> removing the scope)<br />
These companies are excluded from<br />
consolidation because their influence is<br />
immaterial to the consolidated financial<br />
statements.<br />
Ditto<br />
2. Scope <strong>of</strong> equity<br />
1. Equity-method Affiliates 13 1. Equity-method Affiliates 13<br />
associates Seibu Oil, Dia Shoseki, Shell Sekiyu Seibu Oil, Dia Shoseki, Shell Sekiyu<br />
Osaka Hatsubaisho, Central Sekiyu Osaka Hatsubaisho, Central Sekiyu<br />
Gas, Mie-seki shoji, Niigata Joint Oil Gas, Mie-seki shoji, Niigata Joint Oil<br />
Stockpiling, Shell Tokuhatsu, JONET, Stockpiling, Shell Tokuhatsu, JONET,<br />
Jyoyo Shell Sekiyu hanbai, Marubeni Jyoyo Shell Sekiyu hanbai, Marubeni<br />
Energy, Toyotsu Sekihan, TS<br />
Energy, Toyotsu Sekihan, TS<br />
Aromatics , Ogishima Power<br />
Ogishima Power has included in the<br />
scope <strong>of</strong> equity-method affiliates as <strong>of</strong><br />
this financial year because <strong>of</strong> increased<br />
materiality.<br />
Aromatics , Ogishima Power<br />
2. Other Main Affiliates 2. Other Main Affiliates<br />
Kyoudou Gas<br />
Kyoudou Gas<br />
Those companies are excluded from<br />
the consolidated financial statements<br />
because their influence is immaterial.<br />
Ditto<br />
- 18 -
Item<br />
3. Account closing date <strong>of</strong><br />
consolidated subsidiaries<br />
4. Important accounting<br />
standards<br />
1) Valuation method <strong>for</strong><br />
major assets<br />
Securities Other Securities<br />
Previous <strong>Year</strong> Current <strong>Year</strong><br />
(From 1 Jan. 2010 (From 1 Jan. <strong>2011</strong><br />
To 31 Dec. 2010) To 31 Dec. <strong>2011</strong>)<br />
3. When the account closing dates <strong>of</strong><br />
the equity-method affiliates are<br />
different from SSSKK account closing<br />
date, the financial statements <strong>of</strong> those<br />
companies <strong>of</strong> their own account<br />
closing date are adopted.<br />
3. Ditto<br />
(Change in accounting policy)<br />
From current fiscal year, the Group<br />
applies the “Accounting Standard <strong>for</strong><br />
Equity Method <strong>of</strong> Accounting <strong>for</strong><br />
Investment” (ASBJ Statement No. 16<br />
<strong>of</strong> March 10, 2008) and the “Practical<br />
Solution on Unification <strong>of</strong> Accounting<br />
Policies Applied to Associates<br />
Accounted <strong>for</strong> Using the Equity<br />
Method” (ASBJ PITF No. 24 <strong>of</strong> March<br />
10, 2008).There is no impact on the<br />
Group’s consolidated financial<br />
statements <strong>for</strong> the year as a result <strong>of</strong><br />
this change.<br />
Account closing dates <strong>of</strong> the<br />
consolidated subsidiaries are as<br />
follows.<br />
30 September 8 subsidiary<br />
31 October 1<br />
31 December 27<br />
The consolidated financial statements<br />
incorporated its accounts and the other<br />
subsidiaries accounts <strong>of</strong> their accounts<br />
closing dates, with adjustments <strong>for</strong><br />
significant trades occurring after the<br />
accounts closed.<br />
Securities with market value<br />
Stated at market value as <strong>of</strong> account<br />
closing<br />
(Any valuation differences are<br />
directly charged or credited to<br />
shareholders’ equity, and cost <strong>of</strong><br />
securities sold is calculated primarily<br />
by the moving average method.)<br />
Account closing dates <strong>of</strong> the<br />
consolidated subsidiaries are as<br />
follows.<br />
30 September 7 subsidiary<br />
31 October 1<br />
31 December 26<br />
The consolidated financial statements<br />
incorporated its accounts and the other<br />
subsidiaries accounts <strong>of</strong> their accounts<br />
closing dates, with adjustments <strong>for</strong><br />
significant trades occurring after the<br />
accounts closed.<br />
Other Securities<br />
Securities with market value<br />
Ditto<br />
Securities with no market value Securities with no market value<br />
Stated at historical cost based on the<br />
moving average method<br />
Ditto<br />
Derivatives Stated at market value<br />
Ditto<br />
- 19 -
Previous <strong>Year</strong> Current <strong>Year</strong><br />
Item<br />
(From 1 Jan. 2010 (From 1 Jan. <strong>2011</strong><br />
To 31 Dec. 2010) To 31 Dec. <strong>2011</strong>)<br />
Inventories Stated at historical cost mainly based<br />
on the weighted average method<br />
(Values on the balance sheet are subject<br />
to the book value reduction method<br />
based on decreased pr<strong>of</strong>itability.)<br />
Ditto<br />
2) Depreciation 1. Tangible Fixed Assets<br />
1. Tangible Fixed Assets<br />
(Excluding lease asset)<br />
(Excluding lease asset)<br />
Straight-line method<br />
The same standard as stipulated in the<br />
Corporate Tax Law is applied to the<br />
useful economic lives and the residual<br />
values.<br />
The main refining facilities at the<br />
Ogimachi Factory <strong>of</strong> the Keihin<br />
Refinery <strong>of</strong> SSSKK and the<br />
Yokkaichi Refinery <strong>of</strong> Showa<br />
Yokkaichi Sekiyu are depreciated<br />
with an estimated useful economic<br />
life <strong>of</strong> 20 years.<br />
Ditto<br />
2. Intangible Fixed Assets<br />
2. Intangible Fixed Assets<br />
(Excluding lease asset)<br />
(Excluding lease asset)<br />
Straight-line method<br />
S<strong>of</strong>tware <strong>for</strong> own use is amortised<br />
based on the straight-line method over<br />
an expected useful economic life <strong>of</strong> 5<br />
years.<br />
Ditto<br />
3. Lease Assets<br />
3. Lease Assets<br />
Finance lease transaction <strong>for</strong> which<br />
ownership <strong>of</strong> the leased assets is not<br />
considered to transfer to leasees<br />
(hereinafter “ownership non-transfer<br />
finance lease”)<br />
With regard to the depreciation method<br />
<strong>of</strong> leased assets, the straight-line<br />
method is applied where the lease<br />
period is taken as useful economic life<br />
and the residual value is zero.<br />
Ownership non-transfer finance lease<br />
transactions, where the start-up dates<br />
are prior to the beginning <strong>of</strong> the current<br />
financial year (prior to 31 December<br />
2009), continue to be accounted by the<br />
accounting method in con<strong>for</strong>mity with<br />
the method <strong>of</strong> operating lease<br />
transactions.<br />
Ditto<br />
3) Basis <strong>of</strong> provisions<br />
Doubtful debts For doubtful debts, provisions are<br />
calculated individually based on the<br />
estimated uncollectible amounts. For<br />
other debts, provisions are calculated<br />
based on the actual ratio <strong>of</strong> the past<br />
doubtful debt losses.<br />
Ditto<br />
- 20 -
Previous <strong>Year</strong> Current <strong>Year</strong><br />
Item<br />
(From 1 Jan. 2010 (From 1 Jan. <strong>2011</strong><br />
To 31 Dec. 2010) To 31 Dec. <strong>2011</strong>)<br />
Employees’ bonuses Accrued bonuses <strong>for</strong> the current<br />
financial year are provided based on<br />
the estimated bonuses to be paid in the<br />
following year.<br />
Ditto<br />
Directors’ bonuses For directors’ bonuses, provisions are<br />
calculated based on the estimated<br />
bonuses to be paid in the following<br />
year.<br />
Ditto<br />
Retirement benefits Accrued retirement benefits are<br />
provided based on the estimated PBO<br />
and pension assets as at the current<br />
financial year-end. Actuarial<br />
differences are amortised evenly<br />
within the following 10-14 years,<br />
which is the average number <strong>of</strong><br />
remaining service years <strong>of</strong> employees.<br />
The past service liabilities are<br />
amortised evenly within 10-14 years,<br />
which was the average number <strong>of</strong><br />
remaining service years <strong>of</strong> employees<br />
at the time the liabilities arise.<br />
Differences due to changes in the<br />
accounting standards are amortised<br />
evenly over the following 15 years,<br />
which was the average number <strong>of</strong><br />
remaining service years <strong>of</strong> employees<br />
at that time.<br />
Ditto<br />
Directors’ retirement Estimated retirement benefits <strong>for</strong><br />
Ditto<br />
benefits<br />
directors <strong>for</strong> the current financial year<br />
are provided based on the internal<br />
rules <strong>of</strong> some consolidated<br />
subsidiaries.<br />
Special maintenance The company is required to have<br />
periodical inspections and repairs <strong>for</strong><br />
oil tanks under the Fire Defense Law.<br />
The company is also carrying out<br />
periodical repairs <strong>of</strong> machinery at oil<br />
refineries. Estimated accrued expenses<br />
<strong>for</strong> these inspections and repairs are<br />
provided <strong>for</strong>.<br />
Ditto<br />
4) Hedge accounting Hedge accounting is not adopted. Ditto<br />
5) Amortisation <strong>of</strong> goodwill<br />
Goodwill are amortised over a period<br />
and negative goodwill<br />
not exceeding 20 years, determined in<br />
consideration <strong>of</strong> the source <strong>of</strong><br />
goodwill. When the amount <strong>of</strong><br />
goodwill is small, they are expensed in<br />
the year it arises.<br />
6) Scope <strong>of</strong> funds in the<br />
The funds (cash or cash equivalents) in<br />
consolidated cash flow<br />
the consolidated cash flow statement<br />
statement<br />
consists <strong>of</strong> cash-in-hand, deposits<br />
readily convertible into cash, and<br />
short-term investments with low risk<br />
<strong>of</strong> price fluctuations and with a<br />
maturity <strong>of</strong> 3 months or less at the<br />
time <strong>of</strong> acquisition.<br />
- 21 -
Item<br />
7) Accounting <strong>for</strong><br />
consumption tax<br />
5. Valuation method <strong>for</strong><br />
assets and liabilities <strong>of</strong><br />
subsidiaries<br />
6. Amortisation <strong>of</strong> goodwill<br />
and negative goodwill<br />
7. Scope <strong>of</strong> funds in the<br />
consolidated cash flow<br />
statement<br />
Previous <strong>Year</strong> Current <strong>Year</strong><br />
(From 1 Jan. 2010 (From 1 Jan. <strong>2011</strong><br />
To 31 Dec. 2010) To 31 Dec. <strong>2011</strong>)<br />
The net <strong>of</strong> tax method is adopted <strong>for</strong><br />
the Consumption Tax treatment<br />
Mark-to-market valuation method is<br />
applied to all the assets and liabilities<br />
<strong>of</strong> consolidated subsidiaries.<br />
Goodwill and negative goodwill are<br />
amortised over a period not exceeding<br />
20 years, determined in consideration<br />
<strong>of</strong> the source <strong>of</strong> goodwill. When the<br />
amount <strong>of</strong> goodwill or negative<br />
goodwill is small, they are expensed in<br />
the year it arises.<br />
(Additional in<strong>for</strong>mation)<br />
A consolidated subsidiary has been<br />
proceeding preparation <strong>for</strong> its business<br />
disposal. Negative goodwill regarding<br />
the business, which has been amortized<br />
evenly, was amortized at once in this<br />
year because the disposal was deemed<br />
to complete substantially.<br />
The funds (cash or cash equivalents) in<br />
the consolidated cash flow statement<br />
consists <strong>of</strong> cash-in-hand, deposits<br />
readily convertible into cash, and shortterm<br />
investments with low risk <strong>of</strong> price<br />
fluctuations and with a maturity <strong>of</strong> 3<br />
months or less at the time <strong>of</strong><br />
acquisition.<br />
Ditto<br />
- 22 -
(7) Changes in the basis <strong>of</strong> presenting consolidated financial statements<br />
Previous <strong>Year</strong> Current <strong>Year</strong><br />
(From 1 Jan. 2010 (From 1 Jan. <strong>2011</strong><br />
To 31 Dec. 2010) To 31 Dec. <strong>2011</strong>)<br />
(Change <strong>of</strong> accounting policy)<br />
Regarding the standard <strong>for</strong> recording income from<br />
contract work, the percentage <strong>of</strong> the completion<br />
method had been applied to construction projects<br />
worth 5 billion yen or more with a construction period<br />
<strong>of</strong> more than one year and the completed contract<br />
method had been applied to other construction<br />
projects. The Group applied the Accounting Standards<br />
<strong>for</strong> Construction Contracts (Accounting Standards<br />
Board <strong>of</strong> Japan (ASBJ) Statement No. 15, December<br />
27, 2007) and the Implementation Guidance on<br />
Accounting Standards <strong>for</strong> Construction Contracts<br />
(Implementation Guidance <strong>of</strong> ASBJ Statement No. 18,<br />
December 27, 2007) in the current consolidated<br />
financial year. From construction contracts started<br />
during the current consolidated financial year, the<br />
percentage <strong>of</strong> the completion method (cost related<br />
method <strong>for</strong> estimation <strong>of</strong> complete percentage) is<br />
applied to construction projects recognized to hold<br />
certainty <strong>of</strong> outcomes <strong>for</strong> the portion completed by the<br />
end <strong>of</strong> the period and the completed contract method is<br />
applied to other construction projects. The change<br />
caused an increase <strong>of</strong> 441 million yen in net sales, and<br />
an increase <strong>of</strong> 44 million yen in operating income,<br />
ordinary income, and net income be<strong>for</strong>e taxes,<br />
compared with the previous method. The effects on<br />
segment in<strong>for</strong>mation are described in the<br />
corresponding areas.<br />
(Change <strong>of</strong> accounting policy)<br />
Some consolidated subsidiaries, which had adopted the<br />
declining balance method <strong>for</strong> tangible fixed assets,<br />
changed the depreciation method to the straight-line<br />
method in the current consolidated financial year. The<br />
change was implemented because the straight-line<br />
method is a more rational depreciation method to further<br />
improve the appropriateness <strong>of</strong> periodical accounting <strong>of</strong><br />
pr<strong>of</strong>it and loss. It was a result <strong>of</strong> re-examination<br />
regarding the investment purposes and the use <strong>of</strong><br />
refineries held by the consolidated subsidiaries, given<br />
the change in economic environment <strong>for</strong> the oil<br />
industry. The change caused an increase <strong>of</strong> 1,995<br />
million yen in operating income and ordinary income,<br />
and an increase <strong>of</strong> 1,990 million yen in net income<br />
be<strong>for</strong>e taxes, compared with the previous method. The<br />
effects on segment in<strong>for</strong>mation are described in the<br />
corresponding areas.<br />
- 23 -<br />
(Change <strong>of</strong> accounting policy)<br />
From the current consolidated financial year,<br />
“Accounting Standards <strong>for</strong> Asset Retirement<br />
Obligations” (Accounting Standards Board <strong>of</strong> Japan<br />
[ASBJ] Statement No. 18, March 31, 2008) and<br />
“Guidance on Accounting Standards <strong>for</strong> Asset<br />
Retirement Obligations” (ASBJ Guidance No. 21,<br />
March 31, 2008) have been applied. As a result,<br />
operating income and ordinary income each declined<br />
by 141 million yen, and income be<strong>for</strong>e income taxes<br />
and minority interests declined by 1,922 million yen.<br />
(Additional in<strong>for</strong>mation)<br />
Based on the “Accounting Standard <strong>for</strong> <strong>Consolidated</strong><br />
Financial Statements” (ASBJ Statement No. 22 <strong>of</strong><br />
December 26, 2008), the Group applies the “Cabinet<br />
Office Ordinance Partially Revising Regulation on<br />
Terminology, Forms and Preparation <strong>of</strong> Financial<br />
Statements” (Cabinet Office Ordinance No.5, March<br />
24, 2009). As a result, “Income be<strong>for</strong>e minority<br />
interests” is included in the consolidated financial<br />
statements in the current consolidated financial year.
(8) Notes to consolidated financial statements<br />
(Notes to the consolidated balance sheet)<br />
Previous <strong>Year</strong> End<br />
(As <strong>of</strong> 31 Dec. 2010)<br />
1. Collateral assets&Secured debts<br />
Details <strong>of</strong> collateral assets are as follows.<br />
(Unit : Million Yen)<br />
Current <strong>Year</strong> End<br />
(As <strong>of</strong> 31 Dec. <strong>2011</strong>)<br />
1. Collateral assets&Secured debts<br />
Details <strong>of</strong> collateral assets are as follows.<br />
Cash & Deposits 3,608 [-] Cash & Deposits 4,751 [-]<br />
Notes & Account<br />
receivable<br />
1,320 [-]<br />
Notes & Account<br />
receivable<br />
1,314 [-]<br />
Inventories 78 [-] Inventories 75 [-]<br />
Buildings & Structures 19,724 [19,173] Buildings & Structures 14,917 [14,557]<br />
Tanks 5,562 [5,562] Tanks 4,442 [4,442]<br />
Machinery & Equipment 81,540 [81,540]<br />
Machinery &<br />
Equipment<br />
60,447 [60,447]<br />
Lands 42,766 [33,802] Lands 21,597 [ 6,081]<br />
Others 1 [1] Others 0 [0]<br />
Total 154,604 [140,080] Total 107,547 [ 85,530]<br />
Details <strong>of</strong> secured debts are as follows. Details <strong>of</strong> secured debts are as follows.<br />
Long-term debts 7,360 [6,607] Long-term debts 6,872 [6,607]<br />
Short-term debts 3,798 [1,563] Short-term debts 1,604 [-]<br />
Accounts payable 59,102 [-] Accounts payable 68,962 [27,414]<br />
Total 70,261 [ 8,170] Total 77,440 [34,201]<br />
In addition, assets below listed are pledged as<br />
collateral <strong>for</strong> the borrowing <strong>of</strong> Genex, which is a<br />
consolidated subsidiary.<br />
In addition, assets below listed are pledged as<br />
collateral <strong>for</strong> the borrowing <strong>of</strong> Genex, which is<br />
a consolidated subsidiary.<br />
Shares <strong>of</strong> Genex 1,680 Shares <strong>of</strong> Genex 1,680<br />
Long-term loans to Genex 2,520 Long-term loans to Genex 2,520<br />
2. Contingent liabilities 2. Contingent liabilities<br />
1) Guarantees <strong>for</strong> borrowings <strong>of</strong> companies that are 1) Guarantees <strong>for</strong> borrowings <strong>of</strong> companies that are<br />
not consolidated subsidiaries<br />
not consolidated subsidiaries<br />
Japan Bi<strong>of</strong>uels Supply LLP 2,824 Japan Bi<strong>of</strong>uels Supply LLP 3,482<br />
JONET 250 JLS etc. 13<br />
JLS etc. 16 Total 3,495<br />
Total 3,090<br />
2) Guarantees <strong>for</strong> employees housing loan 2) Guarantees <strong>for</strong> employees housing loan<br />
821 748<br />
- 24 -
(Notes to the consolidated statement <strong>of</strong> comprehensive income)<br />
(Unit: Million Yen)<br />
Current year (From 1 January <strong>2011</strong> to 31 December <strong>2011</strong>)<br />
1. Comprehensive income <strong>for</strong> the year ended 31 December 2010<br />
Comprehensive income attributable to parent company 15,094<br />
Comprehensive income attributable to minority interest 1,227<br />
Total 16,322<br />
2. Other comprehensive income <strong>for</strong> the year ended 31 December 2010<br />
Valuation difference <strong>for</strong> available-<strong>for</strong>-sale securities (856)<br />
Share <strong>of</strong> other comprehensive income <strong>of</strong> associates<br />
accounted<strong>for</strong> using equity method<br />
(35)<br />
Total (892)<br />
(Note to the consolidated statement <strong>of</strong> changes in shareholders’ equity)<br />
Previous year (From 1 January 2010 to 31 December 2010)<br />
(A) Issued shares<br />
End <strong>of</strong> Dec. 2009 Increase Decrease End <strong>of</strong> Dec. 2010<br />
Common shares 376,850,400 - - 376,850,400<br />
(Note)<br />
Number <strong>of</strong> shares has not been changed.<br />
(B) Treasury shares<br />
End <strong>of</strong> Dec. 2009 Increase Decrease End <strong>of</strong> Dec. 2010<br />
Common shares<br />
(Note)<br />
222,736 2,703 230 225,209<br />
Increase in purchase <strong>of</strong> odd shares, etc. 2,703 shares<br />
Decrease in sales <strong>of</strong> odd shares 230 shares<br />
(C) Dividends<br />
1. Dividends paid<br />
Resolution<br />
The annual<br />
shareholders’<br />
meeting on<br />
30 March 2010<br />
The directors’<br />
meeting on<br />
5 August 2010<br />
Class <strong>of</strong><br />
shares<br />
Common<br />
shares<br />
Common<br />
shares<br />
Total amount <strong>of</strong><br />
dividends (Million Yen)<br />
2. Dividends planned to be paid after this period end<br />
Resolution<br />
The annual<br />
shareholders’<br />
meeting on<br />
30 March <strong>2011</strong><br />
Class <strong>of</strong><br />
shares<br />
Common<br />
shares<br />
Resource <strong>of</strong><br />
dividend<br />
Retained<br />
earnings<br />
Dividend per<br />
share (Yen)<br />
Record date Payment date<br />
6,780 18.00 31 December 2009 31 March 2010<br />
3,390 9.00 30 June 2010<br />
Total amount <strong>of</strong><br />
dividends<br />
(Million Yen)<br />
Dividend per<br />
share<br />
(Yen)<br />
8 September<br />
2010<br />
Record date Payment date<br />
3,390 9.00 31 December 2010 31 March <strong>2011</strong><br />
- 25 -
Current year (From 1 January <strong>2011</strong> to 31 December <strong>2011</strong>)<br />
(A) Issued shares<br />
End <strong>of</strong> Dec. 2010 Increase Decrease End <strong>of</strong> Dec. <strong>2011</strong><br />
Common shares 376,850,400 - - 376,850,400<br />
(Note)<br />
Number <strong>of</strong> shares has not been changed.<br />
(B) Treasury shares<br />
End <strong>of</strong> Dec. 2010 Increase Decrease End <strong>of</strong> Dec. <strong>2011</strong><br />
Common shares<br />
(Note)<br />
225,209 1,184 94 226,299<br />
Increase in purchase <strong>of</strong> odd shares, etc. 1,184 shares<br />
Decrease in sales <strong>of</strong> odd shares 94 shares<br />
(C) Dividends<br />
1. Dividends paid<br />
Resolution<br />
The annual<br />
shareholders’<br />
meeting on<br />
30 March <strong>2011</strong><br />
The directors’<br />
meeting on<br />
4 August <strong>2011</strong><br />
Class <strong>of</strong><br />
shares<br />
Common<br />
shares<br />
Common<br />
shares<br />
Total amount <strong>of</strong><br />
dividends (Million Yen)<br />
2. Dividends planned to be paid after this period end<br />
Resolution<br />
The annual<br />
shareholders’<br />
meeting on<br />
29 March 2012<br />
Class <strong>of</strong><br />
shares<br />
Common<br />
shares<br />
Resource <strong>of</strong><br />
dividend<br />
Retained<br />
earnings<br />
Dividend per<br />
share (Yen)<br />
Record date Payment date<br />
3,390 9.00 31 December 2010 31 March <strong>2011</strong><br />
3,390 9.00 30 June <strong>2011</strong><br />
Total amount <strong>of</strong><br />
dividends<br />
(Million Yen)<br />
Dividend per<br />
share<br />
(Yen)<br />
7 September<br />
<strong>2011</strong><br />
Record date Payment date<br />
3,390 9.00 31 December <strong>2011</strong> 30 March 2012<br />
(Note to the consolidated cash flows)<br />
Previous <strong>Year</strong><br />
(Unit: Million Yen)<br />
Current <strong>Year</strong><br />
(From 1 Jan. 2010 (From 1 Jan. <strong>2011</strong><br />
To 31 Dec. 2010) To 31 Dec. <strong>2011</strong>)<br />
1. Reconciliation between “Cash & cash equivalent” in 1. Reconciliation between “Cash & cash equivalent” in<br />
the consolidated cash flow statement and those in the the consolidated cash flow statement and those in the<br />
consolidated balance sheet<br />
consolidated balance sheet<br />
(31 Dec. 2010) (31 Dec. <strong>2011</strong>)<br />
1 Cash and Deposit 20,943 1 Cash and Deposit 15,562<br />
2 Time deposit exceeding 3<br />
months<br />
(1,197)<br />
2 Time deposit exceeding 3<br />
months<br />
(1,095)<br />
Cash & cash equivalent 19,746 Cash & cash equivalent 14,466<br />
- 26 -
(Segment In<strong>for</strong>mation)<br />
1. Outline <strong>of</strong> business segments reported<br />
Segregated financial statements <strong>for</strong> the Group’s reporting segments out <strong>of</strong> our structural units are available. The board <strong>of</strong><br />
directors regularly reviews the statements to determine the distribution <strong>of</strong> management resources and evaluate financial<br />
results.<br />
The Group mainly manufactures and sells oil products and energy related products, such as solar cell products and<br />
electricity. The Company and consolidated subsidiaries separately draft comprehensive strategies and conduct business<br />
activities <strong>for</strong> products and services they handle as individual management units.<br />
The Group there<strong>for</strong>e consists <strong>of</strong> segments sorted by products and services that each segment handles and thus the Group<br />
designates two segments: the oil business and the energy solution business as reporting segments. And the businesses<br />
which are not included in reporting segments are aggregated in Others.<br />
The Oil business segment manufactures and sells oil products, such as gasoline, naphtha, kerosene, diesel oil, fuel oil,<br />
lubricants, LPG, bitumen, and chemicals. The Energy solution business segment manufactures and sells solar cell<br />
modules and electricity.<br />
2. Method <strong>of</strong> calculating sales and income (loss), identifiable assets, and other items by business<br />
segment reported<br />
Accounting method <strong>for</strong> business segment reported is the same as presentations on “Basis <strong>of</strong> presenting consolidated financial<br />
statements.”<br />
Income by business segments reported are calculated based on operating income.<br />
3. In<strong>for</strong>mation on sales and income (loss) by business segment reported<br />
<strong>Year</strong> to date <strong>of</strong> 2010 (From 1 January to 31 December 2010)<br />
Sales<br />
Oil business<br />
Energy<br />
Solution<br />
Business<br />
Subtotal Others Total Adjustment<br />
(Unit: Million Yen)<br />
<strong>Consolidated</strong><br />
(1) Sales to customers 2,304,019 28,863 2,332,882 13,198 2,346,081 - 2,346,081<br />
(2) Inter-segment sales and<br />
transfers<br />
2,268 4,554 6,822 3,448 10,271 (10,271) -<br />
Total 2,306,287 33,418 2,339,705 16,647 2,356,352 (10,271) 2,346,081<br />
Operating<br />
Income/(loss)<br />
45,569 (11,581) 33,987 2,718 36,705 (4) 36,701<br />
Other items<br />
Assets 1,031,598 133,625 1,165,223 42,917 1,208,141 (14,992) 1,193,149<br />
Depreciation expense 28,216 4,963 33,180 768 33,949 - 33,949<br />
Amortization <strong>of</strong><br />
Goodwill<br />
Equity in net earnings<br />
<strong>of</strong> affiliates<br />
510 (28) 481 (1,844) (1,363) - (1,363)<br />
720 (8) 711 - 711 - 711<br />
Impairment loss 3,075 2,205 5,280 - 5,280 - 5,280<br />
Unamortized amount <strong>of</strong><br />
Goodwill<br />
234 (144) 90 - 90 - 90<br />
Capital Expenditures 21,823 63,735 85,559 60 85,620 - 85,620<br />
- 27 -
Notes: 1. The “Others” category incorporates operations not included in business segments reported, including leasing and<br />
administration <strong>of</strong> properties, construction works, sale and lease <strong>of</strong> auto accessories etc.<br />
2. Adjustment <strong>of</strong> operating income (loss) refers to elimination <strong>of</strong> intersegment transactions.<br />
3. Operating income (loss) <strong>for</strong> segment is adjusted on operating income on the consolidated statements <strong>of</strong> income <strong>for</strong><br />
the year to date <strong>of</strong> the current consolidated financial year.<br />
<strong>Year</strong> to date <strong>of</strong> <strong>2011</strong> (From 1 January to 31 December <strong>2011</strong>)<br />
Sales<br />
Oil business<br />
Energy<br />
Solution<br />
Business<br />
Subtotal Others Total Adjustment<br />
(Unit: Million Yen)<br />
<strong>Consolidated</strong><br />
(1) Sales to customers 2,695,278 65,799 2,761,078 10,339 2,771,418 - 2,771,418<br />
(2) Inter-segment sales and<br />
transfers<br />
2,640 4,956 7,596 3,865 11,462 (11,462) -<br />
Total 2,697,918 70,756 2,768,674 14,205 2,782,880 (11,462) 2,771,418<br />
Operating<br />
Income/(loss)<br />
87,267 (28,895) 58,371 2,056 60,427 (138) 60,288<br />
Other items<br />
Assets 1,029,751 156,915 1,186,666 35,283 1,221,950 (13,507) 1,208,442<br />
Depreciation expense 27,754 14,939 42,693 636 43,329 - 43,329<br />
Amortization <strong>of</strong><br />
Goodwill<br />
Equity in net earnings<br />
<strong>of</strong> affiliates<br />
371 (28) 342 - 342 - 342<br />
1,870 (66) 1,804 - 1,804 - 1,804<br />
Impairment loss 2,841 8,581 11,423 - 11,423 - 11,423<br />
Unamortized amount <strong>of</strong><br />
Goodwill<br />
(136) (115) (251) - (251) - (251)<br />
Capital Expenditures 14,465 27,272 41,738 177 41,915 - 41,915<br />
Notes: 1. The “Others” category incorporates operations not included in business segments reported, including leasing and<br />
administration <strong>of</strong> properties, construction works, sale and lease <strong>of</strong> auto accessories etc.<br />
2. Adjustment <strong>of</strong> operating income (loss) refers to elimination <strong>of</strong> intersegment transactions.<br />
3. Operating income (loss) <strong>for</strong> segment is adjusted on operating income on the consolidated statements <strong>of</strong> income <strong>for</strong><br />
the year to date <strong>of</strong> the current consolidated financial year.<br />
(Additional in<strong>for</strong>mation)<br />
Effective from the current consolidated financial year, the Group applies the “Revised Accounting Standard <strong>for</strong> Disclosures<br />
about Segments <strong>of</strong> an Enterprise and Related in<strong>for</strong>mation” (ASBJ Statement No. 17 <strong>of</strong> March 27, 2009) and “Guidance on the<br />
Accounting Standard <strong>for</strong> Disclosures about Segments <strong>of</strong> an Enterprise and Related In<strong>for</strong>mation” (ASBJ Guidance No. 20 <strong>of</strong><br />
March 21, 2008).<br />
- 28 -
(In<strong>for</strong>mation on per share data)<br />
Previous <strong>Year</strong><br />
(From 1 Jan.2010<br />
(Unit : Yen)<br />
Current <strong>Year</strong><br />
(From 1 Jan.<strong>2011</strong><br />
To 31 Dec.2010) To 31 Dec.<strong>2011</strong>)<br />
Net assets per share 637.78 679.37<br />
Net income per share 42.37 61.36<br />
Diluted net income per share<br />
Due to no diluted share, the<br />
in<strong>for</strong>mation is omitted.<br />
Due to no diluted share, the<br />
in<strong>for</strong>mation is omitted.<br />
Basis <strong>of</strong> calculation<br />
Earnings per share / Diluted earnings per share<br />
Previous <strong>Year</strong><br />
(From 1 Jan.2010<br />
Current <strong>Year</strong><br />
(From 1 Jan.<strong>2011</strong><br />
To 31 Dec.2010) To 31 Dec.<strong>2011</strong>)<br />
Net income/ (loss) (¥M) 15,956 23,110<br />
Net income / (loss) related to common stock (¥M) 15,956 23,110<br />
Amount not belonging to common shareholders (¥M) - -<br />
Average number <strong>of</strong> common shares (1,000shares) 376,626 376,624<br />
(Significant subsequent event)<br />
None<br />
(Omission <strong>of</strong> disclosure)<br />
Disclosure is omitted <strong>for</strong> the notes to lease transaction, trade with related parties, differed taxation, financial<br />
instruments, securities, derivatives, retirement benefit, asset retirement obligation and rental property, because those<br />
in<strong>for</strong>mation provided as in the flash report is less important.<br />
- 29 -
5. Non-consolidated financial statements<br />
(1) Non-consolidated balance sheet<br />
Previous year end<br />
As <strong>of</strong> 31 Dec. 2010<br />
(Unit:Million Yen)<br />
Current year end<br />
As <strong>of</strong> 31 Dec. <strong>2011</strong><br />
Assets<br />
Current assets<br />
Cash and deposits 7,837 4,777<br />
Notes receivable-trade 106 113<br />
Accounts receivable-trade 281,612 308,997<br />
Lease receivables 70 73<br />
Lease investment assets 815 804<br />
Merchandise and finished goods 99,480 129,722<br />
Raw materials and supplies 116,792 117,500<br />
Advance payments-trade 36 142<br />
Prepaid expenses 996 1,016<br />
Deferred tax assets 15,844 5,967<br />
Short-term loans receivable 73 63<br />
Short-term loans receivable from subsidiaries and affiliates 143,766 183,338<br />
Accounts receivable-other 11,333 13,862<br />
Derivatives 834 702<br />
Other 612 738<br />
Allowance <strong>for</strong> doubtful accounts (1,030) (618)<br />
Total current assets 679,184 767,203<br />
Noncurrent assets<br />
Property, plant and equipment<br />
Buildings 112,580 102,263<br />
Accumulated depreciation and impairment loss (64,438) (59,597)<br />
Buildings, net 48,141 42,666<br />
Structures 77,818 65,524<br />
Accumulated depreciation and impairment loss (56,845) (45,987)<br />
Structures, net 20,973 19,536<br />
Oil tanks 36,060 29,939<br />
Accumulated depreciation and impairment loss (31,326) (25,294)<br />
OIl tanks, net 4,734 4,645<br />
Machinery and equipment 115,041 63,232<br />
Accumulated depreciation and impairment loss (99,727) (49,428)<br />
Machinery and equipment, net 15,314 13,804<br />
Vehicles 77 93<br />
Accumulated depreciation and impairment loss (49) (63)<br />
Vehicles, net 27 29<br />
Tools, furniture and fixtures 15,638 14,375<br />
Accumulated depreciation and impairment loss (13,545) (12,420)<br />
Tools, furniture and fixtures, net 2,093 1,954<br />
Land 108,958 105,342<br />
- 30 -
Previous year end<br />
As <strong>of</strong> 31 Dec. 2010<br />
(Unit:Million Yen)<br />
Current year end<br />
As <strong>of</strong> 31 Dec. <strong>2011</strong><br />
Lease assets 219 228<br />
Accumulated depreciation and impairment loss (34) (70)<br />
Lease assets, net 185 158<br />
Construction in progress 958 941<br />
Total property, plant and equipment<br />
Intangible assets<br />
201,387 189,079<br />
Patent right 1 0<br />
Leasehold right 3,786 3,828<br />
S<strong>of</strong>tware 4,793 3,164<br />
Right <strong>of</strong> using facilities 79 67<br />
Total intangible assets<br />
Investments and other assets<br />
8,661 7,061<br />
Investment securities 8,299 7,543<br />
Stocks <strong>of</strong> subsidiaries and affiliates 118,706 64,996<br />
Investments in capital 1,930 2,009<br />
Investments in capital <strong>of</strong> subsidiaries and affiliates 1 1<br />
Long-term loans receivable 380 322<br />
Long-term loans receivable from subsidiaries and affiliates 20,091 12,062<br />
Long-term prepaid expenses 1,155 893<br />
Deferred tax assets 36,280 17,590<br />
Lease and guarantee deposits 9,186 8,771<br />
Claims provable in bankruptcy, claims provable in<br />
rehabilitation and other<br />
96 22<br />
Other 1,809 3,095<br />
Allowance <strong>for</strong> doubtful accounts (342) (209)<br />
Total investments and other assets 197,596 117,100<br />
Total noncurrent assets 407,645 313,241<br />
Total assets 1,086,829 1,080,445<br />
- 31 -
Previous year end<br />
As <strong>of</strong> 31 Dec. 2010<br />
(Unit:Million Yen)<br />
Current year end<br />
As <strong>of</strong> 31 Dec. <strong>2011</strong><br />
Liabilities<br />
Current liabilities<br />
Accounts payable-trade 260,464 281,485<br />
Short-term loans payable 33,101 42,647<br />
Current portion <strong>of</strong> long-term loans payable ― 9,000<br />
Lease obligations 186 207<br />
Accounts payable-other 122,722 119,515<br />
Accrued taxes 40,591 41,681<br />
Accrued consumption taxes 8,565 5,792<br />
Income taxes payable 338 398<br />
Accrued expenses 13,073 12,221<br />
Advances received 16,804 19,444<br />
Deposits received 17,551 17,430<br />
Deposits from dealers 13,238 12,407<br />
Provision <strong>for</strong> bonuses 759 809<br />
Provision <strong>for</strong> directors' bonuses 32 26<br />
Deposits received from employees 426 447<br />
Commercial papers 115,000 52,000<br />
Derivatives liabilities 2,403 479<br />
Other ― 214<br />
Total current liabilities 645,260 616,209<br />
Noncurrent liabilities<br />
Bonds payable 35,000 35,000<br />
Long-term loans payable 99,000 125,000<br />
Lease obligations 823 762<br />
Provision <strong>for</strong> retirement benefits 60,704 63,364<br />
Provision <strong>for</strong> special repairs 2,148 2,378<br />
Long-term guarantee deposited 4,255 2,568<br />
Other 16,414 16,990<br />
Total noncurrent liabilities 218,346 246,063<br />
Total liabilities 863,606 862,273<br />
- 32 -
Previous year end<br />
As <strong>of</strong> 31 Dec. 2010<br />
(Unit:Million Yen)<br />
Current year end<br />
As <strong>of</strong> 31 Dec. <strong>2011</strong><br />
Net assets<br />
Shareholders' equity<br />
Capital stock 34,197 34,197<br />
Capital surplus<br />
Legal capital surplus 22,045 22,045<br />
Other capital surplus 28 28<br />
Total capital surpluses 22,074 22,074<br />
Retained earnings<br />
Legal retained earnings 6,749 6,749<br />
Other retained earnings<br />
Reserve <strong>for</strong> advanced depreciation <strong>of</strong> noncurrent assets 13,596 14,745<br />
General reserve 5,550 5,550<br />
Retained earnings brought <strong>for</strong>ward 140,297 134,552<br />
Total retained earnings 166,193 161,597<br />
Treasury stock (134) (134)<br />
Total shareholders' equity 222,331 217,734<br />
Valuation and translation adjustments<br />
Valuation difference on available-<strong>for</strong>-sale securities 891 437<br />
Total valuation and translation adjustments 891 437<br />
Total net assets 223,222 218,171<br />
Total liabilities and net assets 1,086,829 1,080,445<br />
- 33 -
(2) Non-consolidated statement <strong>of</strong> income<br />
Previous year<br />
(Unit:Million Yen)<br />
Current year<br />
From 1 Jan. 2010<br />
From 1 Jan. <strong>2011</strong><br />
To 31 Dec. 2010<br />
To 31 Dec. <strong>2011</strong><br />
Net sales<br />
Cost <strong>of</strong> sales<br />
2,203,807 2,613,231<br />
Beginning merchandise and finished goods 81,252 70,133<br />
Cost <strong>of</strong> products manufactured 1,014,040 1,252,733<br />
Gasoline tax and diesel oil tax 335,055 354,997<br />
Cost <strong>of</strong> purchased goods 762,449 915,869<br />
Others 21,078 26,152<br />
Transfer to other account 58,425 76,867<br />
Total 2,155,451 2,543,019<br />
Ending merchandise and finished goods 70,133 93,137<br />
Total cost <strong>of</strong> sales 2,085,317 2,449,881<br />
Gross pr<strong>of</strong>it<br />
Selling, general and administrative expenses<br />
118,490 163,349<br />
Haulage expenses 28,657 29,418<br />
Warehousing expenses 7,836 7,618<br />
Repair expenses 2,706 3,184<br />
Provision <strong>for</strong> special repairs 175 177<br />
Promotion expenses 5,543 5,411<br />
Research and development expenses 3,420 4,022<br />
Employees' salaries and bonuses 8,854 9,201<br />
Provision <strong>for</strong> bonuses 690 739<br />
Provision <strong>for</strong> directors' bonuses 32 26<br />
Retirement benefit expenses 4,036 3,865<br />
Depreciation 2,201 2,426<br />
Rent expenses 3,460 3,266<br />
Taxes and dues 1,139 1,309<br />
Subcontract expenses 5,208 5,157<br />
Commission fee 2,642 2,747<br />
Other 8,679 8,798<br />
Deductions △3,447 △3,580<br />
Total selling, general and administrative expenses 81,839 83,791<br />
Operating income<br />
Non-operating income<br />
36,650 79,557<br />
Interest income 1,066 1,027<br />
Dividends income 3,609 3,846<br />
Foreign exchange gains 857 1,597<br />
Gain on investments in silent partnership 1,374 1,472<br />
Other 484 494<br />
Total non-operating income 7,392 8,439<br />
- 34 -
Previous year<br />
(Unit:Million Yen)<br />
Current year<br />
From 1 Jan. 2010<br />
From 1 Jan. <strong>2011</strong><br />
To 31 Dec. 2010<br />
To 31 Dec. <strong>2011</strong><br />
Non-operating expenses<br />
Interest expenses 1,525 1,765<br />
Interest on bonds 348 398<br />
Sales discounts 1,532 1,783<br />
Other 659 823<br />
Total non-operating expenses 4,065 4,770<br />
Ordinary income<br />
Extraordinary income<br />
39,977 83,227<br />
Gain on sales <strong>of</strong> noncurrent assets 2,409 8,731<br />
Gain on sales <strong>of</strong> investment securities 1,649 10<br />
Reversal <strong>of</strong> provisions <strong>for</strong> estimated loss on assets disposal ― 91<br />
Reversal <strong>of</strong> provision <strong>for</strong> special repairs 785 ―<br />
Subsidy 502 240<br />
Other 362 1,502<br />
Total extraordinary income<br />
Extraordinary loss<br />
5,710 10,576<br />
Loss on disposal <strong>of</strong> noncurrent assets 2,244 2,707<br />
Loss on sales <strong>of</strong> investment securities 260 1<br />
Loss on valuation <strong>of</strong> investment securities 282 5<br />
Loss on valuation <strong>of</strong> stocks <strong>of</strong> subsidiaries and affiliates ― 53,703<br />
Impairment loss 2,906 2,821<br />
Loss on litigation 1,920 ―<br />
Other 16 3,705<br />
Total extraordinary losses 7,630 62,944<br />
Income be<strong>for</strong>e income taxes 38,056 30,858<br />
Income taxes-current 26 29<br />
Income taxes-deferred 15,629 28,645<br />
Total income taxes 15,656 28,674<br />
Net income 22,399 2,184<br />
- 35 -
(3) Non-consolidated statement <strong>of</strong> changes in shareholders’ equity<br />
Previous year<br />
(Unit:Million Yen)<br />
Current year<br />
From 1 Jan. 2010<br />
From 1 Jan. <strong>2011</strong><br />
To 31 Dec. 2010<br />
To 31 Dec. <strong>2011</strong><br />
Shareholders' equity<br />
Capital stock<br />
Balance at the end <strong>of</strong> previous period<br />
Changes <strong>of</strong> items during the period<br />
34,197 34,197<br />
Total changes <strong>of</strong> items during the period ― ―<br />
Balance at the end <strong>of</strong> current period<br />
Capital surplus<br />
Legal capital surplus<br />
34,197 34,197<br />
Balance at the end <strong>of</strong> previous period<br />
Changes <strong>of</strong> items during the period<br />
22,045 22,045<br />
Total changes <strong>of</strong> items during the period ― ―<br />
Balance at the end <strong>of</strong> current period<br />
Other capital surplus<br />
22,045 22,045<br />
Balance at the end <strong>of</strong> previous period<br />
Changes <strong>of</strong> items during the period<br />
28 28<br />
Disposal <strong>of</strong> treasury stock (0) (0)<br />
Total changes <strong>of</strong> items during the period (0) (0)<br />
Balance at the end <strong>of</strong> current period<br />
Total capital surplus<br />
28 28<br />
Balance at the end <strong>of</strong> previous period<br />
Changes <strong>of</strong> items during the period<br />
22,074 22,074<br />
Disposal <strong>of</strong> treasury stock (0) (0)<br />
Total changes <strong>of</strong> items during the period (0) (0)<br />
Balance at the end <strong>of</strong> current period<br />
Retained earnings<br />
Legal retained earnings<br />
22,074 22,074<br />
Balance at the end <strong>of</strong> previous period<br />
Changes <strong>of</strong> items during the period<br />
6,749 6,749<br />
Total changes <strong>of</strong> items during the period ― ―<br />
Balance at the end <strong>of</strong> current period<br />
Other retained earnings<br />
Reserve <strong>for</strong> advanced depreciation <strong>of</strong><br />
noncurrent assets<br />
6,749 6,749<br />
Balance at the end <strong>of</strong> previous period<br />
Changes <strong>of</strong> items during the period<br />
13,206 13,596<br />
Provision <strong>of</strong> reserve <strong>for</strong> advanced<br />
depreciation <strong>of</strong> noncurrent assets<br />
390 1,148<br />
Total changes <strong>of</strong> items during the period 390 1,148<br />
Balance at the end <strong>of</strong> current period 13,596 14,745<br />
- 36 -
Previous year<br />
(Unit:Million Yen)<br />
Current year<br />
From 1 Jan. 2010<br />
From 1 Jan. <strong>2011</strong><br />
To 31 Dec. 2010<br />
To 31 Dec. <strong>2011</strong><br />
General reserve<br />
Balance at the end <strong>of</strong> previous period<br />
Changes <strong>of</strong> items during the period<br />
5,550 5,550<br />
Total changes <strong>of</strong> items during the period ― ―<br />
Balance at the end <strong>of</strong> current period<br />
Retained earnings brought <strong>for</strong>ward<br />
5,550 5,550<br />
Balance at the end <strong>of</strong> previous period<br />
Changes <strong>of</strong> items during the period<br />
128,458 140,297<br />
Dividends from surplus (10,170) (6,780)<br />
Net income 22,399 2,184<br />
Provision <strong>of</strong> reserve <strong>for</strong> advanced<br />
depreciation <strong>of</strong> noncurrent assets<br />
(390) (1,148)<br />
Total changes <strong>of</strong> items during the period 11,838 (5,744)<br />
Balance at the end <strong>of</strong> current period<br />
Total retained earnings<br />
140,297 134,552<br />
Balance at the end <strong>of</strong> previous period<br />
Changes <strong>of</strong> items during the period<br />
153,964 166,193<br />
Dividends from surplus (10,170) (6,780)<br />
Net income 22,399 2,184<br />
Provision <strong>of</strong> reserve <strong>for</strong> advanced depreciation<br />
<strong>of</strong> noncurrent assets<br />
― ―<br />
Total changes <strong>of</strong> items during the period 12,228 (4,596)<br />
Balance at the end <strong>of</strong> current period<br />
Treasury stock<br />
166,193 161,597<br />
Balance at the end <strong>of</strong> previous period<br />
Changes <strong>of</strong> items during the period<br />
(132) (134)<br />
Purchase <strong>of</strong> treasury stock (1) (0)<br />
Disposal <strong>of</strong> treasury stock 0 0<br />
Total changes <strong>of</strong> items during the period (1) (0)<br />
Balance at the end <strong>of</strong> current period<br />
Total shareholders' equity<br />
(134) (134)<br />
Balance at the end <strong>of</strong> previous period<br />
Changes <strong>of</strong> items during the period<br />
210,103 222,331<br />
Dividends from surplus (10,170) (6,780)<br />
Net income 22,399 2,184<br />
Purchase <strong>of</strong> treasury stock (1) (0)<br />
Disposal <strong>of</strong> treasury stock 0 0<br />
Total changes <strong>of</strong> items during the period 12,227 (4,596)<br />
Balance at the end <strong>of</strong> current period 222,331 217,734<br />
- 37 -
Previous year<br />
(Unit:Million Yen)<br />
Current year<br />
From 1 Jan. 2010<br />
From 1 Jan. <strong>2011</strong><br />
To 31 Dec. 2010<br />
To 31 Dec. <strong>2011</strong><br />
Valuation and translation adjustments<br />
Valuation difference on available-<strong>for</strong>-sale securities<br />
Balance at the end <strong>of</strong> previous period<br />
Changes <strong>of</strong> items during the period<br />
1,708 891<br />
Net changes <strong>of</strong> items other than shareholders' equity (816) (454)<br />
Total changes <strong>of</strong> items during the period (816) (454)<br />
Balance at the end <strong>of</strong> current period<br />
Total valuation and translation adjustments<br />
891 437<br />
Balance at the end <strong>of</strong> previous period<br />
Changes <strong>of</strong> items during the period<br />
1,708 891<br />
Net changes <strong>of</strong> items other than shareholders' equity (816) (454)<br />
Total changes <strong>of</strong> items during the period (816) (454)<br />
Balance at the end <strong>of</strong> current period<br />
Total net assets<br />
891 437<br />
Balance at the end <strong>of</strong> previous period<br />
Changes <strong>of</strong> items during the period<br />
211,812 223,222<br />
Dividends from surplus (10,170) (6,780)<br />
Net income 22,399 2,184<br />
Purchase <strong>of</strong> treasury stock (1) (0)<br />
Disposal <strong>of</strong> treasury stock 0 0<br />
Net changes <strong>of</strong> items other than shareholders' equity (816) (454)<br />
Total changes <strong>of</strong> items during the period 11,410 (5,051)<br />
Balance at the end <strong>of</strong> current period 223,222 218,171<br />
- 38 -
(4) Notes <strong>for</strong> premises <strong>of</strong> going concern<br />
Not applicable<br />
6. Others<br />
(1) Appointment and retirement <strong>of</strong> directors<br />
Not applicable<br />
(2) Others<br />
Not applicable<br />
- 39 -