104 <strong>Plant</strong> Cell Tiss Organ Cult (2009) 99:97–108Random samples <strong>of</strong> these PCR-positive plants were thensubject to Southern analysis. PCR screening <strong>of</strong> all herbicide-tolerantplants indicated that all regenerated plantscontained the bar gene, a result that was consistent withthose <strong>of</strong> leaf-painting. This result clearly showed that thereis no escape regardless <strong>of</strong> herbicide selection schemes.The genomic DNAs <strong>of</strong> primary <strong>transgenic</strong> plants (T0)for the Southern blot were digested with Xho I, which cutsonly once within the T-DNA region; thus, the number <strong>of</strong>fragments detected on a Southern blot represents distinctinsertion events and the number <strong>of</strong> T-DNA insertion loci(Fig. 3a). Eight <strong>of</strong> the nine randomly sampled eventscontained a single insertion <strong>of</strong> T-DNA, and one eventcontained multiple insertions. Lanes 6123H, G, and Fappear to represent an identical event, since they exhibitthe same banding pattern.Among the total 80 regenerated independent events thatwe developed, 4 <strong>of</strong> 6 showed integration <strong>of</strong> both bar andTC2 and 32 out <strong>of</strong> 74 showed the integration <strong>of</strong> both barand SKRS genes in their genomes, with the co-transformationratios <strong>of</strong> 66.7 and 43.2%, respectively, for anaverage <strong>of</strong> 45%.Segregation analysis <strong>of</strong> T1 generationTo confirm stable inheritance and normal segregation <strong>of</strong>transgenes and to obtain <strong>marker</strong>-<strong>free</strong> <strong>transgenic</strong> progenyplants from the primary <strong>transgenic</strong> events, seedlings <strong>of</strong>self-pollinated T1 plants from randomly-selected differentT0 events were subjected to Southern blot analysis usingthe gene <strong>of</strong> interest (TC2 or SKRS) and bar as probes,respectively.TC2 <strong>transgenic</strong>s: Fig. 3b showed Southern blot on threerandomly-selected T1 plants representing three differentevents (2202-3, 2301-1, and 2315-1) and one set <strong>of</strong> sixprogeny (T1) plants <strong>of</strong> random event 7706A. The genomicDNA was digested with HindIII which cut only once withinthe first and second T-DNA regions, respectively (Fig. 1a),allowing identification <strong>of</strong> different and the number <strong>of</strong>insertion sites. The membrane was first hybridized withTC2 probe (KpnI/HindIII fragment; Fig. 3b, top). Thisprobe is expected to hybridize once within the secondT-DNA region. Clearly, all progeny plants except for7706A-3 and 7706A-4 carried TC2 gene with 1–4 insertionsites. The absence <strong>of</strong> the TC2 gene in 7706A-3 and 7706A-4plants suggested that they are null due to the segregation.The weak bands at around 6.6 and 9.4 kb across all samplesare likely the <strong>sorghum</strong> genome endogenous sequencessharing certain degree <strong>of</strong> homology with the TC2 gene,whereas the shifted band locations around these molecularweights indicated the heterogeneous nature <strong>of</strong> the genome<strong>of</strong> this <strong>sorghum</strong> variety used in transformation. The samemembrane was then stripped and re-probed with bar-TEV(as a XhoI/KpnI fragment) sequence which is expected tohybridize once within the first T-DNA region (Fig. 3b,bottom). Apparently, the absence <strong>of</strong> band in plants 7706A-2and 7706A-4 suggested that they are <strong>marker</strong>-<strong>free</strong> <strong>transgenic</strong>since they carry TC2 gene as shown by TC2 probe.The weak band at around 6.6 kb is genome endogenoussequences sharing some homology with bar-TEV probe. Itis also obvious that in most <strong>transgenic</strong> plant samples theinsertion sites <strong>of</strong> TC2 and bar cassettes are different,suggesting the independent integration and segregation <strong>of</strong>these two genes located at separate T-DNA regions.SKRS <strong>transgenic</strong>s: The same Southern approach usedfor TC2 was applied to the analysis <strong>of</strong> 6 randomly-selectedT1 plants derived from six different events and one set <strong>of</strong>six progeny plants <strong>of</strong> event 3601 (Fig. 3c). The genomicDNA was digested with Sac I which cut once within firstand second T-DNA regions, separately (Fig. 1b). Themembrane was first hybridized with SKRS probe (as SacI/NcoI fragment; Fig. 3c, top). All plants except for 3103-4and 6169-2 carry SKRS gene with 1–4 insertion sites.<strong>Plant</strong>s 3103-4 and 6169-2 are apparently null because <strong>of</strong>the segregation. The two strong bands at around 9 and23 bp across all samples suggested a high degree <strong>of</strong>homology <strong>of</strong> <strong>sorghum</strong> genomic endogenous sequenceswith the probe. To determine if the bar gene is absent fromany <strong>of</strong> these plants, the membrane was stripped andhybridized with bar-TEV sequence (Fig. 3c, bottom).Cleary, no <strong>marker</strong>-<strong>free</strong> <strong>transgenic</strong> plants was detected inthis group.PCR screen: To analyze a larger number <strong>of</strong> samples,seven randomly-selected independent events were examinedby PCR analysis. Figure 4 shows such a PCR analysisusing progeny (T1) plants from T0 event 2202 <strong>of</strong> pZY101-TC2 as an example. Of the 15 progeny plants (T1) <strong>of</strong> this T0event, plants 3, 8, 9, 10, 12, 13, and 14 did not segregate inthe T1 generation, plants 1, 5, 6, 7, and 15 segregated foreither bar or tRNA Lys (TC2), and plants 2 and 11 were null.Tables 5 and 6 summarize the segregation data for the<strong>transgenic</strong> events carrying the TC2 or SKRS genes,respectively. Three <strong>of</strong> four independent events exhibited theexpected Mendelian independent segregation ratio <strong>of</strong>9:3:3:1 for two separate T-DNA insertions <strong>of</strong> bar and SKRS,and two <strong>of</strong> three events with independent segregations <strong>of</strong> barand tRNA lys , and each <strong>of</strong> these events led to <strong>marker</strong>-<strong>free</strong>progeny at an average <strong>of</strong> 3/16. The rest two events inherited<strong>marker</strong> gene and gene(s) <strong>of</strong> interest in a linkage manner only.DiscussionUsing standard binary vectors, we have developed a rapidand reproducible procedure that yields <strong>marker</strong>-<strong>free</strong> <strong>transgenic</strong><strong>sorghum</strong> plants upon segregation. Our method123
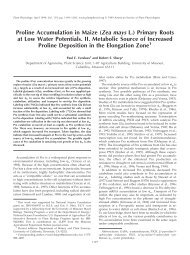
<strong>Plant</strong> Cell Tiss Organ Cult (2009) 99:97–108 105Fig. 3 Southern blot analyses <strong>of</strong> genomic DNAs from primaryputative <strong>transgenic</strong> <strong>sorghum</strong> plants and progeny. a k/HindIII,k/HindIII DNA ladders; 30 and 90 pg, plasmid pZY101- SKRS ashybridization sensitivity and 19 <strong>sorghum</strong> genome equivalent copynumber control, respectively; WT wild type <strong>sorghum</strong>; 5010F to6168E, putative primary <strong>transgenic</strong> events. The 6123H, G, and F werefrom three plants <strong>of</strong> the same events. Genomic DNA <strong>of</strong> each sampleas well as the plasmid control DNA were digested with restrictionenzyme XhoI and the membrane was probed with the bar-TEV. b WTwild type <strong>sorghum</strong>; 2202-3 to 7706A-6, progeny plants <strong>of</strong> T0 TC2events. Genomic as well as plasmid control DNA was digested withk/HindIII and membrane was probed with TC2 probe (top) orbar-TEV probe (bottom); 19 and 59, 1 and 5 copy genome equivalentcopy number controls using 22 and 110 pg <strong>of</strong> pZY101-TC2 plasmid,respectively. c WT wild type; 3103-4 to 3601-6, progeny <strong>of</strong> T0 SKRSevents. Genomic as well as plasmid control DNA was digested withSac I and membrane was probed with SKRS probe (top) orbar-TEVprobe (bottom); 19, 1 copy genome equivalent control using 22 pg <strong>of</strong>plasmid SBS19-SKRStherefore improves upon previous transformation methods(Zhao et al. 2000; Cai et al. 2002). An important modificationis the use <strong>of</strong> PPT at a low concentration (2.5 l -1instead <strong>of</strong> 5 or 10 mg l -1 ) and a short selection period(4–8 weeks instead <strong>of</strong> 10–14 weeks) in callus inductionmedium; the procedure also eliminates the selection pressurefrom the shooting medium. In our experiments, highlevels <strong>of</strong> PPT (5 mg l -1 or 10 mg l -1 ) accelerated production<strong>of</strong> phenolic compounds and embryo browning andprevented recovery <strong>of</strong> <strong>transgenic</strong> <strong>sorghum</strong>. The elimination<strong>of</strong> PPT from the shooting medium was found to be criticalfor ensuring survival and regeneration <strong>of</strong> putatively <strong>transgenic</strong>embryogenic calli. In addition, the decreased duration<strong>of</strong> selection (4–8 weeks) favors the recovery <strong>of</strong><strong>transgenic</strong> shoots. This selection period is thus shorter thanthose previously developed for <strong>sorghum</strong> transformation(Zhao et al. 2000; Cai et al. 2002; Carvalho et al. 2004;Howe et al. 2006).There was no significant difference between a 3-day(I-3) and 5-day (I-5) cocultivation period, although the meanvalue <strong>of</strong> the latter was higher than the former (Table 2).Addition <strong>of</strong> antioxidants L-cysteine and DTT (II-3 and II-5)123