class lecture notes 8
class lecture notes 8
class lecture notes 8

You also want an ePaper? Increase the reach of your titles
YUMPU automatically turns print PDFs into web optimized ePapers that Google loves.
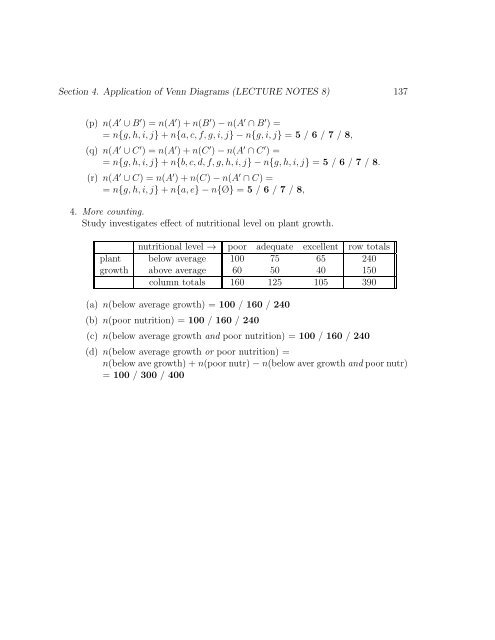
Section 4. Application of Venn Diagrams (LECTURE NOTES 8) 137(p) n(A ′ ∪B ′ ) = n(A ′ )+n(B ′ )−n(A ′ ∩B ′ ) == n{g,h,i,j}+n{a,c,f,g,i,j}−n{g,i,j} = 5 / 6 / 7 / 8,(q) n(A ′ ∪C ′ ) = n(A ′ )+n(C ′ )−n(A ′ ∩C ′ ) == n{g,h,i,j}+n{b,c,d,f,g,h,i,j}−n{g,h,i,j} = 5 / 6 / 7 / 8.(r) n(A ′ ∪C) = n(A ′ )+n(C)−n(A ′ ∩C) == n{g,h,i,j}+n{a,e}−n{Ø} = 5 / 6 / 7 / 8,4. More counting.Study investigates effect of nutritional level on plant growth.nutritional level → poor adequate excellent row totalsplant below average 100 75 65 240growth above average 60 50 40 150column totals 160 125 105 390(a) n(below average growth) = 100 / 160 / 240(b) n(poor nutrition) = 100 / 160 / 240(c) n(below average growth and poor nutrition) = 100 / 160 / 240(d) n(below average growth or poor nutrition) =n(belowavegrowth)+n(poornutr)−n(belowaver growthandpoornutr)= 100 / 300 / 400