Comparison of Seven Bug Report Types: A Case-Study of ... - IIIT
Comparison of Seven Bug Report Types: A Case-Study of ... - IIIT
Comparison of Seven Bug Report Types: A Case-Study of ... - IIIT
You also want an ePaper? Increase the reach of your titles
YUMPU automatically turns print PDFs into web optimized ePapers that Google loves.
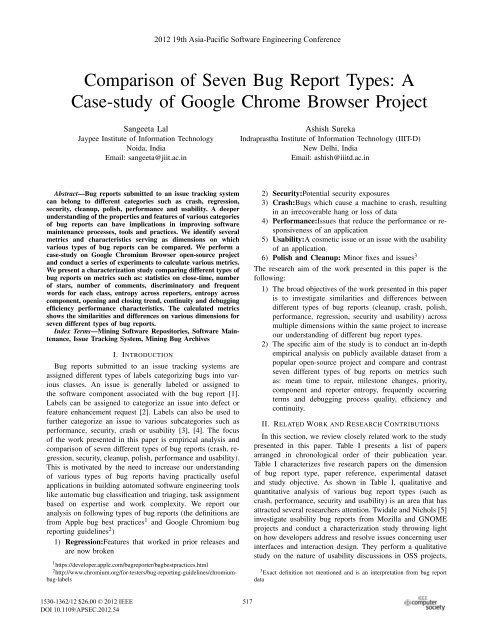
2012 19th Asia-Pacific S<strong>of</strong>tware Engineering Conference<strong>Comparison</strong> <strong>of</strong> <strong>Seven</strong> <strong>Bug</strong> <strong>Report</strong> <strong>Types</strong>: A<strong>Case</strong>-study <strong>of</strong> Google Chrome Browser ProjectSangeeta LalJaypee Institute <strong>of</strong> Information TechnologyNoida, IndiaEmail: sangeeta@jiit.ac.inAshish SurekaIndraprastha Institute <strong>of</strong> Information Technology (<strong>IIIT</strong>-D)New Delhi, IndiaEmail: ashish@iiitd.ac.inAbstract—<strong>Bug</strong> reports submitted to an issue tracking systemcan belong to different categories such as crash, regression,security, cleanup, polish, performance and usability. A deeperunderstanding <strong>of</strong> the properties and features <strong>of</strong> various categories<strong>of</strong> bug reports can have implications in improving s<strong>of</strong>twaremaintenance processes, tools and practices. We identify severalmetrics and characteristics serving as dimensions on whichvarious types <strong>of</strong> bug reports can be compared. We perform acase-study on Google Chromium Browser open-source projectand conduct a series <strong>of</strong> experiments to calculate various metrics.We present a characterization study comparing different types <strong>of</strong>bug reports on metrics such as: statistics on close-time, number<strong>of</strong> stars, number <strong>of</strong> comments, discriminatory and frequentwords for each class, entropy across reporters, entropy acrosscomponent, opening and closing trend, continuity and debuggingefficiency performance characteristics. The calculated metricsshows the similarities and differences on various dimensions forseven different types <strong>of</strong> bug reports.Index Terms—Mining S<strong>of</strong>tware Repositories, S<strong>of</strong>tware Maintenance,Issue Tracking System, Mining <strong>Bug</strong> ArchivesI. INTRODUCTION<strong>Bug</strong> reports submitted to an issue tracking systems areassigned different types <strong>of</strong> labels categorizing bugs into variousclasses. An issue is generally labeled or assigned tothe s<strong>of</strong>tware component associated with the bug report [1].Labels can be assigned to categorize an issue into defect orfeature enhancement request [2]. Labels can also be used t<strong>of</strong>urther categorize an issue to various subcategories such asperformance, security, crash or usability [3], [4]. The focus<strong>of</strong> the work presented in this paper is empirical analysis andcomparison <strong>of</strong> seven different types <strong>of</strong> bug reports (crash, regression,security, cleanup, polish, performance and usability).This is motivated by the need to increase our understanding<strong>of</strong> various types <strong>of</strong> bug reports having practically usefulapplications in building automated s<strong>of</strong>tware engineering toolslike automatic bug classification and triaging, task assignmentbased on expertise and work complexity. We report ouranalysis on following types <strong>of</strong> bug reports (the definitions arefrom Apple bug best practices 1 and Google Chromium bugreporting guidelines 2 )1) Regression:Features that worked in prior releases andare now broken1 https://developer.apple.com/bugreporter/bugbestpractices.html2 http://www.chromium.org/for-testers/bug-reporting-guidelines/chromiumbug-labels2) Security:Potential security exposures3) Crash:<strong>Bug</strong>s which cause a machine to crash, resultingin an irrecoverable hang or loss <strong>of</strong> data4) Performance:Issues that reduce the performance or responsiveness<strong>of</strong> an application5) Usability:A cosmetic issue or an issue with the usability<strong>of</strong> an application6) Polish and Cleanup: Minor fixes and issues 3The research aim <strong>of</strong> the work presented in this paper is thefollowing:1) The broad objectives <strong>of</strong> the work presented in this paperis to investigate similarities and differences betweendifferent types <strong>of</strong> bug reports (cleanup, crash, polish,performance, regression, security and usability) acrossmultiple dimensions within the same project to increaseour understanding <strong>of</strong> different bug report types.2) The specific aim <strong>of</strong> the study is to conduct an in-depthempirical analysis on publicly available dataset from apopular open-source project and compare and contrastseven different types <strong>of</strong> bug reports on metrics suchas: mean time to repair, milestone changes, priority,component and reporter entropy, frequently occurringterms and debugging process quality, efficiency andcontinuity.II. RELATED WORK AND RESEARCH CONTRIBUTIONSIn this section, we review closely related work to the studypresented in this paper. Table I presents a list <strong>of</strong> papersarranged in chronological order <strong>of</strong> their publication year.Table I characterizes five research papers on the dimension<strong>of</strong> bug report type, paper reference, experimental datasetand study objective. As shown in Table I, qualitative andquantitative analysis <strong>of</strong> various bug report types (such ascrash, performance, security and usability) is an area that hasattracted several researchers attention. Twidale and Nichols [5]investigate usability bug reports from Mozilla and GNOMEprojects and conduct a characterization study throwing lighton how developers address and resolve issues concerning userinterfaces and interaction design. They perform a qualitativestudy on the nature <strong>of</strong> usability discussions in OSS projects,3 Exact definition not mentioned and is an interpretation from bug reportdata1530-1362/12 $26.00 © 2012 IEEEDOI 10.1109/APSEC.2012.54517
TABLE ICLOSELY RELATED WORK LISTED IN A CHRONOLOGICAL ORDER<strong>Bug</strong> Type <strong>Study</strong> Dataset <strong>Study</strong> Objectives1 Usability Twidale and Mozilla and GNOMENichols (2005)[5]2 Security Gegick et al.(2010) [3]3 Performance, SecurityZaman et al.(2011) [4]4 Crash Khomh et al.(2011) [6]5 Performance Zaman et al.(2012) [7]Cisco S<strong>of</strong>tware SystemFirefox ProjectFirefox ProjectMozilla Firefox and Google ChromeUsability bug report analysis to characterize howdevelopers address and resolve issuesAutomatic identification (statistical modeling) <strong>of</strong> securitybugs based on natural language informationpresent in bug reports<strong>Comparison</strong> between Security and Performance bugson various aspectsTriaging <strong>of</strong> crash-types based on entropy regiongraphA qualitative study on performance bugs across fourdimensions (Impact, Context, Fix and Fix validation)TABLE IIGOOGLE CHROME BROWSER EXPERIMENTAL DATASET DETAILSField Value Field ValueFirst Issue ID 2 CRASH <strong>Bug</strong> <strong>Report</strong>s 3778Last Issue ID 111889 REGRESSION <strong>Bug</strong> <strong>Report</strong>s 2938<strong>Report</strong>ing Date <strong>of</strong> First Issue Id 30-08-2008 SECURITY <strong>Bug</strong> <strong>Report</strong>s 398<strong>Report</strong>ing Date <strong>of</strong> Last Issue Id 29-01-2012 CLEAN <strong>Bug</strong> <strong>Report</strong>s 800Issues Downloaded 93951 POLISH <strong>Bug</strong> <strong>Report</strong>s 261Issues [state=closed and status=fixed ,verified, duplicate] 53110 PERFORMANCE <strong>Bug</strong> <strong>Report</strong>s 169Issues unable to download 17938 USABILITY <strong>Bug</strong> <strong>Report</strong>s 38differences between commercial and open-source projects andthe pattern <strong>of</strong> discourse emerging across projects [5].Gegick et al. [3] present a technique to automaticallyidentify security bugs by text-mining the natural languageinformation present in a bug report. Their research shows thatsecurity bugs are <strong>of</strong>ten mislabeled as non-security due to lack<strong>of</strong> security domain knowledge. They derive a statistical modelfrom a labeled training dataset and then apply the inducedmodel on test dataset. Their solution approach was able toidentify a high percentage <strong>of</strong> security bugs which were labeledas non-security [3].Khomh et al. [6] present a method for triaging crash-typesbased on the concept <strong>of</strong> entropy region graph and introduce atechnique that in addition to the frequency counts also capturesthe distribution <strong>of</strong> the occurrences <strong>of</strong> crash-types among theusers <strong>of</strong> a system.Zaman et al. [4] perform an empirical analysis <strong>of</strong> securityand performance bugs (non-functional bug types) from Firefoxopen-source project and compare various aspects associatedwith the two types <strong>of</strong> bugs. The study by Zaman et al [4].reveals insights on aspects like: how <strong>of</strong>ten the two types <strong>of</strong>bugs are tossed and reopened, triage time, characteristics <strong>of</strong>bug fixes, number <strong>of</strong> developers involved and number <strong>of</strong> filesimpacted.Zaman et al. [7] investigate performance bug reports <strong>of</strong>Mozilla Firefox and Google Chrome across four dimensions(Impact, Context, Fix and Fix validation) and study severalcharacteristics <strong>of</strong> performance bugs and make recommendationson how to improve the process <strong>of</strong> identifying, trackingand fixing performance bugs.In context to existing literature and closely related work, thispaper makes the following unique and novel contributions.1) A first empirical study comparing seven different types<strong>of</strong> bug reports (cleanup, crash, polish, performance,regression, security and usability) on a popular opensourceproject (Google Chromium Browser) across multipledimensions (MTTR, priority, frequently occurringterms, bug fixing process quality, continuity and efficiencyperformance characteristics, component and reporterentropy, number <strong>of</strong> stars, comments, descriptionlength and milestone changes).2) The results and insights presented in this paper answersseveral research questions such as the degree <strong>of</strong> differencebetween metrics such as mean time to repair,priority and mile-stone changes across seven differenttypes <strong>of</strong> bug reports. The study provides evidences<strong>of</strong> correlation between certain terms and bug reporttypes. Empirical results demonstrating similarities anddifference in bug fixing process quality, continuity andefficiency across different bug reports are presented.III. EXPERIMENTAL DATASETWe conduct experiments on publicly-available data fromopen-source projects so that our experiments can be replicatedand our results can be used for benchmarking or comparison.Google Chromium is a popular and widely used opensource browser 4 and Google Chromium bug database hasalso been used for mining s<strong>of</strong>tware repositories experiments 5by researchers. We download bug report data from GoogleChromium issue tracker 6 using the issue tracker Java APIs 7 .4 http://www.chromium.org5 http://2011.msrconf.org/msr-challenge.html6 http://code.google.com/p/chromium/issues/list7 http://code.google.com/p/support/wiki/IssueTrackerAPI518
TABLE IIICOMPONENT AND REPORTER ENTROPY VALUES FOR GOOGLE CHROME BROWSER PROJECTProject Entropy CRASH REGR. SECUR. CLEAN POLISH PERF. USAB.Chrome Component 0.552 (2922) 0.666 (2808) 0.577 (330) 0.6345 (761) 0.637 (246) 0.777 (155) 0.764 (36)[Browser] <strong>Report</strong>er 0.890 (2468) 0.871 (2365) 0.781 (365) 0.895 (744) 0.905 (214) 0.932 (148) 0.976 (24)Fig. 1.Component and reporter entropy graphs showing the position <strong>of</strong> seven types <strong>of</strong> bug reports [Google Chrome Browser Project]Table II shows the dataset (year 2008 to 2012) used forour experiments. As shown in the Table II, we download bugreports from start date (30-August-2008) till (29-Jan-2012).We were not able to download all the bug reports in thespecified range due to permission denied or not availableerrors. Table II shows count <strong>of</strong> closed bug reports that areresolved as fixed, verified, or duplicate. Table II also showsnumber <strong>of</strong> bug reports with respect to each <strong>of</strong> the sevenbug types. As bug labeling is not a mandatory task in bugfixing process (for Google Chrome project), not every bugreport is labeled as crash, regression, security, cleanup, polish,performance or usability. Hence, we check for the label <strong>of</strong> eachbug report and include it in our experimental dataset only if istagged (manual labeling by developers) with one <strong>of</strong> the predefinedcategories. As shown in Table II, the total number <strong>of</strong>bug reports which are closed, verified or duplicate and belongsto one <strong>of</strong> the pre-defined categories (crash, regression, security,cleanup, polish, performance and usability) are 8030 (as onebug report can have multiple labels). Assigning meaningfullabels 8 or manual tagging is used by Google Chrome projectteam members to classify bug report. A bug report can havemultiple labels, for example, label for bug type (such assecurity, performance or usability), milestone changes, statusor priority. We perform a manual inspection <strong>of</strong> Google Chromeissues to identify the labels (and their variations) for the sevendifferent types <strong>of</strong> bug reports. For example, we categorize abug report to type crash if it has a “Crash” or “Type-Crash”or “Stability-Crash” keywords in the label field. We extractbug report priority by checking for the presence <strong>of</strong> the label“pri” in a given bug report. Milestone change informationis extracted using the keyword “movedfrom-”, “movedfrom”,“moved from m” or “bulkmove”. Other standard fields suchas bug report state, status, time taken to fix the bug are directlyaccessible using issue tracker API.8 http://code.google.com/p/support/wiki/IssueTrackerIV. EMPIRICAL ANALYSIS AND RESULTSEach <strong>of</strong> the following subsections focuses on one particulardimension or a set <strong>of</strong> coherent metrics across which the sevendifferent types <strong>of</strong> bug reports are compared and contrasted.A. Entropy across Components and <strong>Report</strong>ersWe compare various types <strong>of</strong> bug reports based on a metriccalled “Entropy”. Khomh et al. [6] define a term called ascrash-entropy which is employed in their proposed techniqueto prioritize bug reports for the purpose <strong>of</strong> triaging. Theyargue that for bug-reports which are linked to crash-types, itis not only important to prioritize based on the raw frequency(number <strong>of</strong> bug reports for the specific crash-type) but alsobased on the number <strong>of</strong> users affected by it (distribution acrossusers). Khomh et al [6]. define crash entropy as a metricthat quantifies the distribution <strong>of</strong> the occurrences <strong>of</strong> variouscrash-types across users . Two crash types may have the samenumber <strong>of</strong> bug-reports belonging to their respective categoriesbut the distribution across users can be different.Similarly, we apply the main concept (<strong>of</strong> measuring Entropy)in the context <strong>of</strong> this study and present our insights.However, there are differences between the applications <strong>of</strong> theconcept in the work done by Khomh et al. [6] and our work.Our objective is to measure, compare and contrast the entropy<strong>of</strong> seven types <strong>of</strong> bug reports across components and reporters.The formula for entropy (as used in [6] and [8]) is shown inEquation 1:i=nH n (BT )=− p i ∗ log n (p i ) (1)∑i=1In Equation 1, BT denotes bug types (one <strong>of</strong> the seven categories:crash, regression, security, clean, polish, performanceand usability). n is the total number <strong>of</strong> unique componentsor reporters (depending on the application for components orreporters) in the dataset. H n (BT ) denotes the entropy for a specificbug-type and p i is the probability <strong>of</strong> a specific component519
or reporter (depending on the application) belonging to therespective bug-type. For the variable p, p i ≥ 0 and i=n∑ p i = 1.i=1The entropy value can vary from 0 (minimal) to 1 (maximum).If the probability <strong>of</strong> all components or reporters is thesame (same distribution) then the entropy is maximal. This isbecause the p i value is the same for all n. On the other extremeend, if there is only one component or reporter associated to aparticular bug type then the entropy becomes minimal (value<strong>of</strong> 0). The interpretation is that when entropy is low for aspecific bug type then it means a small set <strong>of</strong> components orreporters are associated with the specific bug type.Table III displays the component and reporter entropy andthe frequency values for all seven types <strong>of</strong> bug reports. Wenotice that not every bug report mentions the component name.We were not able to extract the component and reporter namefor all the bug reports in the experimental dataset and TableIII shows results for the bug reports for which we were ableto extract the component and reporter names (frequency ismentioned in brackets). The component entropy for crash andsecurity bug is 0.552 and 0.577 respectively which is relativelylower than the component entropy for performance (0.777)and usability (0.764) bugs. We notice that for the securitybug type, 242 out <strong>of</strong> 330 reports belong to only 2 out <strong>of</strong> 13components. There are 13 unique components assigned to 330security bug reports and 73.3% <strong>of</strong> the bugs (bug reports) areoriginating from only 2 out <strong>of</strong> 13 components. For the crashbug report type, we notice that 2617 (89.5%) out <strong>of</strong> 2922bug reports belong to 3 out <strong>of</strong> 14 components. Performancebug reports are distributed across multiple components: Internals(68/155), WebKit (36/155), UI (17/155), BrowserUI(15/155), Build (14/155), Misc (4/155) and Feature (1/155).The reporter entropy (0.781) for security bugs is relativelylower than the other types <strong>of</strong> bugs because we observe three reporters:security...@gtempaccount.com, cev...@chromium.organd aba...@chromium.org reported 48, 61 and 22 (out <strong>of</strong> 365bug reports for which we are able to extract the reporter name)bugs respectively.Khomh et al. [6] define the entopy graph for triaging crashbugs, we apply same concept in our study to better understandthe similarities and difference between the characteristics <strong>of</strong>various types <strong>of</strong> bug reports. Figure 1 presents the componentand reporter entropy graph derived from Table III. The x-axis represents the frequency (or the number) bracket andy-axis represents the entropy bracket. As shown in Figure1, performance and usability bugs fall into the category<strong>of</strong> relatively high entropy and relatively low number <strong>of</strong>incidents. We observe that regression and crash bugs havehigh frequency but fall in the middle bracket <strong>of</strong> reporterentropy. We believe that the entropy graph presented in Figure1 can be used by the project team to understand that impact<strong>of</strong> each type <strong>of</strong> bug report across both the dimensions <strong>of</strong>frequency and coverage (distribution across components anddistribution across reporters).B. <strong>Bug</strong> Fixing Process Quality and Performance Characteristics1) <strong>Bug</strong> Opening and Closing Trend and Continuity: Francalanciet al. [9] present an analysis <strong>of</strong> the performancecharacteristics (such as continuity and efficiency) <strong>of</strong> the bugfixing process. They identify performance indicators (bugopening and closing trend) reflecting the characteristics andquality <strong>of</strong> bug fixing process. We apply the concepts presentedby Francalanci et al. [9] in our study. They define bug openingtrend as the cumulated number <strong>of</strong> opened and verified bugsover time. In their paper, closing trend is defined as thecumulated number <strong>of</strong> bugs that are resolved and closed overtime. We plot the opening and closing trend for varioustypes <strong>of</strong> bugs on a graph and investigate the similarities anddifferences in their characteristics. Figure 2, 3 and 4 displaysthe opening and closing trend for crash, cleanup and securitybug reports and Figure 5, 6 and 7 displays the trends forperformance, polish and regression bug reports. At any instant<strong>of</strong> time, the difference between the two curves (interval) canbe computed to identify the number <strong>of</strong> bugs which are openat that instant <strong>of</strong> time. We notice that the debugging processis <strong>of</strong> high quality as there is no uncontrolled growth <strong>of</strong>unresolved bugs (the curve for the closing trend grows nearlyas fast or has the same slope as the curve for the opening trend)across all bug types [9] [10].All opening and closing trend graphs are plotted on the samescale and hence the differences between their characteristicsare visible. We see a noticeable and visible difference betweenthe trends for crash and regression bug reports in contrast toother types. The slope for the crash and regression curves isrelatively steep in comparison to other curves. It is interestingto note that for security bugs the opening and closing trendcurves almost overlap and this shows that in general thenumber <strong>of</strong> security bugs open at any instance <strong>of</strong> time isvery small. We notice that for regression bugs, the curveis steep (demonstrating a relatively large number <strong>of</strong> incomingand closed bugs) and yet the interval between the openingand closing curves is less (both the curves are near to eachother). The graph for usability bug is not plotted due to limitedspace in the paper but we observe the same characteristics forusability bugs as exhibited by performance and polish bugs.2) Mean Time to Repair and Release Date: We studymean time to repair (MTTR) the bug to understand quality<strong>of</strong> bug fixing process among different categories. MTTR iscomputed as the amount <strong>of</strong> time required to close a bug(difference between the bug reporting timestamp and bugclosing timestamp). The metric MTTR is measured in terms <strong>of</strong>number <strong>of</strong> hours. Results in Table IV indicates that amongstthe seven bug types, in general MTTR <strong>of</strong> crash bug reportsis lowest and that <strong>of</strong> performance and usability bugs is veryhigh. Even though the number <strong>of</strong> crash and regression bugreports are relatively higher in comparison to other types<strong>of</strong> bug reports (refer to Table II), the close time <strong>of</strong> crashand regression bug reports is relatively less (refer to TableIV). There is a noticeable difference and clear separation <strong>of</strong>520
Fig. 8. <strong>Bug</strong> Type: Crash Fig. 9. <strong>Bug</strong> Type: Cleanup Fig. 10. <strong>Bug</strong> Type: SecurityFig. 11. <strong>Bug</strong> Type: Performance Fig. 12. <strong>Bug</strong> Type: Usability Fig. 13. <strong>Bug</strong> Type: RegressionTABLE VEXAMPLES OF BUG TYPES FROM GOOGLE CHROMIUM BROWSER PROJECT (CRASH, PERFORMANCE, USABILITY)Type Issue ID Text Snippet from <strong>Bug</strong> <strong>Report</strong>Crash 24200 It is currently ranked #1 (based on the relative number <strong>of</strong> reports in the release). There have been68 reports from 50 clients.Crash 25823 the last step crashed on 4 timesCrash 36951 is overflowing with the below crash. There are about 60 crashes almost all <strong>of</strong> whichCrash 40472 Chrome crashed for more than 5 times with same stack traceCrash 101544 It crashes every time in less than a minutePerformance 104 Slow scrollingPerformance 3066 CPU maxes out, scrolling is laggyPerformance 11341 tends to load some pages slightly slower thanPerformance 32040 The script takes much longer to load and parse when there is more HTML on the page before itUsability 25767 If other people are also having trouble seeing this button, maybe it should be renamed or highlightedsomehow?Usability 83939 in many common Zoom use cases, the interface remains difficult to see and/or and interact withUsability 92027 feature must be introduced in Chromium (and Chrome Browser & OS) to improve multilingualismUsability 114402 we need to make some decisions about the use <strong>of</strong> this fontreport. Tables V and VI displays text snippets from some <strong>of</strong>the bug reports belonging to various categories. Some <strong>of</strong> theterms indicating the bug type (for example terms like slow,lag, longer for performance bugs and risk, malicious, exploitand corruption for security bugs) are marked as bold (referto Tables V and VI). We conduct experiments to identifyterms that are frequent or unique (linguistic indicators) toeach <strong>of</strong> the seven bug category. We extract all unique terms(corpus vocabulary) from titles and description <strong>of</strong> all bugreports present in our experimental dataset. We calculateprobability <strong>of</strong> each unique term corresponding to each bugcategory, using Naive Bayes classifier 10 . Table VII shows Top20 terms for each bug category sorted by their probability <strong>of</strong>occurrence in the respective category. Manual inspection <strong>of</strong>10 http://alias-i.com/lingpipe/docs/api/com/aliasi/classify/NaiveBayesClassifier.htmlTable VII clearly shows correlation between certain terms andbug category. For example, for crash, regression and securitybugs: “crash”, “regress”, and “secur” are highest probabilityterms respectively. Performance bug reports have terms such“perf”, “slow”, “time” and “cpu” as frequently occurring (system’sperformance indicator). Similarly, usability bug reportshave most frequent terms such as “window”, “user”, “zoom”,“menu” and “click” which captures the notion <strong>of</strong> user interfaceissues. Our experiment shows that words present in bugreport title and description are not random and we seeassociation between terms and bug types.We calculate the description length (number <strong>of</strong> characterspresent in the description) for each bug report in the experimentaldataset. Table VIII, displays the five-number summarystatistics for description length across seven different types <strong>of</strong>bug reports. The data in Table VIII reveals that the descriptionlength for crash and security bug is the highest whereas522
TABLE VIEXAMPLES OF BUG TYPES FROM GOOGLE CHROMIUM BROWSER PROJECT (POLISH, SECURITY, CLEANUP, REGRESSION)Type Issue ID Text Snippet from <strong>Bug</strong> <strong>Report</strong>Polish 94114 Several infobars are lacking punctuationPolish 51429 Bookmarks bubble (and extensions installed bubble) should have white backgroundPolish 89591 Misaligned text in HTML file input controlSecurity 1208 puts users at more risk from websites trying to spo<strong>of</strong> a file’s typeSecurity 23693 if the user is duped into clicking ”Create application shortcut” on a malicious pageSecurity 23979 We consider some file extensions to be maliciousSecurity 24733 because a given page can deterministically take down the whole browserSecurity 74665 This can lead to memory corruption and is probably exploitable too if you are clevercleanup 88098 Use javascript objects to make the ui code cleaner and easier to modifycleanup 30151 Toolstrip is obsolete, and these tests should be removed when toolstrip is removedcleanup 68882 src/gfx uses wstring all over. It should use string16Regression 115321 Tab crashes when coming out <strong>of</strong> the Full screen for the Sublime videosRegression 115934 Info bar <strong>of</strong>fers to save a wrong passwordTABLE VIIFREQUENT TERMS[CHROME-BROWSER]Top K CRASH REGR. SECUR. CLEAN POLISH PERF. USAB.1 crash regress secur should should regress page2 chrome crash crash remov bookmark page window3 report page chrome test button mac user4 stack tab us us window perf chrome5 signatur chrome memori code text time should6 webcor window corrupt move tab sync zoom7 browser bookmark file chrome menu test open8 const doesnt audit webkit bar releas doe9 Tab browser browser api dialog cycler manag10 Int open webcor need mac startup menu11 render work page browser page slow bookmark12 std render access content chrome tab provid13 mac broken window add need linux url14 page new webkit base icon new line15 ... text free clean drag veri dialog16 googl bar sandbox extens us chrome select17 intern show render refactor manag load command18 open button url view open us click19 char click bypass file select theme us20 unsign std open renam close cpu pluginTABLE VIIIDESCRIPTION LENGTHCRASH REGR. SECUR. CLEAN POLISH PERF. USAB.Min 7 5 22 3 11 54 64Q1 556 350 328 117.5 234.75 304.25 404Median 1021 550 743 225 396.5 537.5 593Q3 2909 859 1436 422.5 603 899.5 876Max 20057 19875 16233 9551 1837 3719 2886the description length <strong>of</strong> cleanup bug reports is the lowest.<strong>Bug</strong> reports belonging to crash types mostly consists <strong>of</strong> systemgenerated crash reports and hence size <strong>of</strong> description is largeas compare to other bug types where users have to provideentire content manually.D. Correlation Between Regression and other <strong>Bug</strong> <strong>Types</strong>A regression bug (one <strong>of</strong> the seven types <strong>of</strong> bug reportsin the evaluation dataset) can also belong to other categories(such as crash, polish and performance). We conduct experimentsto identify relation between regression bugs and othertypes <strong>of</strong> bugs. The motivation behind the experiment is toidentify bug-types which are more prone to cause regressionbugs. We extract all bug-type labels present in regression bugreports and then compute correlations. Table IX shows results<strong>of</strong> our experiment. Table IX reveals relatively high correlationbetween regression bugs and crash bugs (nearly 7% <strong>of</strong> all theregression bugs are crash bugs), however manual observation<strong>of</strong> 100 bugs (fixed/verified) shows different correlation. Wediscover that out <strong>of</strong> 100 regression bugs only 16 bugs belongto crash type and 43 bugs belong to the usability type. Furthermore,there are 31 bugs which can be categorized to any<strong>of</strong> usability, polish, or cleanup (based on our interpretation <strong>of</strong>bug description/discussion). We believe that a large number523
TABLE IXPERCENTAGE OF BUGS IN EACH BUG TYPE WHICH ALSO HAVEREGRESSION LABEL (RF: % OF REGRESSION BUGS)<strong>Bug</strong> Type Num %RFCRASH 207 7%SECURITY 0 0%CLEAN 0 0%POLISH 1 0.034%PERFORMANCE 15 0.51%USABILITY 0 0%TABLE XPERCENTAGE OF BUGS HAVING STATUS ”WON’T FIX” IN EACH BUG TYPE(MM: MEDIAN MTTR)<strong>Bug</strong> Type Num %WF %CL MMCRASH 1145 60.42% 25.51% 1320.91REGR. 501 26.44% 15.35% 390.97SECUR. 47 2.48% 11.38% 24.25CLEAN 103 5.43% 12.67% 4276.29POLISH 60 3.17% 20.27% 1643.94PERF. 68 3.59% 30.09% 1561.34USAB. 12 0.63% 25.53% 3195.29TABLE XIPERCENTAGE OF BUGS FOUND TO BE DUPLICATE IN EACH BUG TYPE ANDAMOUNT OF TIME REQUIRED IN THEIR RESOLUTION<strong>Bug</strong> Type Dupl.(%) MMCRASH 1783 (47.2%) 26.15REGRES. 775 (26.4%) 23.52SECUR. 31 (7.8%) 17.52CLEAN 39 (4.9%) 35.21POLISH 40 (15.3%) 24.13PERF. 24 (14.2%) 362.305USAB. 16 (42.1%) 1143.67TABLE XIIPERCENTAGE OF BUGS VERIFIED IN EACH BUG TYPE ((MM: MEDIANMTTR))<strong>Bug</strong> Type Num(%) MMCRASH 476 (12.26%) 167.8REGR. 855 (29.10%) 151.83SECUR. 51 (12.81%) 369.71CLEAN 64 (8%) 562.17POLISH 91 (34.86%) 474.95PERF. 33 (19.53%) 768.39USAB. 6 (15.79%) 6398.59<strong>of</strong> regression bugs are usability bugs because it is <strong>of</strong>tenchallenging to uncover them with test cases as usability bugmay be user specific. Some usability feature that is bug for oneuser may be perfectly fine for the other user or some specificbug may arise after performing series <strong>of</strong> steps by a specificuser [12].E. Status <strong>of</strong> Closed <strong>Bug</strong>sA Closed bug can have different status: such as verified,duplicate, WontFix. An analysis <strong>of</strong> different close bug statuscan have implications in understanding s<strong>of</strong>tware projectprocess. For example, a large percentage <strong>of</strong> duplicate bugreports indicate that bug reporters are not able to find the bugalready reported to the issue tracking system or large number<strong>of</strong> users are getting impacted by that bug. A large percentage<strong>of</strong> WontFix status (closed issues) for feature requests indicatesa mismatch between users need and developers priority. TableX displays the absolute number and percentage <strong>of</strong> bug reportsin each <strong>of</strong> the categories with the WontFix Label. In TableX “Num” represents actual count <strong>of</strong> WontFix bugs in eachbug type, “%WF” represents distribution <strong>of</strong> total wontfix bugsin each category, and “%CL” represents percenatge <strong>of</strong> closedand WontFix bugs in each category. According to GoogleChromium bug reporting guidelines 11 , the label WontFix isassigned to issues that cannot be reproduced, working asintended or obsolete. Issues tagged as WontFix are closedwithout taking any action. As shown in the Table X, thepercentage <strong>of</strong> WontFix varies for different types <strong>of</strong> bug reports.We observe that a large percentage (60.42%) <strong>of</strong> WonFix bugsbelong to crash-type. We perform a manual inspection <strong>of</strong> thecrash bug reports that are not fixed to indentify the underlyingreasons. We notice that not able to reproduce a bug is one<strong>of</strong> the major reasons for assigning the label WontFix to crash11 http://www.chromium.org/for-testers/bug-reporting-guidelinesbug reports. We also notice cases where a crash bug reportsare closed as they become obsolete and does not occur in thebuild or milestone which is different than the version on whichthe bug was observed. Regression bug reports also contributea significant percentage (26.44%) to WontFix bugs, whereascontribution <strong>of</strong> remaining five types <strong>of</strong> bug reports (security,cleanup, performance, polish and usability) is comparativelyvery small (less than 6%).We calculate number <strong>of</strong> duplicate bugs for each bug categorymotivated by the fact that large number (25-30%) <strong>of</strong>all reported bugs are duplicate [13]–[15]. Large number <strong>of</strong>duplicate bugs in a particular bug type can be an indicationthat large number <strong>of</strong> users are getting affected and can haveimplication on bug prioritizing. Duplicate bug report detectionhave received huge attention from the s<strong>of</strong>tware engineeringresearch community [11], [14]. Table XI shows that crashhave highest number <strong>of</strong> duplicate bugs 1783, i.e 68.2% <strong>of</strong>all labeled duplicate bugs. Result shows that 47.2%, 42.1%and 26.4% <strong>of</strong> all crash, usability and regression bugs areduplicate respectively. Table XI shows median MTTR value<strong>of</strong> usability bugs is fairly high as compared to othercategories. Research community can use these results to tunetheir duplicate detection approach/tool, and further researchcan be done to handle duplicate bugs as per the category theybelong to. We also study number <strong>of</strong> bugs verified in eachbug category. In Chrome project a bug fix can be verifiedby reporter or the testing team 12 . We calculated number <strong>of</strong>bugs verified in each category to identify whether there is anyinterest from reporters or testing team to verify bugs from aparticular bug type. Table XII shows that percentage <strong>of</strong> bugsthat are verified is higher in polish and regression bugcategory as compared to other bugs.12 http://www.chromium.org/for-testers/bug-reporting-guidelines524
TABLE XIIINUMBER OF STARSCRASH REGR. SECUR. CLEAN POLISH PERF. USAB.Min 1 0 0 0 0 0 1Q1 3 1 1 1 1 2 2Median 7 2 1 1 2 2 3Q3 12 5 2 2 3 5 9Max 179 647 59 28 40 78 391TABLE XIVNUMBER OF COMMENTSCRASH REGR. SECUR. CLEAN POLISH PERF. USAB.Min 0 0 1 1 1 1 2Q1 1 1 10 3 5 6 5Median 2 2 15 5 7 8 8Q3 3 5 22 8.5 12 14 26Max 219 647 81 71 76 59 126TABLE XVMILESTONE CHANGECRASH REGR. SECUR. CLEAN POLISH PERF. USAB.Num. BRs at leastone MoveFrom/BulkMove 2137 (56%) 2034 (69%) 37 (9.29%) 151 (18.9%) 165 (63.2%) 93 (55%) 33 (86.8%)Avg. 1.048 1.25 1 1.093 1 1.064 1.121Std. Dev. 0.350 0.209 0 0.420 0 0.383 0.477F. Number <strong>of</strong> Stars and Amount <strong>of</strong> DiscussionIn addition to bug reporter and bug fixer, several developersor users contribute to the threaded discussion and are interestedon activities related to the bug report. We compute number <strong>of</strong>stars and number <strong>of</strong> comments associated to a bug report.Our interest is to measure number <strong>of</strong> developers or personsshowing interest and collaborating for different bug types. InGoogle Chrome project, any user can star 13 an issue indicatingusers interest on a specific issue. The issue tracking systemautomatically sends an email notification (triggered by changein the status <strong>of</strong> the issue) to all the users who starred the issue.We extract both number <strong>of</strong> start and comments for all the bugreports using the programming APIs. Table XIII reveals that ingeneral crash, regression, performance and usability bugsreceive more stars than security, cleanup and polish bugs.The Q2 and Q3 value for number <strong>of</strong> stars for crash bugs ishighest in contrast to the other six types <strong>of</strong> bugs.The Google Issue Tracker provides a facility for users to discussand communicate with each-other by posting comments.The issue tracker is not just a database for archiving bugsbut also serves as an application that acts as a central point<strong>of</strong> communication for the project team [16]. We calculate thenumber <strong>of</strong> comments posted for each bug report and reportthe minimum, Q1, median, Q3 and maximum values in TableXIV. We observe that in general the number <strong>of</strong> commentsper bug report posted for security bug reports is relativelyhigher than other bug reports. The number <strong>of</strong> commentsper bug report (based on Q2 and Q3 values) for crash andregression bug reports is the lowest in contrast to other bugreports. Large number <strong>of</strong> personal interested (large star count13 http://code.google.com/p/support/wiki/IssueTrackeror lots <strong>of</strong> comments) in a bug is an indication <strong>of</strong> bug popularityand may impact bug fixing time [17]. Panjer et al. [17]foundthat bugs having less than four comments (less discussion) getfixed faster as compared to other bugs. Our empirical resultsshows a similar phenomenon; crash and regression have lowerQ2 value for number <strong>of</strong> comments and MTTR as comparedto other bug categories, refer to Table XIV and Table IV.G. Milestone Change FrequencyTable XV shows the absolute numbers and percentage <strong>of</strong>milestone changes for seven different types <strong>of</strong> bug reports.We notice that in general the percentage <strong>of</strong> milestone changesis high (more than 50%). The percentage <strong>of</strong> milestone changesfor crash, regression, polish, performance and usability bug reportsis more than 50%. We did a manual inspection <strong>of</strong> developercomments for bug reports undergoing milestone changeevent to understand the reason behind milestone changes. Wenotice comments mentioning approval <strong>of</strong> milestone changes ifthe reported bug is not a blocker for the currently assignedmilestone. According to the <strong>of</strong>ficial blog 14 by Chromiumproject team, Google Chrome is following the release earlyand release <strong>of</strong>ten policy (shorter release cycle : once everysix weeks). A blog 15 mentions that because <strong>of</strong> the rapidrelease cycle, if a feature is not ready then it is moved to thenext release (new release milestones are created and ticketsare moved). A study by Baysal et al. [18], compares thelifespan <strong>of</strong> major releases <strong>of</strong> FireFox and Chrome browsersand characterizes Chrome as a fast evolving system with short14 http://blog.chromium.org/2010/07/release-early-release-<strong>of</strong>ten.html15 http://blog.assembla.com/assemblablog/tabid/12618/bid/36341/Secrets-<strong>of</strong>-rapid-release-cycles-from-the-Google-Chrome-team.aspx525
version cycles. As shown in Table XV, the percentage <strong>of</strong>milestone changes for usability bug is the highest andcleanup bugs is the lowest. As illustrated in Table XV, weobserve different characteristics across different types <strong>of</strong> bug.V. THREATS TO VALIDITYThe empirical analysis presented in this paper is basedon dataset from only one project (Google Chrome Browser).Experimental analysis from several diverse projects is neededto generalize our results. Labeling a bug report with the type(security, performance, crash etc) is not mandatory for GoogleChrome project. We observe that a large number <strong>of</strong> bug reportsare not assigned any label. In our dataset, 8030 bug reports (astatistically significant number but not complete dataset) arelabeled with at least one <strong>of</strong> the bug type. Most <strong>of</strong> the resultsare based on 15.12% <strong>of</strong> all closed (fixed/verified/duplicate)bug reports. We observe that in our experimental dataset, theabsolute number <strong>of</strong> performance and usability bugs were notmany. Our future research direction is to extend our currentwork by conducting experiments on a more diverse dataset.VI. CONCLUSIONS AND FUTURE WORKIn this work, we perform empirical study <strong>of</strong> seven differenttypes <strong>of</strong> bug categories (crash, regression, security, polish,cleanup, usability, performance) and compare those usingdifferent metrics. Following are some <strong>of</strong> the main results <strong>of</strong>the work:• Median MTTR <strong>of</strong> crash and regression bugs is lowest.• Performance and usability belongs to high entropy andlow incident region.• Large number <strong>of</strong> regression bugs are usability bugs.• Terms present in bug report title and description arerelated to bug type.• Description length <strong>of</strong> crash bugs is largest.• Large number <strong>of</strong> crash bugs are resolved as WontFix andduplicate.• Fixing security bugs involves highest amount <strong>of</strong> discussion.• Milestone change for usability bugs is highest and forcleanup bugs is lowest.• <strong>Bug</strong> fixing process is <strong>of</strong> high quality among all the bugtypes (for Google Chrome Project).In this paper, we report experimental results on dataset fromGoogle Chrome browser project. We plan to extend our currentwork by conducting similar experiments on diverse datasetto generalize, compare and contrast findings across multipleprojects. Our empirical analysis opens many research questionsfor the s<strong>of</strong>tware engineering research community as itshows that different bug categories have different characteristicsand further research is needed to understand characteristics<strong>of</strong> each bug type.ACKNOWLEDGMENTThe work presented in this paper is partially supported bythe Department <strong>of</strong> Science and Technology (DST, India) FASTgrant awarded to Ashish Sureka.REFERENCES[1] A. Sureka, “Learning to classify bug reports into components.” inTOOLS (50), ser. Lecture Notes in Computer Science, C. A. Furia andS. Nanz, Eds., vol. 7304. Springer, 2012, pp. 288–303.[2] G. Antoniol, K. Ayari, M. Di Penta, F. Khomh, and Y.-G. Guéhéneuc,“Is it a bug or an enhancement?: a text-based approach to classifychange requests,” in Proceedings <strong>of</strong> the 2008 conference <strong>of</strong> the centerfor advanced studies on collaborative research: meeting <strong>of</strong> minds, ser.CASCON ’08. New York, NY, USA: ACM, 2008, pp. 23:304–23:318.[3] M. Gegick, P. Rotella, and T. Xie, “Identifying security bug reports viatext mining: An industrial case study,” in Proc. 7th Working Conferenceon Mining S<strong>of</strong>tware Repositories (MSR 2010), May 2010, pp. 11–20.[4] S. Zaman, B. Adams, and A. E. Hassan, “Security versus performancebugs: a case study on firefox,” in Proceedings <strong>of</strong> the 8th WorkingConference on Mining S<strong>of</strong>tware Repositories, ser. MSR ’11. New York,NY, USA: ACM, 2011, pp. 93–102.[5] M. B. Twidale and D. M. Nichols, “Exploring usability discussions inopen source development,” in Proceedings <strong>of</strong> the Proceedings <strong>of</strong> the 38thAnnual Hawaii International Conference on System Sciences - Volume07, ser. HICSS ’05. Washington, DC, USA: IEEE Computer Society,2005, pp. 198.3–.[6] F. Khomh, B. Chan, Y. Zou, and A. E. Hassan, “An entropy evaluationapproach for triaging field crashes: A case study <strong>of</strong> mozilla firefox,”in Proceedings <strong>of</strong> the 2011 18th Working Conference on ReverseEngineering, ser. WCRE ’11. Washington, DC, USA: IEEE ComputerSociety, 2011, pp. 261–270.[7] S. Zaman, B. Adams, and A. E. Hassan, “A qualitative study onperformance bugs,” in Proceedings <strong>of</strong> the 9th IEEE Working Conferenceon Mining S<strong>of</strong>tware Repositories (MSR), Zurich, Switzerland, June 2012.[8] C. E. Shannon, “A mathematical theory <strong>of</strong> communication,” SIGMO-BILE Mob. Comput. Commun. Rev., vol. 5, pp. 3–55, January 2001.[9] C. Francalanci and F. Merlo, “Empirical analysis <strong>of</strong> the bug fixingprocess in open source projects.” in OSS, ser. IFIP, B. Russo, E. Damiani,S. A. Hissam, B. Lundell, and G. Succi, Eds., vol. 275. Springer, 2008,pp. 187–196.[10] H. Wang and C. Wang, “Open source s<strong>of</strong>tware adoption: A status report,”IEEE S<strong>of</strong>tw., vol. 18, pp. 90–95, March 2001.[11] A. Sureka and P. Jalote, “Detecting duplicate bug report using charactern-gram-based features,” in Proceedings <strong>of</strong> the 2010 Asia Pacific S<strong>of</strong>twareEngineering Conference, ser. APSEC ’10. Washington, DC, USA: IEEEComputer Society, 2010, pp. 366–374.[12] D. M. Nichols and M. B. Twidale, “Usability processes in open sourceprojects,” S<strong>of</strong>tware Process: Improvement and Practice, vol. 11, no. 2,pp. 149–162, 2006.[13] J. Anvik, L. Hiew, and G. C. Murphy, “Who should fix this bug?” inProceedings <strong>of</strong> the 28th international conference on S<strong>of</strong>tware engineering,ser. ICSE ’06. New York, NY, USA: ACM, 2006, pp. 361–370.[14] X. Wang, L. Zhang, T. Xie, J. Anvik, and J. Sun, “An approach todetecting duplicate bug reports using natural language and executioninformation,” in Proceedings <strong>of</strong> the 30th international conference onS<strong>of</strong>tware engineering, ser. ICSE ’08. New York, NY, USA: ACM,2008, pp. 461–470.[15] N. Jalbert and W. Weimer, “Automated duplicate detection for bug trackingsystems,” in The 38th Annual IEEE/IFIP International Conferenceon Dependable Systems and Networks, DSN 2008, June 24-27, 2008,Anchorage, Alaska, USA, Proceedings. IEEE Computer Society, 2008,pp. 52–61.[16] D. Bertram, A. Voida, S. Greenberg, and R. Walker, “Communication,collaboration, and bugs: the social nature <strong>of</strong> issue tracking in small,collocated teams,” in Proceedings <strong>of</strong> the 2010 ACM conference onComputer supported cooperative work, ser. CSCW ’10. New York,NY, USA: ACM, 2010, pp. 291–300.[17] L. D. Panjer, “Predicting eclipse bug lifetimes,” in Proceedings <strong>of</strong> theFourth International Workshop on Mining S<strong>of</strong>tware Repositories, ser.MSR ’07. Washington, DC, USA: IEEE Computer Society, 2007, pp.29–.[18] O. Baysal, I. Davis, and M. W. Godfrey, “A tale <strong>of</strong> two browsers,”in Proceedings <strong>of</strong> the 8th Working Conference on Mining S<strong>of</strong>twareRepositories, ser. MSR ’11. New York, NY, USA: ACM, 2011, pp.238–241.526


