LAB 4 - Acceleration of Gravity - Web Physics - IUPUI
LAB 4 - Acceleration of Gravity - Web Physics - IUPUI
LAB 4 - Acceleration of Gravity - Web Physics - IUPUI

You also want an ePaper? Increase the reach of your titles
YUMPU automatically turns print PDFs into web optimized ePapers that Google loves.
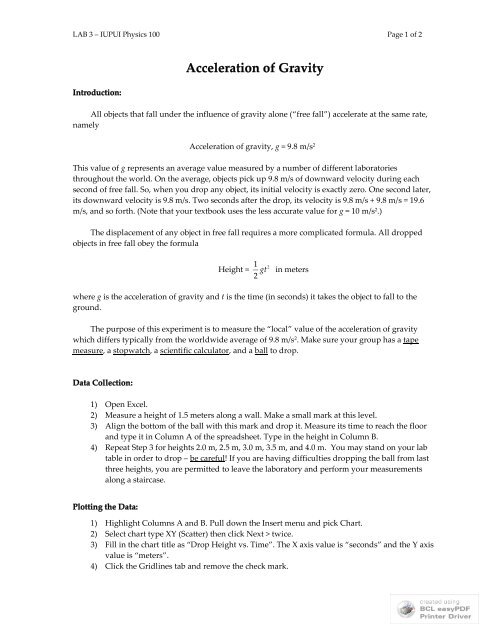
<strong>LAB</strong> 3 – <strong>IUPUI</strong> <strong>Physics</strong> 100 Page 1 <strong>of</strong> 2Introduction:<strong>Acceleration</strong> <strong>of</strong> <strong>Gravity</strong>All objects that fall under the influence <strong>of</strong> gravity alone (“free fall”) accelerate at the same rate,namely<strong>Acceleration</strong> <strong>of</strong> gravity, g = 9.8 m/s 2This value <strong>of</strong> g represents an average value measured by a number <strong>of</strong> different laboratoriesthroughout the world. On the average, objects pick up 9.8 m/s <strong>of</strong> downward velocity during eachsecond <strong>of</strong> free fall. So, when you drop any object, its initial velocity is exactly zero. One second later,its downward velocity is 9.8 m/s. Two seconds after the drop, its velocity is 9.8 m/s + 9.8 m/s = 19.6m/s, and so forth. (Note that your textbook uses the less accurate value for g = 10 m/s 2 .)The displacement <strong>of</strong> any object in free fall requires a more complicated formula. All droppedobjects in free fall obey the formulaHeight =1 gt2in meters2where g is the acceleration <strong>of</strong> gravity and t is the time (in seconds) it takes the object to fall to theground.The purpose <strong>of</strong> this experiment is to measure the “local” value <strong>of</strong> the acceleration <strong>of</strong> gravitywhich differs typically from the worldwide average <strong>of</strong> 9.8 m/s 2 . Make sure your group has a tapemeasure, a stopwatch, a scientific calculator, and a ball to drop.Data Collection:1) Open Excel.2) Measure a height <strong>of</strong> 1.5 meters along a wall. Make a small mark at this level.3) Align the bottom <strong>of</strong> the ball with this mark and drop it. Measure its time to reach the floorand type it in Column A <strong>of</strong> the spreadsheet. Type in the height in Column B.4) Repeat Step 3 for heights 2.0 m, 2.5 m, 3.0 m, 3.5 m, and 4.0 m. You may stand on your labtable in order to drop – be careful! If you are having difficulties dropping the ball from lastthree heights, you are permitted to leave the laboratory and perform your measurementsalong a staircase.Plotting the Data:1) Highlight Columns A and B. Pull down the Insert menu and pick Chart.2) Select chart type XY (Scatter) then click Next > twice.3) Fill in the chart title as “Drop Height vs. Time”. The X axis value is “seconds” and the Y axisvalue is “meters”.4) Click the Gridlines tab and remove the check mark.
<strong>LAB</strong> 3 – <strong>IUPUI</strong> <strong>Physics</strong> 100 Page 2 <strong>of</strong> 25) Click the Legends tab and remove the check mark, then click Next > and Finish. Your graphhas been inserted into your spreadsheet. Ask your instructor to inspect your graph beforeyou proceed to curve fitting.Curve Fitting:1) Select your graph. Little black boxes will appear in the corners.2) Pull down the Chart menu and pick Add Trendline. Select chart type Polynomial, Order 2.3) Click the Options tab and place a check next to Display equation on chart. Click OK. Be surethat your graph resembles the sample shown below.To finish this experiment, print out your graph and write your names at the top. On the reverseside <strong>of</strong> your graph, answer the following questions in complete sentences:1. Use your formula to find the local value <strong>of</strong> the acceleration <strong>of</strong> gravity by simplymultiplying the coefficient <strong>of</strong> the x 2 term by 2. Write your answer as “g = m/s 2 ”.(For the sample data below, g = 2 × 5.3859 = 10.7718 m/s 2 .)2. Describe at least two ways to improve the accuracy <strong>of</strong> your height measurements.3. Describe at least two ways to improve the accuracy <strong>of</strong> your time measurements.TURN IN YOUR GRAPH AND THE ANSWERS TO THE QUESTIONSBEFORE YOU LEAVE THE <strong>LAB</strong>.4.5Drop Height vs. Timey = 5.3859x 2 - 0.5216x + 0.118243.5meters32.521.510.5 0.6 0.7 0.8 0.9 1seconds