Renewable Energy Handbook 2010 - Department of Finance - The ...
Renewable Energy Handbook 2010 - Department of Finance - The ...
Renewable Energy Handbook 2010 - Department of Finance - The ...

You also want an ePaper? Increase the reach of your titles
YUMPU automatically turns print PDFs into web optimized ePapers that Google loves.
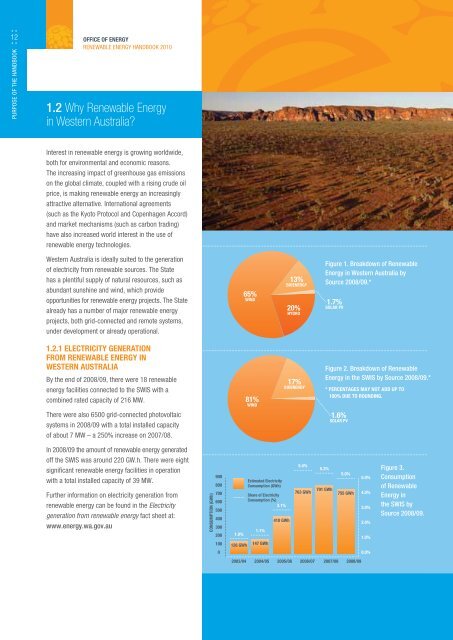
12PURPOSE OF THE HANDBOOKOFFICE OF ENERGYRENEWABLE ENERGY HANDBOOK <strong>2010</strong>1.2 Why <strong>Renewable</strong> <strong>Energy</strong>in Western Australia?Interest in renewable energy is growing worldwide,both for environmental and economic reasons.<strong>The</strong> increasing impact <strong>of</strong> greenhouse gas emissionson the global climate, coupled with a rising crude oilprice, is making renewable energy an increasinglyattractive alternative. International agreements(such as the Kyoto Protocol and Copenhagen Accord)and market mechanisms (such as carbon trading)have also increased world interest in the use <strong>of</strong>renewable energy technologies.Western Australia is ideally suited to the generation<strong>of</strong> electricity from renewable sources. <strong>The</strong> Statehas a plentiful supply <strong>of</strong> natural resources, such asabundant sunshine and wind, which provideopportunities for renewable energy projects. <strong>The</strong> Statealready has a number <strong>of</strong> major renewable energyprojects, both grid-connected and remote systems,under development or already operational.13%BIOENERGY65%WIND20%HYDROFigure 1. Breakdown <strong>of</strong> <strong>Renewable</strong><strong>Energy</strong> in Western Australia bySource 2008/09.*1.7%SOLAR PV1.2.1 ELECTRICITY GENERATIONFROM RENEWABLE ENERGY INWESTERN AUSTRALIABy the end <strong>of</strong> 2008/09, there were 18 renewableenergy facilities connected to the SWIS with acombined rated capacity <strong>of</strong> 216 MW.81%17%BIOENERGYFigure 2. Breakdown <strong>of</strong> <strong>Renewable</strong><strong>Energy</strong> in the SWIS by Source 2008/09.** PERCENTAGES MAY NOT ADD UP TO100% DUE TO ROUNDING.<strong>The</strong>re were also 6500 grid-connected photovoltaicsystems in 2008/09 with a total installed capacity<strong>of</strong> about 7 MW – a 250% increase on 2007/08.WIND1.6%SOLAR PVIn 2008/09 the amount <strong>of</strong> renewable energy generated<strong>of</strong>f the SWIS was around 220 GW.h. <strong>The</strong>re were eightsignifi cant renewable energy facilities in operationwith a total installed capacity <strong>of</strong> 39 MW.Further information on electricity generation fromrenewable energy can be found in the Electricitygeneration from renewable energy fact sheet at:www.energy.wa.gov.auCONSUMPTION (GWh)90080070060050040030020010001.0%Estimated ElectricityConsumption (GWh)Share <strong>of</strong> ElectricityConsumption (%)3.1%1.1%126 GWh 147 GWh410 GWh5.4%763 GWh5.3%791 GWh5.0%755 GWh5.0%4.0%3.0%2.0%1.0%0.0%Figure 3.Consumption<strong>of</strong> <strong>Renewable</strong><strong>Energy</strong> inthe SWIS bySource 2008/09.2003/04 2004/05 2005/06 2006/07 2007/08 2008/09