Introduction to MetID Solution Software for Structural ... - Shimadzu
Introduction to MetID Solution Software for Structural ... - Shimadzu
Introduction to MetID Solution Software for Structural ... - Shimadzu

Create successful ePaper yourself
Turn your PDF publications into a flip-book with our unique Google optimized e-Paper software.
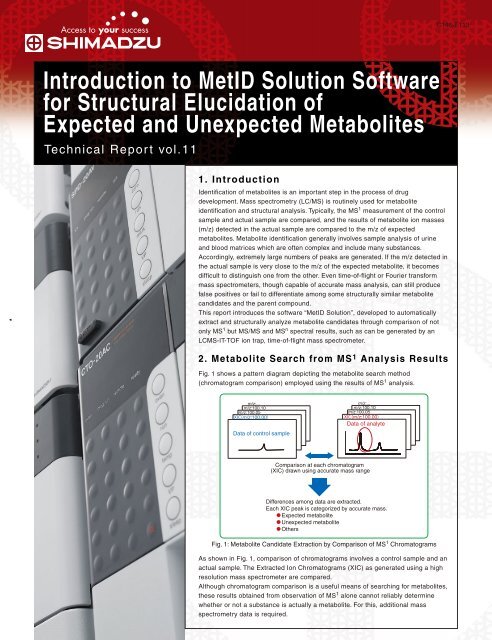
C146-E113<strong>Introduction</strong> <strong>to</strong> <strong>MetID</strong> <strong>Solution</strong> <strong>Software</strong><strong>for</strong> <strong>Structural</strong> Elucidation ofExpected and Unexpected MetabolitesTechnical Report vol.111. <strong>Introduction</strong>Identification of metabolites is an important step in the process of drugdevelopment. Mass spectrometry (LC/MS) is routinely used <strong>for</strong> metaboliteidentification and structural analysis. Typically, the MS 1 measurement of the controlsample and actual sample are compared, and the results of metabolite ion masses(m/z) detected in the actual sample are compared <strong>to</strong> the m/z of expectedmetabolites. Metabolite identification generally involves sample analysis of urineand blood matrices which are often complex and include many substances.Accordingly, extremely large numbers of peaks are generated. If the m/z detected inthe actual sample is very close <strong>to</strong> the m/z of the expected metabolite, it becomesdifficult <strong>to</strong> distinguish one from the other. Even time-of-flight or Fourier trans<strong>for</strong>mmass spectrometers, though capable of accurate mass analysis, can still producefalse positives or fail <strong>to</strong> differentiate among some structurally similar metabolitecandidates and the parent compound.This report introduces the software “<strong>MetID</strong> <strong>Solution</strong>”, developed <strong>to</strong> au<strong>to</strong>maticallyextract and structurally analyze metabolite candidates through comparison of no<strong>to</strong>nly MS 1 but MS/MS and MS n spectral results, such as can be generated by anLCMS-IT-TOF ion trap, time-of-flight mass spectrometer.2. Metabolite Search from MS 1 Analysis ResultsFig. 1 shows a pattern diagram depicting the metabolite search method(chroma<strong>to</strong>gram comparison) employed using the results of MS 1 analysis.Data of control sampleData of analyteComparison at each chroma<strong>to</strong>gram(XIC) drawn using accurate mass rangeDifferences among data are extracted.Each XIC peak is categorized by accurate mass.Expected metaboliteUnexpected metaboliteOthersFig. 1: Metabolite Candidate Extraction by Comparison of MS 1 Chroma<strong>to</strong>gramsAs shown in Fig. 1, comparison of chroma<strong>to</strong>grams involves a control sample and anactual sample. The Extracted Ion Chroma<strong>to</strong>grams (XIC) as generated using a highresolution mass spectrometer are compared.Although chroma<strong>to</strong>gram comparison is a useful means of searching <strong>for</strong> metabolites,these results obtained from observation of MS 1 alone cannot reliably determinewhether or not a substance is actually a metabolite. For this, additional massspectrometry data is required.
3. Including <strong>Structural</strong> In<strong>for</strong>mation <strong>for</strong> ComparisonOne method <strong>for</strong> determining whether or not a substance is ametabolite is <strong>to</strong> compare the MS/MS spectrum of each substance inthe actual sample with that of the parent drug. Basically, if a parentcompound is metabolized, there is a strong possibility thatmetabolites will maintain partial structural integrity with respect <strong>to</strong>the original compound. Thus, commonalities (fragment ions orneutral loss) would be expected in the results of MS/MSmeasurement of the parent compound and its metabolites.With the LCMS-IT-TOF, which is capable of high-speed MS/MSanalysis, a large number of MS/MS spectra can be obtained from asingle analysis of an actual sample.<strong>MetID</strong> <strong>Solution</strong> software au<strong>to</strong>matically finds the precursor ions in theMS/MS spectra having commonalities with the parent compound,and generates a table of common fragment ions and neutral losses.This process is depicted in the pattern diagram below.Large number of MS/MS spectra obtainedParent compound MS/MS spectrumMS/MS spectra obtainedfrom analyteStatistical processingof MS/MS spectraProbability of metabolites in case of commonalty in MS/MS spectraParent compound MS/MS spectrum and respective MS/MS spectra of analyte are subjected <strong>to</strong> partial least squares (PLS).MS/MS spectra having commonalities with parent compound MS/MS spectrum are quickly extracted.Fig. 2: Metabolite Candidate Extraction by Statistical Processing of MS/MS Spectra4. <strong>MetID</strong> <strong>Solution</strong> Features<strong>MetID</strong> <strong>Solution</strong> software is a <strong>to</strong>ol that utilizes a dual approach <strong>to</strong> improve the efficiency and reliability of metabolite identification.Data usedMethodFeaturesAdvantagesShortcomingMS 1Chroma<strong>to</strong>gram ComparisonDifferences are extracted by comparingcontrol sample and actual samplechroma<strong>to</strong>grams (XIC).Conceptually easy. Possible with anymass spectrometer.Possible with any mass spectrometer.Applicable <strong>for</strong> non-targeted search(no au<strong>to</strong>mated reference).Depends greatly on data repeatability.It takes time <strong>to</strong> accurately compare theXIC <strong>for</strong> all mass regions.Requires control samplesMS/MS (up <strong>to</strong> MS n )MS/MS Spectral ComparisonMS/MS spectra having commonalities withreferenced parent compound MS/MSspectrum are extracted.Fast, highly reliable.Control sample is not required.Uses PLS statistics <strong>to</strong> help find metabolites quickly.High robustness with respect <strong>to</strong> analytical conditions.2
5-1. Measurement ExampleA metabolite sample of verapamil (C27H38N2O4: MW 454.283), a compound in which the principle metabolitesare known, was measured by LCMS-IT-TOF, and data processing was conducting using <strong>MetID</strong> <strong>Solution</strong>.Fig. 3: Verapamil <strong>Structural</strong> Formula — A <strong>to</strong> E indicate cleavage sites.Fig. 4: Verapamil MS/MS Spectrum —indicates neutral loss.5-2. Determination of Metabolites by Chroma<strong>to</strong>gram ComparisonPeak absent in controlsample XIC is presentin actual sample XIC.XIC (control sample)XIC (actual sample)Trans<strong>for</strong>mation listPossibility of metaboliteMS spectrumPeak table of expected metabolitesPeak table of unexpected metabolitesPeak table of othersFig. 5: Chroma<strong>to</strong>gram Comparison Results Window3
5-3. Determination of Metabolites by MS/MS Spectral ComparisonPoints of commonality between the parent compound MS/MSspectrum and the precursor ion in the analyte are indicated withpositive values in the horizontal axis direction.In this example, four types of metabolites were detected.In addition, fragment ions in common and neutral loss in<strong>for</strong>mationare au<strong>to</strong>matically summarized in the table.Fig. 6: MS/MS Spectral Comparison Results Window (partial)5-4. Metabolite Structure Prediction by MS/MS Spectral ComparisonLooking at P#141 (m/z 441.2737, RT 14.100) as the most relevantion indicated in the horizontal axis, the mass difference (-14.0151Da) with respect <strong>to</strong> the parent compound suggests that itcorresponds <strong>to</strong> the neutral loss of CH2 (14.0157), or in other words,that demethylation occurred. In addition, signals associated with theB neutral loss and the fragment ions corresponding <strong>to</strong> D and Eshown in Fig. 3 were also found in the MS/MS spectrum of P#141.This result suggests that the structures of the B neutral loss part andthose of D and E are consistent with the overall structure of theoriginal compound and P#141.B neutral loss and EFig. 7: Predicted Structure <strong>for</strong> P#141Demethylation probably occurred <strong>to</strong> one of these methyl groups.One of the principle metabolites of verapamil is norverapamil (C26H36N2O4:MW 440.267). This structure does not contradict the in<strong>for</strong>mation obtained fromthe MS/MS spectrum of P#141.Fig. 8: <strong>Structural</strong> Formula of NorverapamilFounded in 1875, <strong>Shimadzu</strong> Corporation, a leader in thedevelopment of advanced technologies, has a distinguishedhis<strong>to</strong>ry of innovation built on the foundation of contributing <strong>to</strong>society through science and technology. We maintain a globalnetwork of sales, service, technical support and applicationscenters on six continents, and have established long-termrelationships with a host of highly trained distribu<strong>to</strong>rs locatedin over 100 countries. For in<strong>for</strong>mation about <strong>Shimadzu</strong>, and <strong>to</strong>contact your local office, please visit our Web site atwww.shimadzu.comJQA-0376SHIMADZU CORPORATION. International Marketing Division3. Kanda-Nishikicho 1-chome, Chiyoda-ku, Tokyo 101-8448, JapanPhone: 81(3)3219-5641 Fax. 81(3)3219-5710URL http://www.shimadzu.comThe contents of this brochure are subject <strong>to</strong> change without notice.Printed in Japan 3295-12717-30ANS