- Page 2 and 3:
AJAX and PHPBuilding Responsive Web
- Page 4 and 5:
CreditsAuthorsCristian DarieBrinzar
- Page 6 and 7:
Filip Cherecheş-Toşa is a web dev
- Page 8 and 9:
Table of ContentsPreface 1Chapter 1
- Page 11 and 12:
Table of ContentsPreparing Your *ni
- Page 13 and 14:
PrefaceWhat This Book CoversChapter
- Page 15 and 16:
PrefaceAny command-line input and o
- Page 17 and 18:
O}EN PORTADAEl aborto...más allá
- Page 19 and 20:
Chapter 1Because end-user satisfact
- Page 21 and 22:
Chapter 1Three points for you to ke
- Page 23 and 24:
Chapter 1With JavaScript, developer
- Page 25 and 26:
interrupting the user from his or h
- Page 27 and 28:
• Creating simple online chat sol
- Page 29 and 30:
Chapter 1done typing. (This method
- Page 31 and 32:
Chapter 1All exercises from this bo
- Page 33 and 34:
etrieve the user name$name = $_GET[
- Page 35:
Chapter 1If you're curious to test
- Page 38 and 39:
AJAX and the Future of Web Applicat
- Page 40 and 41:
Client-Side Techniques with Smarter
- Page 42 and 43:
Client-Side Techniques with Smarter
- Page 44 and 45:
Client-Side Techniques with Smarter
- Page 46 and 47:
Client-Side Techniques with Smarter
- Page 48 and 49:
Client-Side Techniques with Smarter
- Page 51 and 52:
Chapter 2font-size: 10pt;}.TableCon
- Page 53 and 54:
Chapter 2Creating the XMLHttpReques
- Page 55 and 56:
Chapter 2You could, for example, ch
- Page 57 and 58:
You will learn the most interesting
- Page 59 and 60:
Chapter 2The safer version of proce
- Page 61 and 62:
Chapter 24. Create a file called as
- Page 63 and 64:
Chapter 2Figure 2.6: The Four HTTP
- Page 65 and 66:
Chapter 2}}else{// display status m
- Page 67 and 68:
Chapter 2}{// try to create XMLHttp
- Page 69 and 70:
Chapter 2The responseXML method of
- Page 71 and 72:
Chapter 2Figure 2.10: Opera Display
- Page 73 and 74:
I admit that the following piece of
- Page 75 and 76:
3Server-Side Techniqueswith PHP and
- Page 77 and 78:
Chapter 3}for (var i=0; i
- Page 79 and 80:
Chapter 3// create the element$boo
- Page 81 and 82:
Chapter 3// create the root elemen
- Page 83 and 84:
Chapter 3// read a file from the se
- Page 85 and 86:
Chapter 3Figure 3.3: PHP Parameters
- Page 87 and 88:
Chapter 3Without the customized err
- Page 89 and 90:
}}// display the error in case of f
- Page 91 and 92:
Chapter 3Figure 3.7: Connecting to
- Page 93 and 94:
Chapter 3}}// continue only if HTTP
- Page 95 and 96:
Chapter 3You can make Firefox liste
- Page 97 and 98:
Chapter 3}"MSXML2.XMLHTTP.4.0","MSX
- Page 99 and 100:
'TEXT: ' . $errStr . chr(10) .'LOCA
- Page 101 and 102:
etrieve the parameters$num = 1; //
- Page 103 and 104:
Chapter 3Figure 3.16: Flowchart Des
- Page 105 and 106:
}Chapter 3// only continue if xmlHt
- Page 107 and 108:
}throw(response.length == 0 ? "Serv
- Page 109 and 110:
function process(){// ...if (reques
- Page 111 and 112:
Chapter 3Working with MySQLA back-e
- Page 113 and 114:
Chapter 3Figure 3.17: Executing SQL
- Page 115 and 116:
Chapter 3SELECT user_id, user_name
- Page 117 and 118:
3. In your foundations folder, crea
- Page 119 and 120:
Chapter 3After these commands execu
- Page 121 and 122:
Chapter 3• friendly.php is a PHP
- Page 123 and 124:
This example requires a JavaScript-
- Page 125 and 126:
}}// try to connect to the servertr
- Page 127 and 128:
Chapter 3}// create HTML-formatted
- Page 129:
Chapter 3On the server side, all th
- Page 132 and 133:
AJAX Form ValidationThe code in thi
- Page 134 and 135:
AJAX Form ValidationFigure 4.2: The
- Page 136 and 137:
AJAX Form ValidationNote that deali
- Page 138 and 139:
AJAX Form Validation"3" => "March",
- Page 140 and 141:
AJAX Form Validationclass="">Please
- Page 142 and 143:
AJAX Form Validation}}alert("Error
- Page 144 and 145:
AJAX Form Validation// output the e
- Page 146 and 147:
AJAX Form Validationbreak;}}// Chec
- Page 148 and 149:
AJAX Form Validationprivate functio
- Page 150 and 151:
AJAX Form ValidationThe onblur even
- Page 152 and 153: AJAX Form ValidationAfter this basi
- Page 154 and 155: AJAX Form ValidationSummaryWhile we
- Page 156 and 157: AJAX ChatFigure 5.1: MeeboMeebo off
- Page 158 and 159: AJAX ChatThe messages for the AJAX
- Page 160 and 161: AJAX Chat// destructor closes datab
- Page 162 and 163: AJAX Chat}}?>8. Create another file
- Page 164 and 165: AJAX Chat/* creates an XMLHttpReque
- Page 166 and 167: AJAX Chat}}xmlHttpGetMessages.send(
- Page 168 and 169: AJAX Chatfunction handleKey(e){// g
- Page 170 and 171: AJAX Chat12. After having talked ab
- Page 172 and 173: AJAX ChatOn pressing the Send butto
- Page 174 and 175: AJAX ChatSummaryAt the beginning of
- Page 176 and 177: AJAX Suggest and AutocompleteIt's a
- Page 178 and 179: AJAX Suggest and AutocompleteTime f
- Page 180 and 181: AJAX Suggest and Autocomplete170'FR
- Page 182 and 183: AJAX Suggest and Autocomplete10. Cr
- Page 184 and 185: AJAX Suggest and Autocomplete}if(ca
- Page 186 and 187: AJAX Suggest and Autocomplete}if(re
- Page 188 and 189: AJAX Suggest and Autocomplete}var k
- Page 190 and 191: AJAX Suggest and AutocompletecrtLin
- Page 192 and 193: AJAX Suggest and AutocompleteFigure
- Page 194 and 195: AJAX Suggest and Autocompletewant c
- Page 196 and 197: AJAX Suggest and AutocompleteNext,
- Page 198 and 199: AJAX Suggest and Autocompletein sug
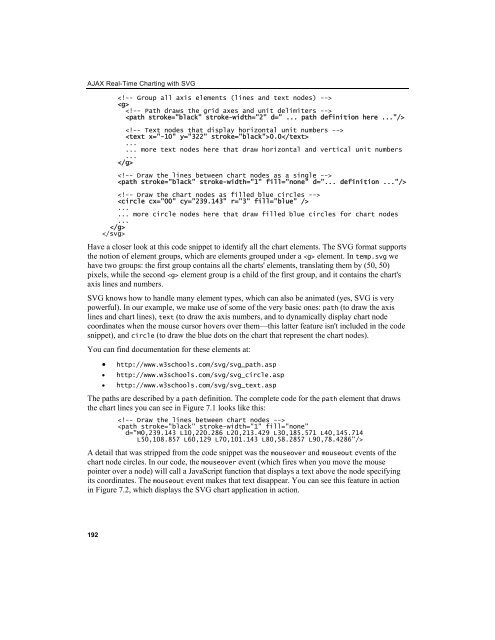
- Page 200 and 201: AJAX Real-Time Charting with SVGFor
- Page 204 and 205: AJAX Real-Time Charting with SVG3.
- Page 206 and 207: AJAX Real-Time Charting with SVG//
- Page 208 and 209: AJAX Real-Time Charting with SVG//
- Page 210 and 211: AJAX Real-Time Charting with SVGcoo
- Page 212 and 213: AJAX Real-Time Charting with SVG•
- Page 214 and 215: AJAX GridImplementing the AJAX Grid
- Page 216 and 217: AJAX GridCREATE TABLE product(produ
- Page 218 and 219: AJAX Grid}// execute the queryif ($
- Page 220 and 221: AJAX Grid// clear any output that h
- Page 222 and 223: AJAX Grid212// the id of the grid d
- Page 224 and 225: AJAX Grid// handle receiving the se
- Page 226 and 227: AJAX Grid// handle receiving a resp
- Page 228 and 229: AJAX GridAs usual on the server, we
- Page 230 and 231: AJAX Grid220}{}stylesheetDoc = crea
- Page 233 and 234: 9AJAX RSS ReaderIn the last few yea
- Page 235 and 236: Chapter 9Figure 9.1: Managing RSS S
- Page 237 and 238: header('Pragma: no-cache');header('
- Page 239 and 240: Chapter 9Loading feed...About the A
- Page 241 and 242: Chapter 9}// continue if the proces
- Page 243 and 244: Chapter 9}width: 410px;background-c
- Page 245 and 246: And finally, we send the HTTP reque
- Page 247 and 248: 10AJAX Drag and DropWhen drag-and-d
- Page 249 and 250: Chapter 10The Prototype features ar
- Page 251 and 252: Chapter 10When dropping a task on t
- Page 253 and 254:
Chapter 10DROP HERE TO DELETE7. Cre
- Page 255 and 256:
header('Expires: Fri, 25 Dec 1980 0
- Page 257 and 258:
Chapter 10}}}else if (action =="del
- Page 259 and 260:
Chapter 1011. Load http://localhost
- Page 261 and 262:
details are saved using a cache sys
- Page 263:
Chapter 10SummaryThis is it! You've
- Page 266 and 267:
Preparing Your Working EnvironmentT
- Page 268 and 269:
Preparing Your Working EnvironmentA
- Page 270 and 271:
Preparing Your Working Environment1
- Page 272 and 273:
Preparing Your Working EnvironmentA
- Page 274 and 275:
Preparing Your Working Environment6
- Page 276 and 277:
IndexAabort() method, XMLHttpReques
- Page 278 and 279:
exception handling, JavaScript, 43
- Page 280 and 281:
PHP Parameters and Error Handlingre
- Page 282:
updateChart() function, realTimeCha


