Mapping winegrape quality attributes using portable fluorescence ...
Mapping winegrape quality attributes using portable fluorescence ...
Mapping winegrape quality attributes using portable fluorescence ...

Create successful ePaper yourself
Turn your PDF publications into a flip-book with our unique Google optimized e-Paper software.
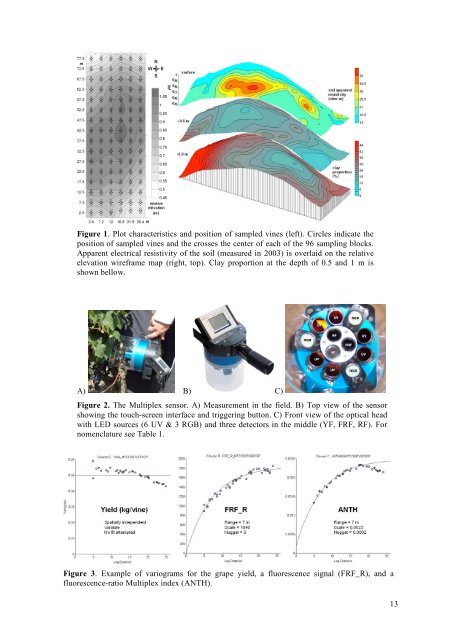
Figure 1. Plot characteristics and position of sampled vines (left). Circles indicate theposition of sampled vines and the crosses the center of each of the 96 sampling blocks.Apparent electrical resistivity of the soil (measured in 2003) is overlaid on the relativeelevation wireframe map (right, top). Clay proportion at the depth of 0.5 and 1 m isshown bellow.A) B) C)Figure 2. The Multiplex sensor. A) Measurement in the field. B) Top view of the sensorshowing the touch-screen interface and triggering button. C) Front view of the optical headwith LED sources (6 UV & 3 RGB) and three detectors in the middle (YF, FRF, RF). Fornomenclature see Table 1.Figure 3. Example of variograms for the grape yield, a <strong>fluorescence</strong> signal (FRF_R), and a<strong>fluorescence</strong>-ratio Multiplex index (ANTH).13