Mapping winegrape quality attributes using portable fluorescence ...
Mapping winegrape quality attributes using portable fluorescence ...
Mapping winegrape quality attributes using portable fluorescence ...
You also want an ePaper? Increase the reach of your titles
YUMPU automatically turns print PDFs into web optimized ePapers that Google loves.
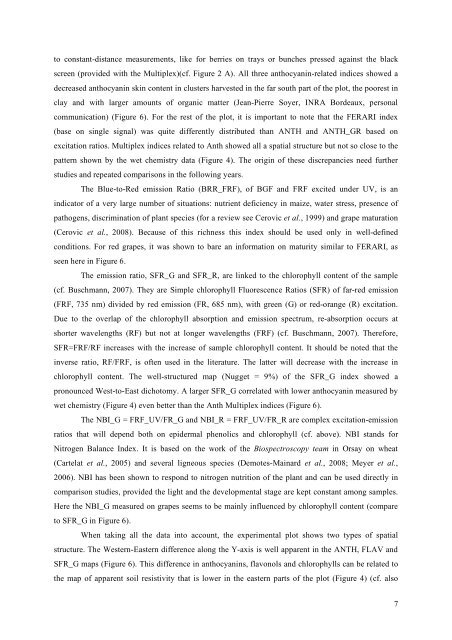
to constant-distance measurements, like for berries on trays or bunches pressed against the blackscreen (provided with the Multiplex)(cf. Figure 2 A). All three anthocyanin-related indices showed adecreased anthocyanin skin content in clusters harvested in the far south part of the plot, the poorest inclay and with larger amounts of organic matter (Jean-Pierre Soyer, INRA Bordeaux, personalcommunication) (Figure 6). For the rest of the plot, it is important to note that the FERARI index(base on single signal) was quite differently distributed than ANTH and ANTH_GR based onexcitation ratios. Multiplex indices related to Anth showed all a spatial structure but not so close to thepattern shown by the wet chemistry data (Figure 4). The origin of these discrepancies need furtherstudies and repeated comparisons in the following years.The Blue-to-Red emission Ratio (BRR_FRF), of BGF and FRF excited under UV, is anindicator of a very large number of situations: nutrient deficiency in maize, water stress, presence ofpathogens, discrimination of plant species (for a review see Cerovic et al., 1999) and grape maturation(Cerovic et al., 2008). Because of this richness this index should be used only in well-definedconditions. For red grapes, it was shown to bare an information on maturity similar to FERARI, asseen here in Figure 6.The emission ratio, SFR_G and SFR_R, are linked to the chlorophyll content of the sample(cf. Buschmann, 2007). They are Simple chlorophyll Fluorescence Ratios (SFR) of far-red emission(FRF, 735 nm) divided by red emission (FR, 685 nm), with green (G) or red-orange (R) excitation.Due to the overlap of the chlorophyll absorption and emission spectrum, re-absorption occurs atshorter wavelengths (RF) but not at longer wavelengths (FRF) (cf. Buschmann, 2007). Therefore,SFR=FRF/RF increases with the increase of sample chlorophyll content. It should be noted that theinverse ratio, RF/FRF, is often used in the literature. The latter will decrease with the increase inchlorophyll content. The well-structured map (Nugget = 9%) of the SFR_G index showed apronounced West-to-East dichotomy. A larger SFR_G correlated with lower anthocyanin measured bywet chemistry (Figure 4) even better than the Anth Multiplex indices (Figure 6).The NBI_G = FRF_UV/FR_G and NBI_R = FRF_UV/FR_R are complex excitation-emissionratios that will depend both on epidermal phenolics and chlorophyll (cf. above). NBI stands forNitrogen Balance Index. It is based on the work of the Biospectroscopy team in Orsay on wheat(Cartelat et al., 2005) and several ligneous species (Demotes-Mainard et al., 2008; Meyer et al.,2006). NBI has been shown to respond to nitrogen nutrition of the plant and can be used directly incomparison studies, provided the light and the developmental stage are kept constant among samples.Here the NBI_G measured on grapes seems to be mainly influenced by chlorophyll content (compareto SFR_G in Figure 6).When taking all the data into account, the experimental plot shows two types of spatialstructure. The Western-Eastern difference along the Y-axis is well apparent in the ANTH, FLAV andSFR_G maps (Figure 6). This difference in anthocyanins, flavonols and chlorophylls can be related tothe map of apparent soil resistivity that is lower in the eastern parts of the plot (Figure 4) (cf. also7


