Television Viewership Trends : LSM 1-4 - SABC
Television Viewership Trends : LSM 1-4 - SABC
Television Viewership Trends : LSM 1-4 - SABC

You also want an ePaper? Increase the reach of your titles
YUMPU automatically turns print PDFs into web optimized ePapers that Google loves.
Local Media Landscape: Media retains audiencesaccording to SAARF AMPS 2011 surveyAccording to AMPS Jan-Dec ‘11, Total TV viewing has increased to 90.8% of all South African adults in anygiven week, substantially up from 88.5% for AMPS Jan-Dec ‘10. Several channels show increases.Radio listening has increased in total and for commercial radio. Community radio remains stable. Radiogrew from 91.4% (AMPS Jan-Dec ‘10) reach on a past-seven-day basis to 92.7% (AMPS Jan-Dec’11).Newspaper reach is trending upward for dailies, weeklies and in total - 48.9% average issue readershipagainst Adults 15+ for AMPS 2011. Magazine readership remains stable with 50.5% of Adults 15+claiming to have read any Magazine.Internet usage continues to grow significantly against the frequency usage parameters for yesterday,weekly and past 4 weeks. Significant increases noted for Adults 15+, Men, <strong>LSM</strong> 9-10 and the 15-34 agegroup.Claimed exposure to Out of Home advertising on dustbins has increased significantly;bus shelter and trailer advertising exposure has decreased.Cinema attendance is significantly down against Adults 15+, <strong>LSM</strong> 9-10 and in Gauteng, Kwazulu Nataland Western Cape.
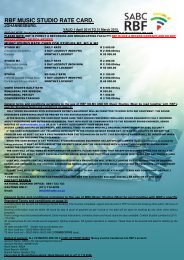
Percentage %Source: AMPS<strong>Television</strong> <strong>Viewership</strong> <strong>Trends</strong> : All Adults 15+100<strong>SABC</strong> TV showingan upwardtrend in weeklyviewership forADULTS 15+806040200ANY TV - P7D <strong>SABC</strong> 1 - P7D <strong>SABC</strong> 2 - P7D <strong>SABC</strong> 3 - P7DAMPS 2010 (Jan 2010-Dec 2010) 88.5 76.8 66.8 54.7AMPS 2011 (Jul 2010-Jun 2011) 90.3 78.1 68.4 55.4AMPS 2011 (Jan 2011-Dec 2011) 90.8 79.1 70.7 57.4
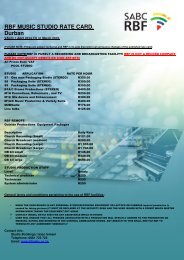
Percentage %Source: AMPS<strong>Television</strong> <strong>Viewership</strong> <strong>Trends</strong> : HOUSEWIVES100<strong>SABC</strong> TV showingan upwardtrend in weeklyviewership forHOUSEWIVES806040200<strong>SABC</strong> 1 - P7D <strong>SABC</strong> 2 - P7D <strong>SABC</strong> 3 - P7DAMPS 2010 (Jan 2010-Dec 2010) 75.0 66.3 53.5AMPS 2011 (Jul 2010-Jun 2011) 77.0 68.6 54.9AMPS 2011 (Jan 2011-Dec 2011) 78.2 71.4 57.7
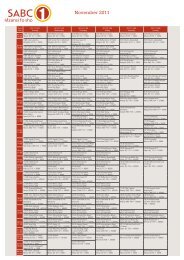
Percentage %Source: AMPS<strong>Television</strong> <strong>Viewership</strong> <strong>Trends</strong> : <strong>LSM</strong> 1-4<strong>SABC</strong> TV showingstability & anupwardtrend in weeklyviewership for<strong>LSM</strong> 1-4100806040200<strong>SABC</strong> 1 - P7D <strong>SABC</strong> 2 - P7D <strong>SABC</strong> 3 - P7DAMPS 2010 (Jan 2010-Dec 2010) 65.0 41.8 25.9AMPS 2011 (Jul 2010-Jun 2011) 69.4 45.0 28.2AMPS 2011 (Jan 2011-Dec 2011) 68.4 46.2 27.9
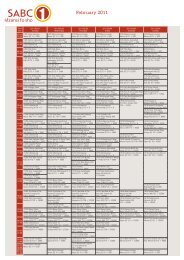
Percentage %Source: AMPS<strong>Television</strong> <strong>Viewership</strong> <strong>Trends</strong> : <strong>LSM</strong> 5-7100<strong>SABC</strong> TV showingan upwardtrend in weeklyviewership for<strong>LSM</strong> 5-7806040200<strong>SABC</strong> 1 - P7D <strong>SABC</strong> 2 - P7D <strong>SABC</strong> 3 - P7DAMPS 2010 (Jan 2010-Dec 2010) 89.6 78.2 65.2AMPS 2011 (Jul 2010-Jun 2011) 89.8 78.9 64.3AMPS 2011 (Jan 2011-Dec 2011) 90.9 81.0 66.3
Percentage %Source: AMPS<strong>Television</strong> <strong>Viewership</strong> <strong>Trends</strong> : <strong>LSM</strong> 8 -10100<strong>SABC</strong> TV showingan upwardtrend in weeklyviewership for<strong>LSM</strong> 8-10806040200<strong>SABC</strong> 1 - P7D <strong>SABC</strong> 2 - P7D <strong>SABC</strong> 3 - P7DAMPS 2010 (Jan 2010-Dec 2010) 65.3 75.0 69.1AMPS 2011 (Jul 2010-Jun 2011) 63.9 73.7 68.6AMPS 2011 (Jan 2011-Dec 2011) 65.0 74.3 69.5