Pearson Successmaker Math Efficacy Study 2009-10 Final Report
Pearson Successmaker Math Efficacy Study 2009-10 Final Report
Pearson Successmaker Math Efficacy Study 2009-10 Final Report

You also want an ePaper? Increase the reach of your titles
YUMPU automatically turns print PDFs into web optimized ePapers that Google loves.
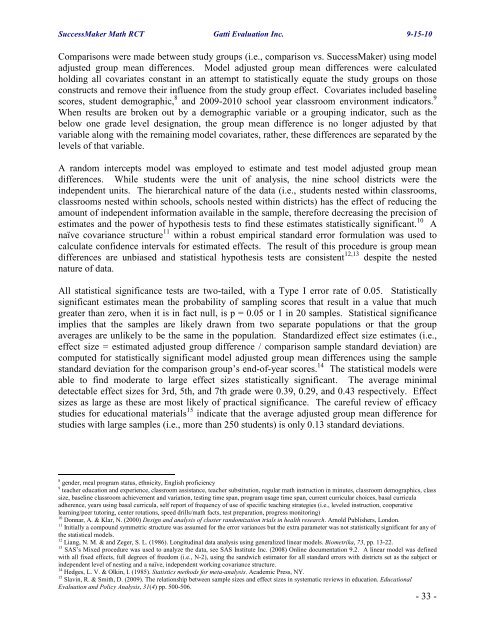
SuccessMaker <strong>Math</strong> RCT Gatti Evaluation Inc. 9-15-<strong>10</strong>Comparisons were made between study groups (i.e., comparison vs. SuccessMaker) using modeladjusted group mean differences. Model adjusted group mean differences were calculatedholding all covariates constant in an attempt to statistically equate the study groups on thoseconstructs and remove their influence from the study group effect. Covariates included baselinescores, student demographic, 8 and <strong>2009</strong>-20<strong>10</strong> school year classroom environment indicators. 9When results are broken out by a demographic variable or a grouping indicator, such as thebelow one grade level designation, the group mean difference is no longer adjusted by thatvariable along with the remaining model covariates, rather, these differences are separated by thelevels of that variable.A random intercepts model was employed to estimate and test model adjusted group meandifferences. While students were the unit of analysis, the nine school districts were theindependent units. The hierarchical nature of the data (i.e., students nested within classrooms,classrooms nested within schools, schools nested within districts) has the effect of reducing theamount of independent information available in the sample, therefore decreasing the precision ofestimates and the power of hypothesis tests to find these estimates statistically significant. <strong>10</strong> Anaïve covariance structure 11 within a robust empirical standard error formulation was used tocalculate confidence intervals for estimated effects. The result of this procedure is group meandifferences are unbiased and statistical hypothesis tests are consistent 12,13 despite the nestednature of data.All statistical significance tests are two-tailed, with a Type I error rate of 0.05. Statisticallysignificant estimates mean the probability of sampling scores that result in a value that muchgreater than zero, when it is in fact null, is p = 0.05 or 1 in 20 samples. Statistical significanceimplies that the samples are likely drawn from two separate populations or that the groupaverages are unlikely to be the same in the population. Standardized effect size estimates (i.e.,effect size = estimated adjusted group difference / comparison sample standard deviation) arecomputed for statistically significant model adjusted group mean differences using the samplestandard deviation for the comparison group’s end-of-year scores. 14 The statistical models wereable to find moderate to large effect sizes statistically significant. The average minimaldetectable effect sizes for 3rd, 5th, and 7th grade were 0.39, 0.29, and 0.43 respectively. Effectsizes as large as these are most likely of practical significance. The careful review of efficacystudies for educational materials 15 indicate that the average adjusted group mean difference forstudies with large samples (i.e., more than 250 students) is only 0.13 standard deviations.8 gender, meal program status, ethnicity, English proficiency9 teacher education and experience, classroom assistance, teacher substitution, regular math instruction in minutes, classroom demographics, classsize, baseline classroom achievement and variation, testing time span, program usage time span, current curricular choices, basal curriculaadherence, years using basal curricula, self report of frequency of use of specific teaching strategies (i.e., leveled instruction, cooperativelearning/peer tutoring, center rotations, speed drills/math facts, test preparation, progress monitoring)<strong>10</strong> Donnar, A. & Klar, N. (2000) Design and analysis of cluster randomization trials in health research. Arnold Publishers, London.11 Initially a compound symmetric structure was assumed for the error variances but the extra parameter was not statistically significant for any ofthe statistical models.12 Liang, N. M. & and Zeger, S. L. (1986). Longitudinal data analysis using generalized linear models. Biometrika, 73, pp. 13-22.13 SAS’s Mixed procedure was used to analyze the data, see SAS Institute Inc. (2008) Online documentation 9.2. A linear model was definedwith all fixed effects, full degrees of freedom (i.e., N-2), using the sandwich estimator for all standard errors with districts set as the subject orindependent level of nesting and a naïve, independent working covariance structure.14 Hedges, L. V. & Olkin, I. (1985). Statistics methods for meta-analysis. Academic Press, NY.15 Slavin, R. & Smith, D. (<strong>2009</strong>). The relationship between sample sizes and effect sizes in systematic reviews in education. EducationalEvaluation and Policy Analysis, 31(4) pp. 500-506.- 33 -