Pearson Successmaker Math Efficacy Study 2009-10 Final Report
Pearson Successmaker Math Efficacy Study 2009-10 Final Report
Pearson Successmaker Math Efficacy Study 2009-10 Final Report

You also want an ePaper? Increase the reach of your titles
YUMPU automatically turns print PDFs into web optimized ePapers that Google loves.
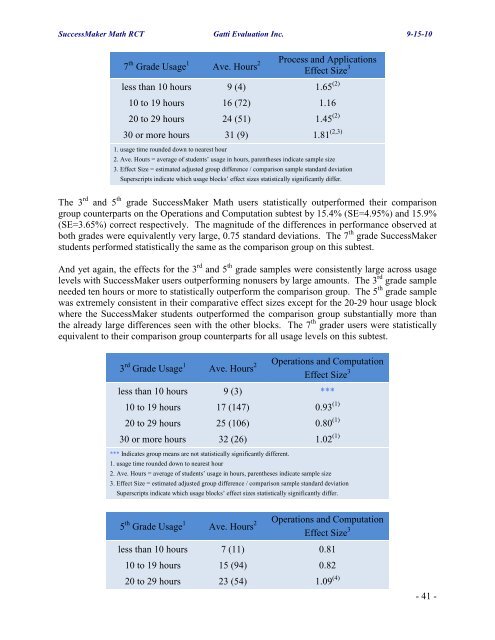
SuccessMaker <strong>Math</strong> RCT Gatti Evaluation Inc. 9-15-<strong>10</strong>7 th Grade Usage 1 Ave. Hours 2 Process and ApplicationsEffect Size 3less than <strong>10</strong> hours 9 (4) 1.65 (2)<strong>10</strong> to 19 hours 16 (72) 1.1620 to 29 hours 24 (51) 1.45 (2)30 or more hours 31 (9) 1.81 (2,3)1. usage time rounded down to nearest hour2. Ave. Hours = average of students’ usage in hours, parentheses indicate sample size3. Effect Size = estimated adjusted group difference / comparison sample standard deviationSuperscripts indicate which usage blocks’ effect sizes statistically significantly differ.The 3 rd and 5 th grade SuccessMaker <strong>Math</strong> users statistically outperformed their comparisongroup counterparts on the Operations and Computation subtest by 15.4% (SE=4.95%) and 15.9%(SE=3.65%) correct respectively. The magnitude of the differences in performance observed atboth grades were equivalently very large, 0.75 standard deviations. The 7 th grade SuccessMakerstudents performed statistically the same as the comparison group on this subtest.And yet again, the effects for the 3 rd and 5 th grade samples were consistently large across usagelevels with SuccessMaker users outperforming nonusers by large amounts. The 3 rd grade sampleneeded ten hours or more to statistically outperform the comparison group. The 5 th grade samplewas extremely consistent in their comparative effect sizes except for the 20-29 hour usage blockwhere the SuccessMaker students outperformed the comparison group substantially more thanthe already large differences seen with the other blocks. The 7 th grader users were statisticallyequivalent to their comparison group counterparts for all usage levels on this subtest.3 rd Grade Usage 1 Ave. Hours 2 Operations and ComputationEffect Size 3less than <strong>10</strong> hours 9 (3) ***<strong>10</strong> to 19 hours 17 (147) 0.93 (1)20 to 29 hours 25 (<strong>10</strong>6) 0.80 (1)30 or more hours 32 (26) 1.02 (1)*** Indicates group means are not statistically significantly different.1. usage time rounded down to nearest hour2. Ave. Hours = average of students’ usage in hours, parentheses indicate sample size3. Effect Size = estimated adjusted group difference / comparison sample standard deviationSuperscripts indicate which usage blocks’ effect sizes statistically significantly differ.5 th Grade Usage 1 Ave. Hours 2 Operations and ComputationEffect Size 3less than <strong>10</strong> hours 7 (11) 0.81<strong>10</strong> to 19 hours 15 (94) 0.8220 to 29 hours 23 (54) 1.09 (4)- 41 -