Pearson Successmaker Math Efficacy Study 2009-10 Final Report
Pearson Successmaker Math Efficacy Study 2009-10 Final Report
Pearson Successmaker Math Efficacy Study 2009-10 Final Report

Create successful ePaper yourself
Turn your PDF publications into a flip-book with our unique Google optimized e-Paper software.
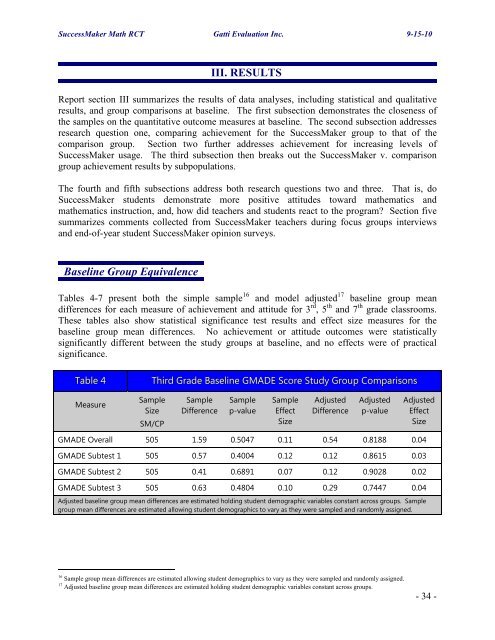
SuccessMaker <strong>Math</strong> RCT Gatti Evaluation Inc. 9-15-<strong>10</strong>III. RESULTS<strong>Report</strong> section III summarizes the results of data analyses, including statistical and qualitativeresults, and group comparisons at baseline. The first subsection demonstrates the closeness ofthe samples on the quantitative outcome measures at baseline. The second subsection addressesresearch question one, comparing achievement for the SuccessMaker group to that of thecomparison group. Section two further addresses achievement for increasing levels ofSuccessMaker usage. The third subsection then breaks out the SuccessMaker v. comparisongroup achievement results by subpopulations.The fourth and fifth subsections address both research questions two and three. That is, doSuccessMaker students demonstrate more positive attitudes toward mathematics andmathematics instruction, and, how did teachers and students react to the program? Section fivesummarizes comments collected from SuccessMaker teachers during focus groups interviewsand end-of-year student SuccessMaker opinion surveys.Baseline Group EquivalenceTables 4-7 present both the simple sample 16 and model adjusted 17 baseline group meandifferences for each measure of achievement and attitude for 3 rd , 5 th and 7 th grade classrooms.These tables also show statistical significance test results and effect size measures for thebaseline group mean differences. No achievement or attitude outcomes were statisticallysignificantly different between the study groups at baseline, and no effects were of practicalsignificance.Table 4Third Grade Baseline GMADE Score <strong>Study</strong> Group ComparisonsMeasureSampleSizeSM/CPSampleDifferenceSamplep-valueSampleEffectSizeAdjustedDifferenceAdjustedp-valueAdjustedEffectSizeGMADE Overall 505 1.59 0.5047 0.11 0.54 0.8188 0.04GMADE Subtest 1 505 0.57 0.4004 0.12 0.12 0.8615 0.03GMADE Subtest 2 505 0.41 0.6891 0.07 0.12 0.9028 0.02GMADE Subtest 3 505 0.63 0.4804 0.<strong>10</strong> 0.29 0.7447 0.04Adjusted baseline group mean differences are estimated holding student demographic variables constant across groups. Samplegroup mean differences are estimated allowing student demographics to vary as they were sampled and randomly assigned.16 Sample group mean differences are estimated allowing student demographics to vary as they were sampled and randomly assigned.17 Adjusted baseline group mean differences are estimated holding student demographic variables constant across groups.- 34 -