"Photoluminescence from Chemically Exfoliated MoS2" Nano Lett.
"Photoluminescence from Chemically Exfoliated MoS2" Nano Lett.
"Photoluminescence from Chemically Exfoliated MoS2" Nano Lett.

You also want an ePaper? Increase the reach of your titles
YUMPU automatically turns print PDFs into web optimized ePapers that Google loves.
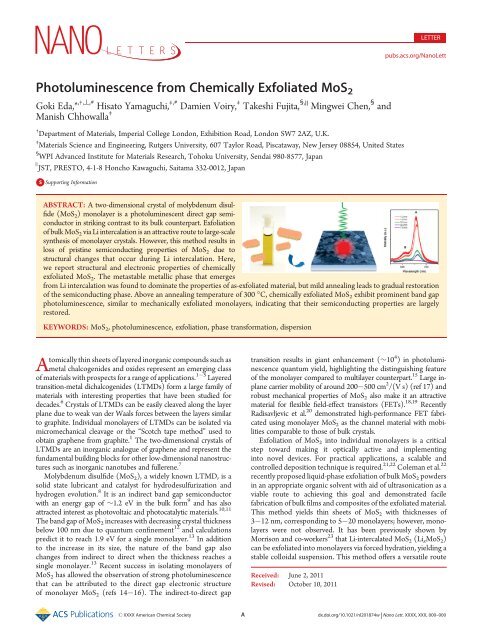
LETTERpubs.acs.org/<strong>Nano</strong><strong>Lett</strong><strong>Photoluminescence</strong> <strong>from</strong> <strong>Chemically</strong> <strong>Exfoliated</strong> MoS 2Goki Eda,* ,†,^,# Hisato Yamaguchi, ‡,# Damien Voiry, ‡ Takeshi Fujita, §,|| Mingwei Chen, § andManish Chhowalla ‡† Department of Materials, Imperial College London, Exhibition Road, London SW7 2AZ, U.K.‡ Materials Science and Engineering, Rutgers University, 607 Taylor Road, Piscataway, New Jersey 08854, United States)§ WPI Advanced Institute for Materials Research, Tohoku University, Sendai 980-8577, JapanJST, PRESTO, 4-1-8 Honcho Kawaguchi, Saitama 332-0012, JapanbS Supporting InformationABSTRACT: A two-dimensional crystal of molybdenum disulfide(MoS 2 ) monolayer is a photoluminescent direct gap semiconductorin striking contrast to its bulk counterpart. Exfoliationof bulk MoS 2 via Li intercalation is an attractive route to large-scalesynthesis of monolayer crystals. However, this method results inloss of pristine semiconducting properties of MoS 2 due tostructural changes that occur during Li intercalation. Here,we report structural and electronic properties of chemicallyexfoliated MoS 2 . The metastable metallic phase that emerges<strong>from</strong> Li intercalation was found to dominate the properties of as-exfoliated material, but mild annealing leads to gradual restorationof the semiconducting phase. Above an annealing temperature of 300 °C, chemically exfoliated MoS 2 exhibit prominent band gapphotoluminescence, similar to mechanically exfoliated monolayers, indicating that their semiconducting properties are largelyrestored.KEYWORDS: MoS 2 , photoluminescence, exfoliation, phase transformation, dispersionAtomically thin sheets of layered inorganic compounds such asmetal chalcogenides and oxides represent an emerging classof materials with prospects for a range of applications. 1 5 Layeredtransition-metal dichalcogenides (LTMDs) form a large family ofmaterials with interesting properties that have been studied fordecades. 6 Crystals of LTMDs can be easily cleaved along the layerplane due to weak van der Waals forces between the layers similarto graphite. Individual monolayers of LTMDs can be isolated viamicromechanical cleavage or the “Scotch tape method” used toobtain graphene <strong>from</strong> graphite. 1 The two-dimensional crystals ofLTMDs are an inorganic analogue of graphene and represent thefundamental building blocks for other low-dimensional nanostructuressuch as inorganic nanotubes and fullerene. 7Molybdenum disulfide (MoS 2 ), a widely known LTMD, is asolid state lubricant and catalyst for hydrodesulfurization andhydrogen evolution. 8 It is an indirect band gap semiconductorwith an energy gap of ∼1.2 eV in the bulk form 9 and has alsoattracted interest as photovoltaic and photocatalytic materials. 10,11The band gap of MoS 2 increases with decreasing crystal thicknessbelow 100 nm due to quantum confinement 12 and calculationspredict it to reach 1.9 eV for a single monolayer. 13 In additionto the increase in its size, the nature of the band gap alsochanges <strong>from</strong> indirect to direct when the thickness reaches asingle monolayer. 13 Recent success in isolating monolayers ofMoS 2 has allowed the observation of strong photoluminescencethat can be attributed to the direct gap electronic structureof monolayer MoS 2 (refs 14 16). The indirect-to-direct gaptransition results in giant enhancement (∼10 4 ) in photoluminescencequantum yield, highlighting the distinguishing featureof the monolayer compared to multilayer counterpart. 15 Large inplanecarrier mobility of around 200 500 cm 2 /(V s) (ref 17) androbust mechanical properties of MoS 2 also make it an attractivematerial for flexible field-effect transistors (FETs). 18,19 RecentlyRadisavljevic et al. 20 demonstrated high-performance FET fabricatedusing monolayer MoS 2 as the channel material with mobilitiescomparable to those of bulk crystals.Exfoliation of MoS 2 into individual monolayers is a criticalstep toward making it optically active and implementinginto novel devices. For practical applications, a scalable andcontrolled deposition technique is required. 21,22 Coleman et al. 22recently proposed liquid-phase exfoliation of bulk MoS 2 powdersin an appropriate organic solvent with aid of ultrasonication as aviable route to achieving this goal and demonstrated facilefabrication of bulk films and composites of the exfoliated material.This method yields thin sheets of MoS 2 with thicknesses of3 12 nm, corresponding to 5 20 monolayers; however, monolayerswere not observed. It has been previously shown byMorrison and co-workers 23 that Li-intercalated MoS 2 (Li x MoS 2 )can be exfoliated into monolayers via forced hydration, yielding astable colloidal suspension. This method offers a versatile routeReceived: June 2, 2011Revised: October 10, 2011r XXXX American Chemical Society A dx.doi.org/10.1021/nl201874w | <strong>Nano</strong> <strong>Lett</strong>. XXXX, XXX, 000–000
<strong>Nano</strong> <strong>Lett</strong>ersLETTERFigure 2. (a) Photograph of MoS 2 film floating on water (top panel)and deposited on glass (bottom panel). (b) Photograph of an asdepositedthin film of MoS 2 on flexible PET. The films in (a) and (b)are approximately 5 nm thick. (c) AFM image of an ultrathin film with anaverage thickness of 1.3 nm. The film consists of regions that are coveredby monolayers and others that are slightly thicker due to overlapbetween individual sheets. Height profile along the red line is overlaidon the image.Figure 1. (a) Scanning electron microscopy image of MoS 2 powder.Inset shows higher magnification image of the layered structure. Thescale bar is 400 nm. (b) Photograph of a typical chemically exfoliatedMoS 2 suspension in water. (c) AFM image of individual exfoliated MoS 2sheets after annealing at 300 °C. Height profile along the red line isoverlaid on the image. The sample was prepared by filtering a smallvolume (∼3 mL) of dilute MoS 2 suspension to minimize overlapbetween individual sheets. The resulting film was nonhomogeneousdue to partial aggregation. Regions of the sample where the sheets wereisolated were imaged for step height analysis. (d) TEM image of anas-deposited MoS 2 sheet on holey carbon grid. (e) SAED pattern <strong>from</strong>the MoS 2 sheet in (d) showing the hexagonal symmetry of the MoS 2structure. (f) HAADF STEM image of monolayer MoS 2 annealed at 300°C in Ar. Inset is a blow-up image showing individual Mo (green dot)and S (orange dot) atoms and their honeycomb arrangement. The scalebar is 0.5 nm. The white blur on the surface of the sheet is possibly due tocarbon residues <strong>from</strong> the intercalation and exfoliation processes.toward assembly of MoS 2 sheets into thin films, 24 formation ofinclusion compounds, 25 and composites. 26 Facile solution-baseddeposition of thin films has also enabled their use as the holetransport layer in polymer light-emitting diodes. 27While exfoliation of Li x MoS 2 allows simple access to monolayerMoS 2 , their physical properties have not been fully understood.28 This is partly attributed to the phase changes that occurduring Li intercalation and concomitant alteration of the pristineproperties. 29 Specifically, Li intercalation results in loss of thesemiconducting properties due to emergence of a metallic phase.In addition, the small size of the exfoliated flakes (typically
<strong>Nano</strong> <strong>Lett</strong>ersLETTERFigure 3. (a) Structure of 2H- and 1T-MoS 2 . (b) XPS spectra showing Mo 3d, S 2s, and S 2p core level peak regions for samples annealed at varioustemperatures. The samples were measured on Pt foil and Pt 4f 7/2 was taken as a reference. After Shirley background subtraction, the Mo 3d and S 2ppeaks were deconvoluted to show the 2H and 1T contributions, represented by red and green plots, respectively. (c) Extracted relative fraction of 2H and1T components (top) and the linewidths of S 2s and Mo 3d 5/2 peaks as a function of annealing temperature (bottom). The Mo 3d 5/2 peak linewidths areshown for the two phases. A similar trend was also observed for the S 2p peaks, but the data are not shown here for clarity.allows extremely fine control over the film thickness ranging <strong>from</strong>near-monolayer up to tens of nanometers via adjustment of thefiltration volume or the concentration of the suspensions used.The thickness of ∼1nmfilms reported here is distinctly thinnerthan those obtained previously by the spreading method, 24 whichresults in films thicker than 3 nm (ref 27). Our films exhibit someinhomogeneity, consisting of regions with slight variations in thenumber of layers as shown in Figure 2c.Raman spectra of all samples showed the well-known in-planeE 1 2g and out-of-plane A 1g peaks of 2H-MoS 2 both before andafter annealing (See Supporting Information for details.) Frequenciesof these Raman modes have been shown to indicate thenumber of layers in mechanically exfoliated MoS 2 . 34 However, dueto local variations in film thickness and the rotational stackingdisorder, frequencies of these Raman modes do not allow directdetermination of the number of layers in our samples. Instead,average film thicknesses have been calculated <strong>from</strong> AFM asdiscussed in the Supporting Information.A thermodynamically stable form of MoS 2 is the trigonalprismatic (2H-MoS 2 ) phase where each molybdenum atom isprismatically coordinated by six surrounding sulfur atoms 6(Figure 3a). Upon Li intercalation, MoS 2 undergoes a firstorderphase transition to a metastable phase where thecoordination of Mo atoms becomes octahedral (1T-MoS 2 ) 29(Figure 3a). The intriguing consequence of this phase transitionis the dramatic change in the density of states whichrenders 1T-MoS 2 metallic. 35 The structure of chemicallyexfoliated MoS 2 sheets has been the subject of several studies 28and is believed to be of 1T-type but with lattice distortions. 36While annealing at moderate temperatures (∼200 °C) is likelyto cause transformation back to the initial 2H phase, 37 theextent of its restoration is not known. The phase transformationis also suggested to be triggered by removal of interlayerwater in deposited films 38 andalsoprogressesatlowertemperaturesover a period of weeks. 39 In this study, all experimentsand measurements were conducted within 2 days <strong>from</strong>deposition in order to avoid aging effects.Due to the differences in the symmetry elements in theirstructures, 2H and 1T phases can be differentiated by Ramananalysis. 39 The as-deposited samples exhibit Raman peaks suggestingthe presence of a 1T phase; however, due to its weakresponse, quantitative analysis of the phase composition was notpossible (see Supporting Information). Instead we study thephase compositions by X-ray photoelectron spectroscopy (XPS).The Mo 3d, S 2s, and S 2p regions of the XPS spectra for samplesannealed at various temperatures are shown in Figure 3b. TheMo 3d spectra consist of peaks at around 229 and 232 eV thatcorrespond to Mo 4+ 3d 5/2 and Mo 4+ 3d 3/2 components of 2H-MoS 2 , respectively. Deconvolution of these peaks reveals additionalpeaks that are shifted to lower binding energies by ∼0.9 eVwith respect to the position of the 2H-MoS 2 peaks. Similarly, inthe S 2p region of the spectra, additional peaks are found besidesthe known doublet peaks of 2H-MoS 2 ,S2p 1/2 ,andS2p 3/2 ,whichappear at 163 and 161.9 eV, respectively. The parallel shift of theseadditional peaks suggests that they arise <strong>from</strong> the 1T phase. Ourobservations are similar to those reported for single crystal MoS 2progressively intercalated by Li where additional peaks appear dueto formation of 1T phase. 40 The 1T peaks are gradually quenchedafter annealing above 100 °C. It is worth noting that absence of aprominent peak at around 236 eV, which corresponds to Mo 6+ 3d 5/2 ,indicates that oxidation of Mo is minimal. Similarly, no peaks wereobserved between 168 and 170 eV, which indicates that sulfuratoms also remain unoxidized. Extracted phase compositions showthat the as-deposited samples consist of nearly equal amounts of thetwo phases (Figure 3c). Increase of the 2H phase fraction is nearlylinear with temperature up to about 150 °C and becomes gradualfor higher temperatures. After annealing at temperatures above200 °C, the material is predominantly in 2H phase, reaching 0.95 at300 °C. It can also be noticed that the line width of 2H-MoS 2 peaksbecomes progressively narrower with annealing above 150 °C,suggesting improved structural uniformity and relaxation of localstrain (Figure 3c).As-deposited films with thickness below 10 nm were semitransparentand electrically conducting, but the conductivityC dx.doi.org/10.1021/nl201874w |<strong>Nano</strong> <strong>Lett</strong>. XXXX, XXX, 000–000
<strong>Nano</strong> <strong>Lett</strong>ersLETTERFigure 4. (a) Absorption and (b) photoluminescence spectra of MoS 2 thin films annealed at various temperatures. In (b), two sets of spectra for thinand thick samples are shown. <strong>Photoluminescence</strong> was measured with excitation wavelength at 514 nm. The spectra are normalized with the intensity ofthe A 1g Raman peaks. (c) Absorption and (d) photoluminescence spectra of MoS 2 thin films with average thicknesses ranging <strong>from</strong> 1.3 to 7.6 nm. Theaverage film thickness and error bars were obtained <strong>from</strong> the height analysis of the AFM data (Supporting Information). Insets of (c) and (d) showenergy of the A exciton peak as a function of average film thickness. The peak energies were extracted <strong>from</strong> the absorption and photoluminescencespectra in the main panel, respectively. No clear A exciton peak was identified in the emission spectrum of 7.6 nm film.quickly dropped with annealing (Supporting Information). Thesefilms typically exhibited resistivity of ∼1 Ω.cm while values as large as∼10 6 Ω 3 cm were observed after annealing at 300 °C. The unusuallylarge resistivity of annealed films suggests non-negligible contributions<strong>from</strong> interflake resistance and residual defects that localizecarriers. Nevertheless, significant increase in resistivity largely reflectsthe evolution of phase composition. We observed weak fieldmodulated conductivity for annealed samples suggesting restorationof the semiconducting properties (Supporting Information).Evolution of the mixed phase structure was further studiedby measuring the absorption spectra of MoS 2 films as a functionof progressive annealing (Figure 4a). As-deposited filmsexhibit no clear characteristic peaks of pristine 2H-MoS 2except for the high energy excitonic features in the near-UVrange (200 300 nm). With increasing annealing temperature,the characteristic MoS 2 excitonic features emerge and grow inintensity. Specifically, A and B excitonic peaks arising <strong>from</strong> the Kpoint of the Brillouin zone were observed between 600 and700 nm while convoluted C and D excitonic peaks appearedaround 420 nm. Emergence of these features indicates restorationof 2H phase upon annealing. As compared to the pristinemechanically exfoliated monolayer, the exciton peaks are lessresolved, suggesting the presence of residual structural disorder,probably owing to remnant lattice distortion. 39 Gradually suppressedabsorption in the near-IR region, which is below theband gap of 2H-MoS 2 , also suggests reduction of the metallic1T phase component.In order to evaluate the restored semiconducting phase, weinvestigated the photoluminescence properties of our samples.Monolayer of MoS 2 is a direct gap semiconductor where thelowest energy interband transition occurs at the K point of theBrillouin zone. 13 Relaxation of excitons at the K point can result inemission of photons with energy of 1.9 eV (ref 15). Our asdepositedMoS 2 films do not exhibit photoluminescence, asexpected <strong>from</strong> their partial metallic character. On the other hand,annealed films exhibit reproducible photoluminescence when theirthickness is sufficiently low (
<strong>Nano</strong> <strong>Lett</strong>erssuggesting that they are <strong>from</strong> the direct band gap photoluminescence<strong>from</strong> the K point. The emission spectrum of our ∼1.3 nmfilm is in good agreement with those reported by Mak et al. 15 andSplendiani et al. 11 for mechanically exfoliated monolayer samples,indicating that the observed photoluminescence arises <strong>from</strong>the intrinsic electronic properties of monolayer MoS 2 and not<strong>from</strong> structural defects or chemical impurities. The emissionintensity for our thinnest samples (∼1.3 nm in average thickness)was comparable to that for mechanically exfoliated monolayers.(See Supporting Information for the comparison.) Defects withunsaturated Mo or S bonds which introduce midgap states areexpected to be active nonradiative recombination centers forexcitons. 41 Our observations suggest that despite the possibleresidual structural disorder in our samples, density of such criticaldefects is sufficiently low.Increase in film thickness was found to result in a slight redshift in both the absorption resonance and photoluminescenceenergy (Figure 4c,d). The shift is small (∼20 meV) but consistentwith the fact that direct gap is only weakly sensitive to theconfinement effect due to the large electron and hole mass aroundthe K point, changing by only 20 meV between mono- and bilayerMoS 2 (ref 15). Figure 4d shows that the thinnest samples exhibitthe strongest photoluminescence while the emission intensitygradually decreases with increasing film thickness. The gradualquenching of photoluminescence with film thickness is in contrastto that in mechanically exfoliated MoS 2 where the quantumyield drops rapidly <strong>from</strong> monolayer to bilayer. Our observationmay be explained by the fact that there may be monolayeredregions within the multi-layered films. Alternatively, weakinterlayer coupling between the restacked MoS 2 sheets due torotational stacking disorder as suggested by Raman analysiscould be responsible for the gradual decrease in PL. (SeeSupporting Information for details.)Solution-based exfoliation of layered materials is a promisingroute for producing 2D crystals in large scale and realizing theirunique properties in practical applications. We have demonstratedchemical exfoliation of MoS 2 to individual monolayersand deposition of ultrathin films that are up to several layers inthickness. Unlike chemically derived graphene, 42 MoS 2 sheetsremain chemically unmodified so that their fundamental electronicproperties are largely preserved. Our films exhibit prominentband gap photoluminescence that is consistent with the behaviorof mechanically exfoliated MoS 2 , indicating that despite thechemical exfoliation, the MoS 2 sheets retain structural integritywith sufficiently low density of critical defects which may inhibitluminescence. The thickness-dependent electronic structureand the unique two-phase behavior of MoS 2 reveal unusualversatility of this material. For example, the properties of metallicand semitransparent 1T-MoS 2 represent new opportunities inthe development of transparent conductors. These features ofchemically exfoliated MoS 2 make them attractive for novelelectronic and optoelectronic devices such as nonvolatile memory,solar cells, and light-emitting diodes which remain to beexplored.Method. Lithium intercalation was achieved by immersing 3 gof natural MoS 2 crystals (Sigma-Aldrich) in 3 mL of 1.6 Mbutyllithium solution in hexane (Sigma-Aldrich) for 2 days in aflask filled with argon gas. The Li x MoS 2 was retrieved by filtrationand washed with hexane (60 mL) to remove excess lithium andorganic residues. Exfoliation was achieved immediately afterthis (within 30 min to avoid deintercalation) by ultrasonicatingLi x MoS 2 in water for 1 h. The mixture was centrifuged severalLETTERtimes to remove excess lithium in the form of LiOH andunexfoliated material. Thin films were prepared by filtering adiluted suspension (0.01 0.1 mg/mL) through a mixed celluloseester membrane with 25 nm pores (Millipore). The film wasdelaminated as described in the main text on water surface forsubsequent transfer onto a substrate. AFM data were obtained inDigital Instruments <strong>Nano</strong>scope IV in tapping mode with standardcantilevers with spring constant of 40 N/m and tipcurvature
<strong>Nano</strong> <strong>Lett</strong>ersfor financial support through Postdoctoral Fellowship forResearch Abroad. M.C., H.Y., and D.V. acknowledge DonaldH. Jacobs’ Chair funding <strong>from</strong> Rutgers University. Thisresearch was partly supported by JST, PRESTO.’ REFERENCES(1) Novoselov, K. S.; Jiang, D.; Schedin, F.; Booth, T. J.; Khotkevich,V. V.; Morozov, S. V.; Geim, A. K. Proc. Natl. Acad. Sci. U.S.A. 2005,102, 10451.(2) Rao, C. N. R.; Nag, A. Eur. J. Inorg. Chem. 2010, 4244.(3) Ma, R. Z.; Sasaki, T. Adv. Mater. 2010, 22, 5082.(4) Lee, C.; Li, Q. Y.; Kalb, W.; Liu, X. Z.; Berger, H.; Carpick, R. W.;Hone, J. Science 2010, 328, 76.(5) Cho, S.; Butch, N. P.; Paglione, J.; Fuhrer, M. S. <strong>Nano</strong> <strong>Lett</strong>. 2011,11, 1925–1927.(6) Wilson, J. A.; Yoffe, A. D. Adv. Phys. 1969, 18, 193.(7) Tenne, R. Nat. <strong>Nano</strong>technol. 2006, 1, 103.(8) Furimsky, E. Catal. Rev. 1980, 22, 371.(9) Roxlo, C. B.; Chianelli, R. R.; Deckman, H. W.; Ruppert, A. F.;Wong, P. P. J. Vac. Sci. Technol., A 1987, 5, 555.(10) Tributsch, H. Ber. Bunsen-Ges. Phys. Chem. 1977, 81, 361.(11) Fortin, E.; Sears, W. M. J. Phys. Chem. Solids 1982, 43, 881.(12) Neville, R. A.; Evans, B. L. Phys. Status Solidi B 1976, 73, 597.(13) Li, T. S.; Galli, G. L. J. Phys. Chem. C 2007, 111, 16192.(14) Splendiani, A.; Sun, L.; Zhang, Y. B.; Li, T. S.; Kim, J.; Chim,C. Y.; Galli, G.; Wang, F. <strong>Nano</strong> <strong>Lett</strong>. 2010, 10, 1271.(15) Mak, K. F.; Lee, C.; Hone, J.; Shan, J.; Heinz, T. F. Phys. Rev.<strong>Lett</strong>. 2010, 105, 136805.(16) Korn, T.; Heydrich, S.; Hirmer, M.; Schmutzler, J.; Sch€uller, C.Appl. Phys. <strong>Lett</strong>. 2011, 99, 102109.(17) Fivaz, R.; Mooser, E. Phys. Rev. 1967, 163, 743.(18) Ayari, A.; Cobas, E.; Ogundadegbe, O.; Fuhrer, M. S. J. Appl.Phys. 2007, 101, 014507.(19) Podzorov, V.; Gershenson, M. E.; Kloc, C.; Zeis, R.; Bucher, E.Appl. Phys. <strong>Lett</strong>. 2004, 84, 3301.(20) Radisavljevic, B.; Radenovic, A.; Brivio, J.; Giacometti, V.; Kis,A. Nat. <strong>Nano</strong>technol. 2011, 6, 147.(21) Stankovich, S.; Dikin, D. A.; Dommett, G. H. B.; Kohlhaas,K. M.; Zimney, E. J.; Stach, E. A.; Piner, R. D.; Nguyen, S. T.; Ruoff,R.S.Nature 2006, 442, 282.(22) Coleman, J. N.; Lotya, M.; O’Neill, A.; Bergin, S. D.; King, P. J.;Khan, U.; Young, K.; Gaucher, A.; De, S.; Smith, R. J.; Shvets, I. V.; Arora,S. K.; Stanton, G.; Kim, H. Y.; Lee, K.; Kim, G. T.; Duesberg, G. S.;Hallam, T.; Boland, J. J.; Wang, J. J.; Donegan, J. F.; Grunlan, J. C.;Moriarty, G.; Shmeliov, A.; Nicholls, R. J.; Perkins, J. M.; Grieveson,E. M.; Theuwissen, K.; McComb, D. W.; Nellist, P. D.; Nicolosi, V.Science 2011, 331, 568.(23) Joensen, P.; Frindt, R. F.; Morrison, S. R. Mater. Res. Bull. 1986,21, 457.(24) Divigalpitiya, W. M. R.; Morrison, S. R.; Frindt, R. F. Thin SolidFilms 1990, 186, 177.(25) Divigalpitiya, W. M. R.; Frindt, R. F.; Morrison, S. R. Science1989, 246, 369.(26) Kirmayer, S.; Aharon, E.; Dovgolevsky, E.; Kalina, M.; Frey,G. L. Philos. Trans. R. Soc., A 2007, 365, 1489.(27) Frey, G. L.; Reynolds, K. J.; Friend, R. H.; Cohen, H.; Feldman,Y. J. Am. Chem. Soc. 2003, 125, 5998.(28) Heising, J.; Kanatzidis, M. G. J. Am. Chem. Soc. 1999, 121, 638.(29) Py, M. A.; Haering, R. R. Can. J. Phys. 1983, 61, 76.(30) Ghatak, S.; Pal, A. N.; Ghosh, A. ACS <strong>Nano</strong> 2011,5, 7707–7712.(31) Yang, D.; Sandoval, S. J.; Divigalpitiya, W. M. R.; Irwin, J. C.;Frindt, R. F. Phys. Rev. B 1991, 43, 12053.(32) Hansen, L. P.; Ramasse, Q. M.; Kisielowski, C.; Brorson, M.;Johnson, E.; Topsøe, H.; Helveg, S. Angew. Chem., Int. Ed. 2011,50, 10153–10156.LETTER(33) Eda, G.; Fanchini, G.; Chhowalla, M. Nat. <strong>Nano</strong>technol. 2008,3, 270.(34) Lee, C.; Yan, H.; Brus, L. E.; Heinz, T. F.; Hone, J.; Ryu, S. ACS<strong>Nano</strong> 2010, 4, 2695.(35) Mattheis, Lf Phys. Rev. B 1973, 8, 3719.(36) Qin, X. R.; Yang, D.; Frindt, R. F.; Irwin, J. C. Phys. Rev. B 1991,44, 3490.(37) Wypych, F.; Schollhorn, R. J. Chem. Soc., Chem. Comm. 1992, 1386.(38) Qin, X. R.; Yang, D.; Frindt, R. F.; Irwin, J. C. Ultramicroscopy1992, 44 42, 630.(39) Sandoval, S. J.; Yang, D.; Frindt, R. F.; Irwin, J. C. Phys. Rev. B1991, 44, 3955.(40) Papageorgopoulos, C. A.; Jaegermann, W. Surf. Sci. 1995, 338,83.(41) Kam, K. K.; Parkinson, B. A. J. Phys. Chem. 1982, 86, 463.(42) Park, S.; Ruoff, R.S.Nat. <strong>Nano</strong>technol. 2009, 4, 217.F dx.doi.org/10.1021/nl201874w |<strong>Nano</strong> <strong>Lett</strong>. XXXX, XXX, 000–000