Early life history of the American conger eel ... - ResearchGate
Early life history of the American conger eel ... - ResearchGate
Early life history of the American conger eel ... - ResearchGate

You also want an ePaper? Increase the reach of your titles
YUMPU automatically turns print PDFs into web optimized ePapers that Google loves.
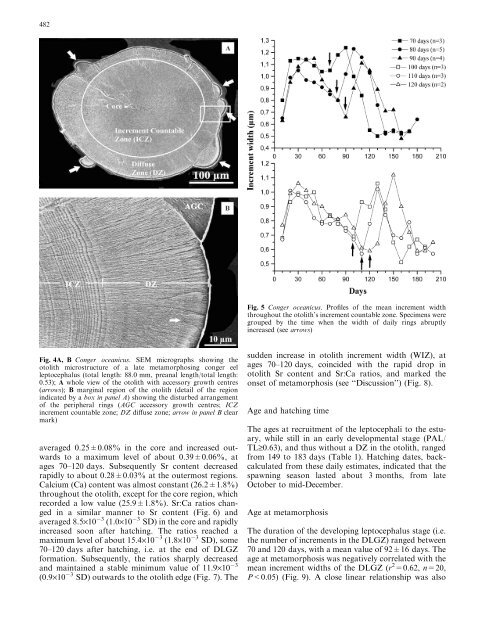
482Fig. 5 Conger oceanicus. Pr<strong>of</strong>iles <strong>of</strong> <strong>the</strong> mean increment widththroughout <strong>the</strong> otolith’s increment countable zone. Specimens weregrouped by <strong>the</strong> time when <strong>the</strong> width <strong>of</strong> daily rings abruptlyincreased (see arrows)Fig. 4A, B Conger oceanicus. SEM micrographs showing <strong>the</strong>otolith microstructure <strong>of</strong> a late metamorphosing <strong>conger</strong> <strong>eel</strong>leptocephalus (total length: 88.0 mm, preanal length/total length:0.53); A whole view <strong>of</strong> <strong>the</strong> otolith with accessory growth centres(arrows); B marginal region <strong>of</strong> <strong>the</strong> otolith (detail <strong>of</strong> <strong>the</strong> regionindicated by a box in panel A) showing <strong>the</strong> disturbed arrangement<strong>of</strong> <strong>the</strong> peripheral rings (AGC accessory growth centres; ICZincrement countable zone; DZ diffuse zone; arrow in panel B clearmark)averaged 0.25±0.08% in <strong>the</strong> core and increased outwardsto a maximum level <strong>of</strong> about 0.39±0.06%, atages 70–120 days. Subsequently Sr content decreasedrapidly to about 0.28±0.03% at <strong>the</strong> outermost regions.Calcium (Ca) content was almost constant (26.2±1.8%)throughout <strong>the</strong> otolith, except for <strong>the</strong> core region, whichrecorded a low value (25.9±1.8%). Sr:Ca ratios changedin a similar manner to Sr content (Fig. 6) andaveraged 8.5·10 3 (1.0·10 3 SD) in <strong>the</strong> core and rapidlyincreased soon after hatching. The ratios reached amaximum level <strong>of</strong> about 15.4·10 3 (1.8·10 3 SD), some70–120 days after hatching, i.e. at <strong>the</strong> end <strong>of</strong> DLGZformation. Subsequently, <strong>the</strong> ratios sharply decreasedand maintained a stable minimum value <strong>of</strong> 11.9·10 3(0.9·10 3 SD) outwards to <strong>the</strong> otolith edge (Fig. 7). Thesudden increase in otolith increment width (WIZ), atages 70–120 days, coincided with <strong>the</strong> rapid drop inotolith Sr content and Sr:Ca ratios, and marked <strong>the</strong>onset <strong>of</strong> metamorphosis (see ‘‘Discussion’’) (Fig. 8).Age and hatching timeThe ages at recruitment <strong>of</strong> <strong>the</strong> leptocephali to <strong>the</strong> estuary,while still in an early developmental stage (PAL/TL‡0.63), and thus without a DZ in <strong>the</strong> otolith, rangedfrom 149 to 183 days (Table 1). Hatching dates, backcalculatedfrom <strong>the</strong>se daily estimates, indicated that <strong>the</strong>spawning season lasted about 3 months, from lateOctober to mid-December.Age at metamorphosisThe duration <strong>of</strong> <strong>the</strong> developing leptocephalus stage (i.e.<strong>the</strong> number <strong>of</strong> increments in <strong>the</strong> DLGZ) ranged between70 and 120 days, with a mean value <strong>of</strong> 92±16 days. Theage at metamorphosis was negatively correlated with <strong>the</strong>mean increment widths <strong>of</strong> <strong>the</strong> DLGZ (r 2 =0.62, n=20,P