Irrigation performance in a water use association in Valencia, Spain ...
Irrigation performance in a water use association in Valencia, Spain ...
Irrigation performance in a water use association in Valencia, Spain ...

You also want an ePaper? Increase the reach of your titles
YUMPU automatically turns print PDFs into web optimized ePapers that Google loves.
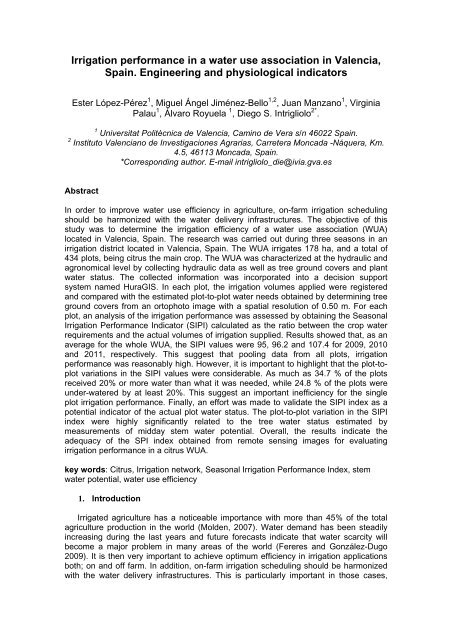
such as the <strong>water</strong> <strong>use</strong> <strong>association</strong>s (WUA), were <strong>water</strong> is delivered to growers bymeans of collective systems.It is strik<strong>in</strong>g that despite much effort has been done <strong>in</strong> the past <strong>in</strong> order to improveefficiency of <strong>water</strong> distribution along the whole cha<strong>in</strong>; less attention has been paid <strong>in</strong>terms of irrigation efficiency at the farm level. In this sense, the first crucial step is toperform irrigation applications <strong>in</strong> order to match as much as possible the plant <strong>water</strong>needs.Geographic <strong>in</strong>formation System (GIS) can be <strong>use</strong>d as tools for monitor<strong>in</strong>g orchard<strong>water</strong> balances <strong>in</strong> large areas (i.e. WUA). The emphasis of this study is the applicationof a decision support tool called HuraGIS (Jiménez-Bello et al. 2010), to determ<strong>in</strong>eplot-to-plot <strong>water</strong> needs compar<strong>in</strong>g actual <strong>water</strong> applications with the estimated <strong>water</strong>needs.2. Material and methodsThe WUA where the research was carried out was located <strong>in</strong> Picassent (<strong>Valencia</strong>,39° 21' N - 0° 27' O elevation 47 m) dur<strong>in</strong>g three seasons (2009, 2010, 2011). Theclimate was Mediterranean with an average annual ra<strong>in</strong>fall and referenceevapotranspiration (ETo) of 518 and 1114 mm, respectively. The WUA irrigates anarea of 178.16 ha, and a total of 434 plots, be<strong>in</strong>g citrus the ma<strong>in</strong> planted woody crop.The network has a length of 14.019 m. The <strong>water</strong> is delivered to the field plots directfrom the ma<strong>in</strong> or subma<strong>in</strong> pipel<strong>in</strong>es through 62 hydrants. Figure 1 shows thedistribution network and cadastral plots <strong>in</strong> the <strong>water</strong> <strong>use</strong>rs <strong>association</strong>. The WUA wascharacterized at the hydraulic and agronomical level by collect<strong>in</strong>g hydraulic data aswell as tree ground covers and plant <strong>water</strong> status.Figure 1. Distribution network layout, hydrants and cadastral data of the PicassentWater User Association.The collected <strong>in</strong>formation was <strong>in</strong>corporated <strong>in</strong>to a decision support system namedHuraGIS (Jiménez-Bello et al. 2010). In each plot, the irrigation volumes applied wereregistered us<strong>in</strong>g <strong>in</strong> l<strong>in</strong>e <strong>water</strong> meters and compared with the estimated plot-to-plot<strong>water</strong> needs (ETc). Orchard <strong>water</strong> requirements (ETc) were estimated us<strong>in</strong>g the FAOmodel (Allen et al. 1998), where ETc=ETo*Kc.
Kc are the crop coefficient obta<strong>in</strong>ed by determ<strong>in</strong><strong>in</strong>g tree ground covers from anortophoto image with a spatial resolution of 0.50 m and a spectral resolution <strong>in</strong>clud<strong>in</strong>gthe visible and near-<strong>in</strong>frared bands. In fact, <strong>in</strong> the case of citrus, Castel (2000) obta<strong>in</strong>edan average yearly Kc based on the tree GC (Table 1).Table 1: Crop Coefficient (kc) accord<strong>in</strong>g ground cover (GC,%) for citrus trees.GC(%)Citrus20 > GC K c = 0.021 + GC * 0.017420 < GC < 70 K c = 0.274 + GC * 0.00570 < GC K c = K c70For each plot, an analysis of the irrigation <strong>performance</strong> was assessed by obta<strong>in</strong><strong>in</strong>gthe Seasonal <strong>Irrigation</strong> Performance Indicator (SIPI) calculated as the ratio betweenthe crop <strong>water</strong> requirements and the actual volumes of irrigation supplied (Faci et al2000).F<strong>in</strong>ally, on July 15, 2011, <strong>in</strong> some orchards plant <strong>water</strong> status was determ<strong>in</strong>ed bymeasur<strong>in</strong>g midday stem <strong>water</strong> potential (Ψstem) by means of a pressure chamber <strong>in</strong> 5selected trees per orchard and two leaves per tree.3. Results and DiscussionAs an average for the whole WUA, the SIPI values were 95, 96.2 and 107.4 for2009, 2010 and 2011, respectively. This suggests that pool<strong>in</strong>g data from all plots,irrigation <strong>performance</strong> was reasonably high. However, it is important to highlight thatthe plot-to-plot variations <strong>in</strong> the SIPI values were considerable (see Figure 2, 3). For<strong>in</strong>stance <strong>in</strong> 2011, as much as 34.7 % of the plots received 20% or more <strong>water</strong> thanwhat it was needed, while 24.8 % of the plots were <strong>water</strong>ed with 20% or less <strong>water</strong>than what it was needed. This means that 25% of the plots were actually under deficitirrigation, what might be detrimental to tree <strong>performance</strong>. On the other hand, up to 35%of the plots were over irrigated. These plots were mostly young orchards where <strong>use</strong>rsplaced a drip l<strong>in</strong>e with all the emitters needed for a mature orchard operat<strong>in</strong>g already atthe early stages of the orchard life time <strong>in</strong> order to save labour costs. There were evenplots with young citrus plants where eight emitters were operat<strong>in</strong>g.Figure 2: Plot-to-plot variation of the Seasonal <strong>Irrigation</strong> Performance Index (SIPI, %)calculated dur<strong>in</strong>g August of 2009 (left) and 2010 (right).
Figure 3: Plot-to-plot variation of the Seasonal <strong>Irrigation</strong> Performance Index (SIPI, %)calculated dur<strong>in</strong>g August of 2011Data summarized <strong>in</strong> Table 2 also showed that <strong>in</strong> only 20, 21 and 25% of the plotsirrigation was applied <strong>in</strong> order to match closely the estimated crop <strong>water</strong> needs (SIPIvalues between 75 and 125%).Table 2: Number of plots listed accord<strong>in</strong>g to their Seasonal <strong>Irrigation</strong> PerformanceIndex (SIPI, %) range.2009 2010 2011# PlotsSIPI50 69 99 7912575 122 113 160125150 69 72 83SIPI>150 237 178 210TOTAL 611 550 640Overall the results <strong>in</strong>dicate an important <strong>in</strong>efficiency for the s<strong>in</strong>gle plot irrigation<strong>performance</strong>. This was ma<strong>in</strong>ly beca<strong>use</strong> the drip irrigation agronomical design could notaccommodate differences <strong>in</strong> <strong>water</strong> needs among plots belong<strong>in</strong>g to the same sectorsand therefore to the same turn of irrigation. This suggest that on-farm irrigationefficiency can be greatly improved. A better harmonization of the plot-to-plot irrigationneeds with the entire WUA irrigation demand should be conducted. This implies the
<strong>use</strong> of decision support systems <strong>in</strong> order to be able to handle the different <strong>water</strong>demands, determ<strong>in</strong><strong>in</strong>g the proper <strong>water</strong> turns for <strong>in</strong>creas<strong>in</strong>g irrigation efficiencyapplications. As showed <strong>in</strong> Figure 2 and 3 the HuraGis model allows and easydetection of anomalous consumption rates by s<strong>in</strong>gle plots.Indeed, our results show the need to coord<strong>in</strong>ate the subunit design of different<strong>use</strong>rs <strong>in</strong> order to improve irrigation time efficiency, provided the irrigation schedul<strong>in</strong>g isby shifts. This can be achieved through coord<strong>in</strong>ated action dur<strong>in</strong>g the process ofmodernization of the system. Users have to take <strong>in</strong>to account the size of their cropsand their future growth and then adjust the <strong>water</strong> flow rates per crop, activat<strong>in</strong>g newemitters as the plants grow up. For exist<strong>in</strong>g operational irrigation subunits, the <strong>use</strong>r canbe advised on the best number of emitters to operate to get similar irrigation times tothe scheduled times. However, it should be noted that already exist<strong>in</strong>g subunits maynot fulfil all design criteria.F<strong>in</strong>ally, an effort was made to validate the SIPI <strong>in</strong>dex as a potential <strong>in</strong>dicator of theactual plot <strong>water</strong> status. Dur<strong>in</strong>g a selected day of the 2011 irrigation campaign, the plotto-plotvariation <strong>in</strong> the SIPI <strong>in</strong>dex were highly significantly related to the tree <strong>water</strong>status estimated by measurements of midday stem <strong>water</strong> potential (Ψstem). This<strong>in</strong>dicates that the SIPI <strong>in</strong>dex (an irrigation efficiency <strong>in</strong>dicator) allows predict<strong>in</strong>g theplant <strong>water</strong> status (a physiological <strong>in</strong>dicator), which is normally well related to the tree<strong>performance</strong> under different irrigation regimes (Ballester et al. 2011)Overall the results obta<strong>in</strong>ed <strong>in</strong>dicate the adequacy of the SPI <strong>in</strong>dex obta<strong>in</strong>ed fromremote sens<strong>in</strong>g images for evaluat<strong>in</strong>g irrigation <strong>performance</strong> <strong>in</strong> a citrus WUA. Nextwork should be conducted <strong>in</strong> order to <strong>use</strong> the HuraGis model to harmonize on-farm andthe whole WUA irrigation needs, and to look for a l<strong>in</strong>k between the SIPI <strong>in</strong>dex and theplot agronomical responses.Figure 4: Relationship between the Seasonal <strong>Irrigation</strong> Performance Index (SIPI, %)and midday stem <strong>water</strong> potential (Ψstem). Each data po<strong>in</strong>t represents a s<strong>in</strong>gle plotwere Ψstem measurements were carried out <strong>in</strong> August 2011.4. AcknowledgementsThis research was supported by funds Interreg IV SUDOEB project “Telerieg” andproject Rideco-Consolider. Thanks are also due to the technical staff of the PicassentWUA and the growers associated for allow<strong>in</strong>g the research activity.5. References
Allen, R.G., Pereira, L.S., Raes, D, y Smith, M. (1998). “Crop Evapotranspiration”.Serie Riego y Drenaje. FAO-56. Roma.Ballester, C., Castel, J., Intrigliolo, D.S., Castel, J.R. (2011). Response of Clement<strong>in</strong>ade Nules citrus trees to regulated deficit irrigation. Yield components and fruitcomposition. Agricultural Water Management 98:1027-1032.Castel, J.R., 2000. Water <strong>use</strong> of develop<strong>in</strong>g citrus canopies <strong>in</strong> <strong>Valencia</strong>, Spa<strong>in</strong>.Proceed<strong>in</strong>g International Society Citriculture, IX Congress:223-226.Faci, J.M., Bensaci, A., Saltni, A., Playán, E., (2000). A case study for irrigationmodernisation. I. Characterisation of the district and analysis of <strong>water</strong> deliveryrecords. Agricultural Water Management. 42, 315–334.Fereres E, Gonzalez-Dugo, V. 2(009). Improv<strong>in</strong>g productivity to face <strong>water</strong> scarcity <strong>in</strong>irrigated agriculture. In: Sadras VO, Calder<strong>in</strong>i DF (eds) Crop physiology:applications for genetic improvement and agronomy. Academic Press, San Diego,pp 123-143.Jimenez-Bello, M. A., Mart<strong>in</strong>ez Alzamora, F., Bou Soler, V., Bartoli Ayala, H. J. (2010)Methodology for group<strong>in</strong>g <strong>in</strong>takes of pressurised irrigation networks <strong>in</strong>to sectors tom<strong>in</strong>imize energy consumption. Biosystems Eng<strong>in</strong>eer<strong>in</strong>g. 105, 429-438Molden, D. (2007). Water for Food, Water for Life: A Comprehensive Assessment ofWater Management <strong>in</strong> Agriculture. Earthscan, London.Phocaides A., Consultant FAO. (2000). ”Technical Handbook on pressurized irrigationtechniques”. Food and agriculture organization of the United Nations. Rome.