evaluation of maturity and fertilizer capacity of compost derived from ...
evaluation of maturity and fertilizer capacity of compost derived from ...
evaluation of maturity and fertilizer capacity of compost derived from ...
Create successful ePaper yourself
Turn your PDF publications into a flip-book with our unique Google optimized e-Paper software.
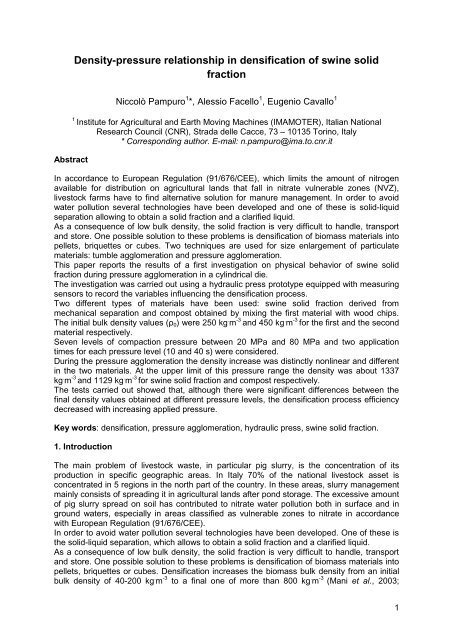
Density-pressure relationship in densification <strong>of</strong> swine solidfractionAbstractNiccolò Pampuro 1 *, Alessio Facello 1 , Eugenio Cavallo 11 Institute for Agricultural <strong>and</strong> Earth Moving Machines (IMAMOTER), Italian NationalResearch Council (CNR), Strada delle Cacce, 73 – 10135 Torino, Italy* Corresponding author. E-mail: n.pampuro@ima.to.cnr.itIn accordance to European Regulation (91/676/CEE), which limits the amount <strong>of</strong> nitrogenavailable for distribution on agricultural l<strong>and</strong>s that fall in nitrate vulnerable zones (NVZ),livestock farms have to find alternative solution for manure management. In order to avoidwater pollution several technologies have been developed <strong>and</strong> one <strong>of</strong> these is solid-liquidseparation allowing to obtain a solid fraction <strong>and</strong> a clarified liquid.As a consequence <strong>of</strong> low bulk density, the solid fraction is very difficult to h<strong>and</strong>le, transport<strong>and</strong> store. One possible solution to these problems is densification <strong>of</strong> biomass materials intopellets, briquettes or cubes. Two techniques are used for size enlargement <strong>of</strong> particulatematerials: tumble agglomeration <strong>and</strong> pressure agglomeration.This paper reports the results <strong>of</strong> a first investigation on physical behavior <strong>of</strong> swine solidfraction during pressure agglomeration in a cylindrical die.The investigation was carried out using a hydraulic press prototype equipped with measuringsensors to record the variables influencing the densification process.Two different types <strong>of</strong> materials have been used: swine solid fraction <strong>derived</strong> <strong>from</strong>mechanical separation <strong>and</strong> <strong>compost</strong> obtained by mixing the first material with wood chips.The initial bulk density values (ρ 0 ) were 250 kg . m -3 <strong>and</strong> 450 kg . m -3 for the first <strong>and</strong> the secondmaterial respectively.Seven levels <strong>of</strong> compaction pressure between 20 MPa <strong>and</strong> 80 MPa <strong>and</strong> two applicationtimes for each pressure level (10 <strong>and</strong> 40 s) were considered.During the pressure agglomeration the density increase was distinctly nonlinear <strong>and</strong> differentin the two materials. At the upper limit <strong>of</strong> this pressure range the density was about 1337kg . m -3 <strong>and</strong> 1129 kg . m -3 for swine solid fraction <strong>and</strong> <strong>compost</strong> respectively.The tests carried out showed that, although there were significant differences between thefinal density values obtained at different pressure levels, the densification process efficiencydecreased with increasing applied pressure.Key words: densification, pressure agglomeration, hydraulic press, swine solid fraction.1. IntroductionThe main problem <strong>of</strong> livestock waste, in particular pig slurry, is the concentration <strong>of</strong> itsproduction in specific geographic areas. In Italy 70% <strong>of</strong> the national livestock asset isconcentrated in 5 regions in the north part <strong>of</strong> the country. In these areas, slurry managementmainly consists <strong>of</strong> spreading it in agricultural l<strong>and</strong>s after pond storage. The excessive amount<strong>of</strong> pig slurry spread on soil has contributed to nitrate water pollution both in surface <strong>and</strong> inground waters, especially in areas classified as vulnerable zones to nitrate in accordancewith European Regulation (91/676/CEE).In order to avoid water pollution several technologies have been developed. One <strong>of</strong> these isthe solid-liquid separation, which allows to obtain a solid fraction <strong>and</strong> a clarified liquid.As a consequence <strong>of</strong> low bulk density, the solid fraction is very difficult to h<strong>and</strong>le, transport<strong>and</strong> store. One possible solution to these problems is densification <strong>of</strong> biomass materials intopellets, briquettes or cubes. Densification increases the biomass bulk density <strong>from</strong> an initialbulk density <strong>of</strong> 40-200 kg . m -3 to a final one <strong>of</strong> more than 800 kg . m -3 (Mani et al., 2003;1
Temperature inside the heaps at 0.4 m, 0.8 m <strong>and</strong> 1.2 m high above the floor <strong>and</strong>environmental temperature were continuously recorded. The decision to turn the <strong>compost</strong>ingpiles was based on the temperature <strong>of</strong> the decomposing material. When the temperature <strong>of</strong>two <strong>of</strong> the three probes in the decomposing material was over 60°C, the pile was turned(Caceres et al., 2006).Optimal humidity (between 50-60%) <strong>of</strong> windrows was maintained spreading water duringturning operations by a rain distribution system placed under the covering (Bernal et al.,1998).At the end <strong>of</strong> the <strong>compost</strong>ing process, the initial bulk density values (ρ 0 ) were 450 kg . m -3 <strong>and</strong>250 kg . m -3 for WCC <strong>and</strong> SSFC respectively.2.3. Statistical analysisIn the densification test one way analysis <strong>of</strong> variance (ANOVA) was performed to comparefinal density values. Bonferroni’s test was used for testing significant statistical differencesamong samples at a probably (P) <strong>of</strong> 0.05. All statistical analyses were done with SPSSs<strong>of</strong>tware.The values reported in Table 2 <strong>and</strong> in Table 3 were the means <strong>of</strong> five replicates.3. Results <strong>and</strong> discussionThe relationship <strong>of</strong> compressed density versus compressive pressure for WCC <strong>and</strong> SSFC isshown in figure 2.FIGURE 2: Relationship between density (theoretical values <strong>and</strong> experimental data) <strong>and</strong>applied pressure on WCC <strong>and</strong> SSFCIn the range <strong>of</strong> pressure up to 10 MPa the density increase was linear. Compressed densityat the limit <strong>of</strong> this pressure range was about 800 kg . m -3 <strong>and</strong> 700 kg . m -3 for WCC <strong>and</strong> SSFCrespectively. The second phase <strong>of</strong> compression included pressure <strong>from</strong> about 10 MPa toabout 80 MPa. The density increase in this pressure range was distinctly nonlinear <strong>and</strong>different for WCC <strong>and</strong> SSFC. At the upper limit <strong>of</strong> this pressure range the density was about1300 kg . m -3 <strong>and</strong> 1200 kg . m -3 for WCC <strong>and</strong> SSFC respectively.3
The empirical Bailey’s model (Bailey et al., 1986) was fitted to the experimental results. Thismodel, modified to meet the conditions <strong>of</strong> swine solid fraction compression, assumed thefollowing form:where:ρ = compressed density (kg . m -3 );ρ 0 = initial bulk density (kg . m -3 );p = compression pressure (MPa);A, B, C = model parameters.Values <strong>of</strong> model parameters are presented in Table 1.TABLE 1: Values <strong>of</strong> empirical model parametersMaterialA [kg∙m -3 ]ParametersB [kg∙m -3 ∙MPa -1 ] C [Mpa -1 ]WCC 420 6.289 0.149SSFC 562 4.717 0.137The tests performed showed that the density material increase diminished when the pressureapplied was augmented. Indeed moving <strong>from</strong> 20 MPa to 30 MPa the increase was 11%,while passing <strong>from</strong> 70 MPa to 80 MPa the increase was reduced to 1.4% as shown in figure3. It is therefore possible to affirm that the efficiency <strong>of</strong> the densification process decreaseswith increasing pressure applied on the material.FIGURE 3: Average increase in density refers to pressure increaseAverage values <strong>of</strong> final density obtained with the test are showed in Tables 2 <strong>and</strong> 3.The data highlighted significant differences between the two materials, the two timing <strong>of</strong>pressure application <strong>and</strong> the seven levels <strong>of</strong> applied pressure.TABLE 2: Average density values (kg . m -3 ) <strong>of</strong> WCC <strong>and</strong> SSFC materials obtained usingdifferent pressure levels (20, 30, 40, 50, 60, 70 <strong>and</strong> 80 MPa)MaterialPressure [MPa]20 30 40 50 60 70 80PWCC 964.19 a 1047.69 b 1136.56 c 1211.89 d 1255.44 e 1288.65 f 1337.66 g ***SSFC 868.72 a 961.60 b 1042.23 c 1059.96 d 1100.84 e 1140.65 f 1129.15 g ****** Significant at the 0.01 levels <strong>of</strong> probabilitya, b, c, d, e, f, g mean values for materials with different letters differ significantly (P
TABLE 3: Average density values (kg . m -3 ) <strong>of</strong> WCC <strong>and</strong> SSFC materials obtained with twotimeapplication <strong>of</strong> pressure (10 <strong>and</strong> 40 s)4. ConclusionsMaterialTime [s]10 40WCC 1167.35 1187.53 ***SSFC 1028.38 1058.24 ****** Significant at the 0.01 levels <strong>of</strong> probabilityAlthough significant differences were found between the final density values obtained atdifferent pressure levels, the densification process efficiency decreased with increasingapplied pressure.Further tests will be carried out with the aim <strong>of</strong> verifying the maximum pressure beyondwhich the increase in density <strong>of</strong> WCC <strong>and</strong> SSFC is not significant.In order to verify the influence <strong>of</strong> the pressure application time on the final density will beconsidered different times.The economic <strong>and</strong> energetic <strong>evaluation</strong> <strong>of</strong> the process will be analysed.5. AcknowledgementsThis work was carried out within the framework <strong>of</strong> the “FITRAREF” project, funded by theItalian Ministry <strong>of</strong> Agriculture <strong>and</strong> Forestry (Call OIGA, 2009), under the scientific direction <strong>of</strong>Dr. Eugenio Cavallo (CNR-IMAMOTER). Authors also acknowledge Mr. Giuseppe Paletto<strong>and</strong> Mr. Guarino Benvegnù (CNR-IMAMOTER) for the technical support.ReferencesBailey, A. C., Johnson, C. E., & Shafer, R. L. (1986). A model for agricultural soil compaction.Journal <strong>of</strong> Agricultural Engineering Research, 33 (4), 257-262.Bernal, M. P., Paredes, C., Sanchez-Monedero, M. A., & Cegarra, J. (1998). Maturity <strong>and</strong>stability parameters <strong>of</strong> <strong>compost</strong>s prepared with a wide range <strong>of</strong> organic waste. BioresourceTechnology, 63, 91-99.Caceres, F., Flotats, X., & Marfa, O. (2006). Changes in the chemical <strong>and</strong> physiochemicalproperties <strong>of</strong> the solid fraction <strong>of</strong> cattle slurry during <strong>compost</strong>ing using different aerationstrategies. Waste Management, 26, 1081-1091.Council Directive 91/676/CEE concerning water pollution caused by nitrates <strong>from</strong> agriculturalsources.Kaliyan, N. & Vance Morey, R. (2009). Factors affecting strength <strong>and</strong> durability <strong>of</strong> densifiedbiomass products. Biomass <strong>and</strong> Bioenergy, 33, 337-359.Mani, S., Tabil, L.G. & Sokhansanj, S. (2003). An overview <strong>of</strong> compaction <strong>of</strong> biomass grinds.Powder H<strong>and</strong>ling <strong>and</strong> Processing, 15, 160-168.McMullen, J., Fasina, O.O., Wood, C.W. & Feng, Y. (2005). Storage <strong>and</strong> h<strong>and</strong>lingcharacteristics <strong>of</strong> pellets <strong>from</strong> poultry litter. Applied Engineering in Agriculture, 21, 645-651.Obernberger, I. & Thek, G. (2004). Physical characterisation <strong>and</strong> chemical composition <strong>of</strong>densified biomass fuels with regard to their combustion behaviour. Biomass <strong>and</strong> Bioenergy,27, 653-669.Pietsch, W. (2002). Agglomeration processes – phenomena, technologies, equipment.Weinheim: Wiley-VCH.P5


