
You also want an ePaper? Increase the reach of your titles
YUMPU automatically turns print PDFs into web optimized ePapers that Google loves.
Special focus on genderI N S T I T U T E f o r S TAT I S T IC SGLOBAL EDUCATION DIGEST 2010Comparing Education Statistics Across the WorldU N E S C O
Special focus on gende rGLOBAL EDUC ATION DIGE S T 2 0 1 0Comparing Education Statistics Across the World
UNESCOThe constitution of the United Nations Educational, Scientific and Cultural Organization (UNESCO) was adoptedby 20 countries at the London Conference in November 1945 and entered into effect on 4 November 1946. TheOrganization currently has 193 Member States and six Associate Members.The main objective of UNESCO is to contribute to peace and security in the world by promoting collaborationamong nations through education, science, culture and communication in order to foster universal respect forjustice, the rule of law, and human rights and fundamental freedoms that are affirmed for the peoples of theworld, without distinction of race, sex, language or religion, by the Charter of the United Nations.To fulfill its mandate, UNESCO performs five principal functions: 1) prospective studies on education, science,culture and communication for tomorrow’s world; 2) the advancement, transfer and sharing of knowledgethrough research, training and teaching activities; 3) standard-setting actions for the preparation and adoptionof internal instruments and statutory recommendations; 4) expertise through technical co-operation to MemberStates for their development policies and projects; and 5) the exchange of specialised information.UNESCO is headquartered in Paris, France.The UNESCO Institute for StatisticsThe UNESCO Institute for Statistics (UIS) is the statistical office of UNESCO and is the UN depository for globalstatistics in the fields of education, science and technology, culture and communication.The UIS was established in 1999. It was created to improve UNESCO’s statistical programme and to develop anddeliver the timely, accurate and policy-relevant statistics needed in today’s increasingly complex and rapidlychanging social, political and economic environments.The UIS is based in Montreal, Canada.Published in 2010 by:UNE SCO Institute for StatisticsP.O. Box 6128, Succursale Centre-VilleMontreal, Quebec H3C 3J7CanadaTel: (1 514) 343-6880Fax: (1 514) 343-5740Email: publications@uis.unesco.orghttp://www.uis.unesco.org© UNESCO-UIS 2010Ref: UIS/SD/10-08ISBN: 978-92-9189-088-0Design: Sabine Lebeau / les souris zéléesPhoto credits:Frontcover / Tomas Munita, [ Samanti de Silva ], Justin MottBackcover / Zhengdzi, Bert Hoetmer, Paul HighnamPrinting: Transcontinental MétrolithoThe authors are responsible for the choice and the presentation of the facts contained in this book and for the opinions expressedtherein which are not necessarily those of UNESCO and do not commit the Organization.The designations employed and the presentation of material throughout this publication do not imply the expression of any opinionwhatsoever on the part of UNESCO concerning the legal status of any country, territory, city or area or of its authorities or concerningthe delimitation of its frontiers or boundaries.To access the electronic version of data tables, see www.uis.unesco.org/publications/GED2010.
Preface by the Director-GeneralEducation for Gender Equality and Gender Equality in and through Education, 2010This is the first edition of the Global Education Digest prepared under my tenure as Director-Generalof UNESCO. I am delighted that it reflects two of my mandate’s top priorities: education and genderequality.This Digest is clear evidence that these priorities require intensified global attention, five yearsshort of the target date for achieving the internationally-agreed development goals to which worldleaders committed in 2000.Being a girl still remains a powerful cause for exclusion despite universally enshrined human rights,constitutional guarantees and political declarations. Although progress towards gender parityhas been particularly rapid over the past decade, girls are more likely to be out of primary schoolthan boys – a blatant denial of their right to education. At the secondary level, when girls reachthe vulnerable age of adolescence, their participation declines in certain parts of the world due tounsafe learning environments and social demands. The Digest finds that 60% of countries have notreached gender parity in primary and secondary education – a goal that had been set for 2005 atboth the World Education Forum and the Millennium Summit at the turn of the century. The shareof illiterate women has not changed over the past twenty years: women still represented two-thirdsof the world’s 759 million illiterates in 2008.A broad set of social, cultural and political factors are still severely limiting girls’ and women’slearning opportunities. When gender combines with other factors of exclusion such as poverty,ethnicity, location or disability, the chances of being uneducated are even higher. Such inequalitiesare holding back progress in all areas, from improved child and maternal health to overall povertyreduction efforts.Gender equality and Africa are UNESCO’s two global priorities for the 2008-2013 period. As such,we are actively engaged in international efforts to develop forward-looking strategies and actionsthat make equal rights a realityOur Organization has participated in an intensive stock-taking exercise. In March 2010, theCommission on the Status of Women assessed progress in twelve critical areas of the BeijingPlatform for Action, including the education and training of women and girls. In preparation,UNESCO conducted an online consultation on this topic on behalf of the United Nations system.One of the most significant conclusions was that current education and literacy initiatives arenot responding to the complex needs of women and girls affected by compounded forms of
P r e f a c e b y t h e d i r e c t o r - g e n e r a ldiscrimination. Achieving gender equality in education is not only about access, but about learningenvironments, curricula, attitudes, and a host of wider political, economic and social considerations.The international community kept up the momentum by making gender equality and women’sempowerment the theme of the UN Economic and Social Council’s Annual Ministerial Review inJune. The United Nations High-Level Plenary Meeting on the Millennium Development Goals inSeptember 2010 aims to further galvanize political will towards commitments made in 2000, whichinclude education and gender equality targets. A UN Report prepared for this occasion finds thatprogress towards women’s empowerment and gender equality has been “sluggish on all fronts - fromeducation to access to political decision-making.”All of these findings tell us that we need to re-affirm our commitment to education and genderequality. And we must do so urgently because the world is struggling with crises of unprecedentedgravity. Past evidence shows that girls and women are more hardly hit in times of crises. In education,the advances made in improving girls’ and women’s access to education and training over thepast decade risk being undermined by reductions in international aid and national investmentscaused by the interlocking financial, environmental and humanitarian crises. Yet, we all know thatcompromising the education of girls and women will only lead to more vulnerability and reinforce thevicious cycle of poverty.Education for All will remain elusive without tackling one of the most egregious forms of injusticeof our times: the denial of equal rights to girls and women. The challenge is not merely a question ofaccess to learning, but much more broadly, of challenging gender ideologies in both education andsociety.The Global Education Digest reaffirms that the internationally agreed development goals will not bereached without empowering women with education. I strongly encourage all governments, theinternational community, civil society and other partners to take stock of the rich body of evidencepresented in this publication to make gender equality the hallmark of all education policy. It is themost fundamental condition for making our world more just and peaceful.Irina BokovaUNESCO Director-General
ForewordThe 2010 Global Education Digest (GED) focuses on gender and education to mark the 15th anniversaryof the Fourth World Conference on Women. Shortly after this landmark conference, the internationalcommunity pledged to eliminate gender disparities at all levels of education by 2015 as part of theMillennium Development Goals (MDGs). Yet, as shown in the GED, two in three countries in the world stillface gender disparities in primary and secondary education and as many as half will not have eliminatedthem by 2015.Gender parity in educational enrolments – an important and measureable goal – is part of the UISmandate to monitor progress towards the international education-related targets. However, this is onlya first step towards assessing gender equality more broadly. Policies and indicators need to go beyondenrolments to look at gender disparities in school progression and learning outcomes. The UIS aims toensure that as many indicators as possible are disaggregated by sex and to develop indicators that bettercapture the schooling experience of girls and boys. These data not only provide a wide range of nationalexperiences but will also help to formulate policies and benchmark progress.This edition presents a rich set of cross-nationally comparable data compiled by the UIS as well asinformation from household surveys and assessments of learning achievement that capture differentdimensions of gender disparities. The Digest also introduces several new indicators, such as the adjustednet intake rate and the adjusted net enrolment rate, that have refined or replaced existing indicators aspart of an ongoing effort by the UIS to ensure more reliable and accurate measures.The Institute also undertakes a wide range of activities across countries in order to improve thetimeliness, comparability, completeness and reliability of data. With the support of UIS staff in the field,the Institute works closely with Member States to improve data quality through networks of statisticiansand policy-makers. These exchanges help improve the scope and comparability of data through the use ofinternational standards.This Digest is available electronically at www.uis.unesco.org/publications/GED2010 and CD-ROM.Additional indicators and time series data can be found online in the UIS Data Centre. The database isupdated three times a year and provides access to the most timely international education data available.Hendrik van der PolDirectorUNESCO Institute for Statistics
ContentsPreface by the Director-General 3Foreword 5Acknowledgements 8Education and gender –between promise and progress 11Section 1: The expansion of educational opportunities and gender parity 12Section 2: Gender and schooling trajectories in primary and secondary education 31Section 3: Education, gender and the compounding effects of disadvantage 44Section 4: Gender, teachers and learning achievement 56Section 5: Gender, participation and field of study in tertiary education 68Section 6: National education policies and gender 80Reader’s guide 90Statistical tables 961. Pre-primary education / ISCED 0 / Enrolment and teaching staff 982. Primary education / ISCED 1/ New entrants 1083. Primary education / ISCED 1/ Enrolment and teaching staff 1184. Primary education / ISCED 1/ Measures of progression and completion 1285. Secondary education / ISCED 2 and 3 / Enrolment and repeaters / 2008 1386. Secondary and post-secondary non-tertiary education / ISCED 2, 3 and 4 / 148Teaching staff and post-secondary non-tertiary enrolment / 20087. Graduation and entry to upper secondary education (ISCED 3) and entry to tertiary 158education (ISCED 5) / 2008 (selected countries)8. Tertiary education / (ISCED 5 and 6) / Enrolment, graduation ratio and teaching staff 1629. Tertiary education / (ISCED 5 and 6) / Internationally mobile students by host country 172and region of origin / 2008 (countries with more than 1,000 mobile students)10. Tertiary education / (ISCED 5 and 6) / International flows of mobile students / 2008 17611. Tertiary education / (ISCED 5 and 6) / Graduates by broad fields of education / 2008 18212. School life expectancy 19213. Public expenditure on education and expenditure on education by nature of spending / 202Financial year ending in 200814. Expenditure on education as a percentage of GDP, by sources of funds / 212Financial year ending in 200815. Adult and youth literacy 22216. Educational attainment of the population aged 25 years and older 228
G l o b a l e d u c a t i o n d i g e s t 2 0 1 0 C o m p a r i n g e d u c a t i o n s t a t i s t i c s a r o u n d t h e w o r l dWEI and UOE countries17. Primary and secondary education / ISCED 1, 2 and 3 / Distribution of students 238by type of institution / 200818. Tertiary education / ISCED 5 and 6 / Distribution of students by type of institution / 2008 24019. Primary and lower secondary education / ISCED 1 and 2 / Average class size 242by type of institution / 200820. Intended instruction time (hours per year) for students (9 to 14 years) in public 244institutions / 200821. Primary and secondary education / ISCED 1, 2 and 3 / Organization of teachers’ 245instructional time / 200822. Primary and secondary education / ISCED 1, 2 and 3 / Distribution of teachers by age / 2008 24623. Primary and secondary education / ISCED 1, 2 and 3 / Teachers’ annual salaries in public 250institutions (in U.S. dollars PPP) / 200824. Primary and secondary education / ISCED 1, 2 and 3 / Teachers’ annual salaries in public 252institutions as a percentage of GDP per capita / 200825. Relative proportions of public and private expenditure on educational institutions / 2008 25426. Distribution of total public expenditure on education by destination of funds / 2008 258ANNEX A / Glossary 261ANNEX B / Definitions of indicators 268ANNEX C / International Standard Classification of Education (ISCED97) 272ANNEX D / Regions 274ANNEX E / Electronic resources 276
AcknowledgementsThis Global Education Digest is based on data provided by the countries or territories covered in thispublication. We would like to express our gratitude to those statisticians who, in each country andterritory, took the time to carefully respond to the UIS, UOE or WEI questionnaires, as well as ourrequests for clarification. We would also like to express our thanks to the international organizationsthat supplied additional information and statistics to complement those collected directly by the UIS:in particular, the United Nations Statistics and Population Divisions, the World Bank, the Organisationfor Economic Co-operation and Development (OECD), Eurostat and other specialized institutions.This publication is prepared under the supervision of Albert Motivans, Head of Education Indicatorsand Data Analysis, and is possible with the involvement of UIS staff and external contributors.The initial concept for the analytical chapter was discussed during a seminar held in Montreal inFebruary 2010, which brought together leading academics and agency representatives involved ingender issues. As such, appreciation goes to Gülser Corat (UNESCO/ODG), Florence Migeon (UNESCO/ED), Lydia Ruprecht (UNESCO/ODG), Mioko Saito (UNESCO/IIEP) and Sylvie Cohen (DESA/UN).Peter Wallet coordinated the overall production of the analytical chapter and the data tables. Thechapter was developed and drafted by Professor Nelly P. Stromquist (University of Maryland) withthe support of Saïd Belkachla of the UIS. The following authors prepared background papers relatedto gender and education: N’Dri T. Assié-Lumumba, Anne McDaniel, Mioko Saito, Amy Stambachand Margaret Sutton. UIS staff provided additional analyses, including: Saïd Belkachla, MichaelBruneforth, Chiao-Ling Chien, Friedrich Huebler, Albert Motivans, Martin Schaaper and Peter Wallet.Lory Ajamian and Aurélie Acoca provided support on data presentation. The editors of the analyticalchapter were Amy Otchet and Shereen Joseph. We also thank the many reviewers of the chapter.The data tables presented in this report were prepared by a team led by Wendy Xiaodan Weng, AmélieGagnon, Chiao-Ling Chien and Weixin Lu with the collaboration of Lory Ajamian, Xiaobao Lin, HannaTaleb, Hélène Tran, and Ioulia Sementchouk.We would like to acknowledge the contributions to data quality by: Wilfried Amoussou-Guénou,Redouane Assad, Andrew Barton, Sheena Bell, Ghania Djafri, Daniel Ejov, Tin Nam Ho, Talal El Hourani,Miguel Ibáñez Salinas, Adolfo Gustavo Imhof, Olivier Labé, Shinsaku Nomura, Saïd Ould Voffal, JohnPacifico, Juan Cruz Perusia, Pascale Ratovondrahona, Anuja Singh, Konstantin Soushko-Bortsov,Chantal Thony and UIS field-based staff.Shereen Joseph coordinated the content and overall production of the Digest in print, and BrianBuffett and Adriano Miele managed the production of the CD-ROM.
Education and gender –between promise and progressIntroductionThis edition of the Global Education Digest (GED)explores the changing patterns in gender andschooling throughout the formal education system– from primary to tertiary education levels. Theanalysis draws on data that are presented in theGED Statistical Tables as well as from a wide rangeof education data from other cross-nationallycomparable sources, including assessments oflearning achievement and household surveys.The opening section provides an analysis of longtermtrends in educational participation and genderparity. It examines the growth of educationalopportunities and literacy levels over the past 40years and particularly since the World Conferenceon Education held in Dakar in 2000. Within thecontext of rapidly expanding educational systems,the section looks at how relative opportunitiesfor girls and boys have changed and how globalprogress towards gender parity across regions andcountries has advanced.Section 2 compares the primary and secondaryschool trajectories of boys and girls and identifiesthe impact of inequalities that arise at entry andother stages of schooling. It highlights genderdifferences in terms of school access, retentionand progression from primary to secondaryeducation as well as in orientation (i.e. general orvocational schooling) and completion of secondaryeducation. The analysis shows that genderdisparities are not only relevant for those countriesstruggling to attain universal primary education,but almost all countries face gender disparitiesin terms of progression through the educationsystem.Section 3 draws on national household surveys tohighlight the compounding effects of disadvantageand how gender inequalities interact with poverty,geographic location and ethnicity. It also presents fourcountry case studies – for Bangladesh, Guatemala,Kenya and Morocco – that describe long-term trendsin educational attainment and highlights some of thenational factors and contexts that help explain genderdifferences in educational participation.Section 4 focuses on gender, learning and schoolingconditions. In terms of schooling conditions, itfocuses mainly on the role of teachers and thedistribution of the teaching force by sex. The sectionalso presents new data on learning achievement inreading, language and mathematics, comparing theresults of girls and boys in less developed countrieswho often fall short of mastering basic skills. Thesedata carry important implications for measures orpolicies that currently focus mainly on improvingaccess or participation but don’t address educationquality issues.Section 5 presents a range of indicators that provideinsights into some of the key trends in gender andtertiary education, including the dramatic expansionof women’s participation since 1970 and genderdifferences by field of study.The final section provides an overview of some ofthe main policy issues around gender and educationand the role of specific interventions in reducingdisparities. It also considers issues around improvingdata and information on gender disparities, especiallyin terms of further distinguishing between thedifferent levels of analysis, namely: the educationsystem, education providers, instructional settingsand individual students.11
S E C T I O N1The expansion of educationalopportunities and gender parityThere has been considerable growth ineducational opportunities and literacy levels overthe past 40 years – particularly since the WorldConference on Education held in Dakar in 2000.Participation has increased, especially at higherlevels of education, and the number of girls inschool has been growing – often faster than thenumber of boys.This section looks at how opportunities for girlsand boys have changed at the primary to tertiarylevels within the context of rapidly expandingeducation systems. It examines trends in thechanging volume of educational provision andtracks the progress that has been made in termsof gender parity in education across regions ofthe world and across countries within individualregions since 1999.In practice, the concept of gender parity ineducation should be considered distinct fromthe concept of gender equality. The formeraims at achieving equal participation for girlsand boys in education based on their respectiveproportions of the relevant age-groups in thepopulation. Gender equality is understood morebroadly as the right to access and participatein education, as well as to benefit from gendersensitiveeducational environments, processesand achievements, while obtaining meaningfuleducation outcomes that link education benefitswith social and economic life. Achieving genderparity is therefore understood as only a first steptowards gender equality.Growth in educational provision since 1970Four related measures can be used to assesstrends in the volume of schooling: absoluteenrolment numbers, change over time, grossenrolment ratios and expected years of schooling.All four measures point to the rapid globalexpansion of education since 1970.In absolute numbers, the capacity of the world’seducation systems has more than doubled inalmost 43 years. In 1970, there were 415 millionstudents enrolled in primary education comparedto 696 million students in 2008 (see StatisticalTable 3). The number of secondary educationstudents rose from 195 million in 1970 to526 million in 2008 (see Statistical Table 5).Meanwhile, the number of tertiary studentsincreased by six times over the same period, from32 million to 159 million students in 2008 (seeStatistical Table 8).The change in the number of enrolments dependsto some extent on population growth and theproportion of the school-age population servedby the educational system. Figure 1 shows howthe changes in enrolment numbers compare tothe change in size of the relevant school-agepopulation by level since 1999. For example, thenumber of primary students actually declinedin most regions of the world due to slowerpopulation growth. But in sub-Saharan Africa,South and West Asia and the Arab States, thenumber of enrolments grew faster than the12
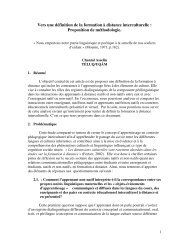
G l o b a l e d u c a t i o n d i g e s t 2 0 1 0 C o m p a r i n g e d u c a t i o n s t a t i s t i c s a r o u n d t h e w o r l dF i g u r e 1At what rate have children entered school since 1999?Percentage change in enrolment and population by level of education and sex, 1999-2008Male EnrolmentFemale Enrolment PopulationPrimary education--Secondary educationChange (%)--Tertiary education--Arab StatesCentral and EasternEuropeCentral AsiaEast Asiaand the PacificLatin America North Americaand the Caribbean and Western EuropeSouth and WestAsiaSub-SaharanAfricaSource: UNESCO Institute for Statistics, Statistical Tables 3, 5 and 8.13
s e c t i o n 1 / T h e e x p a n s i o n o f e d u c a t i o n a l o p p o r t u n i t i e s a n d g e n d e r p a r i t yoften considerable growth of the school-agepopulation, which suggests rapid improvement inaccess to primary education. In all three regions,more girls than boys benefit from these changes.At the secondary education level, the same threeregions showed the strongest growth in termsof enrolments. Only Central and Eastern Europeexhibited negative change – largely due to thedramatic fall in fertility rates since the early1990s. In other regions, the growth of secondaryenrolments outstripped the growth in thesecondary school-age population. The increasein enrolments for girls was higher than for boys inSouth and West Asia and the Arab States yet theopposite was true in sub-Saharan Africa wheregrowth was stronger for boys.By far the biggest change since 1999 was foundin the tertiary sector. Among regions, East Asiaand the Pacific led the way. North America andWestern Europe recorded the lowest rates ofchange due to already high participation rates andminimal growth of the tertiary-age population. Inevery region, tertiary growth exceeded populationgrowth for the corresponding age group andwas higher among women than among men (seeFigure 1). It should also be noted that the growth inthe tertiary sector began at a much lower startingpoint compared to secondary and especiallyprimary education.The gross enrolment ratio (GER) is anothermeasure of the volume of educationalparticipation. It expresses the total number ofenrolments (regardless of age) as a percentage ofthe relevant school-age population. When usingthis indicator, it is important to note from theoutset that it relates to the capacity rather thanthe actual coverage of education systems. It alsoshows how many children and young adults areparticipating in school but not whether they havecompleted a specific education level or acquiredrelevant knowledge and skills.As the number of enrolments generally exceededschool-age population growth, GERs alsoreflect strong growth since 1970 at all levelsof education, indicating tremendous increasesin school participation (see Figure 2 as well asStatistical Tables 3 and 8).Another indicator – school-life expectancy –allows one to look ahead to see how participationrates translate into years of schooling and howmany years, on average, a child entering theschool system could expect based on prevailingparticipation rates. Thus, it is not necessarilya measure of actual (or current) educationalattainment but what the next cohort enteringthe schooling system may achieve.The global average of expected years ofschooling grew from 7.9 years in 1970 to11.0 years in 2008 (see Figure 3). In sub-SaharanAfrica, the value nearly doubled from 4.4 to8.4 years. Despite this progress, the region hasthe lowest number of school years – almosthalf of the number of years in North Americaand Western Europe (16.0 years) (see StatisticalTable 12).In the late 1990s, developing countries began torecover some of the educational ground lost inthe 1980s, when enrolments stagnated or evendeclined in sub-Saharan Africa, East Asia and thePacific, Central and Eastern Europe and CentralAsia. In fact, the pace of progress acceleratedsince 2000 and if trends between 2000 and 2008continue, the increase in school-life expectancyin the current decade will be three times the levelachieved in the 1970s.14
G L O B A L E D U C A T I O N D I G E S T 2 0 1 0 C O M P A R I N G E D U C A T I O N S T A T I S T I C S A R O U N D T H E W O R L DFIGURE 2How have education systems expanded since 1970?Gross enrolment ratios by level of education and sex, 1970-2008Sub−Saharan AfricaArab StatesSouth and West AsiaNorth America and Western EuropeCentral AsiaCentral and Eastern EuropeLatin America and the CaribbeanEast Asia and the PacificWORLDSub−Saharan AfricaArab StatesSouth and West AsiaLatin America and the CaribbeanEast Asia and the PacificNorth America and Western EuropeCentral and Eastern EuropeCentral AsiaWORLDSub−Saharan AfricaEast Asia and the PacificSouth and West AsiaArab StatesLatin America and the CaribbeanCentral AsiaCentral and Eastern EuropeNorth America and Western EuropeWORLDMaleFemaleMaleFemaleMaleFemaleMaleFemaleMaleFemaleMaleFemaleMaleFemaleMaleFemaleMaleFemaleMaleFemaleMaleFemaleMaleFemaleMaleFemaleMaleFemaleMaleFemaleMaleFemaleMaleFemaleMaleFemaleMaleFemaleMaleFemaleMaleFemaleMaleFemaleMaleFemaleMaleFemaleMaleFemaleMaleFemaleMaleFemaleMaleFemale197019801990 2000 2008Primary education0 20 40 60 80 100 120Secondary education0 20 40 60 80 100 120Tertiary education0 20 40 60 80 100 120Source: UNESCO Institute for Statistics, Statistical Tables 3, 5 and 8.Gross enrolment ratio (%)15
s e c t i o n 1 / T h e e x p a n s i o n o f e d u c a t i o n a l o p p o r t u n i t i e s a n d g e n d e r p a r i t yF i g u r e 3How many years of schooling can a child expect?School-life expectancy in years by region, 1970 – 200819701980199020002008Expected years of schoolingSub-SaharanAfricaSouthandWest AsiaArabStatesEast Asiaandthe PacificCentralAsiaCentralandEastern EuropeLatin Americaandthe CaribbeanNorth AmericaandWestern EuropeWORLDSource: UNESCO Institute for Statistics, Statistical Table 12.Globally, in 2008, girls could expect 10.7 years ofschooling or half a year less than boys (11.2 years)– part of this advantage was due to higherrepetition rates among boys. There was alsosubstantial variation among regions. A girl couldexpect one year more of education than a boy inNorth America and Western Europe, one year lessthan a boy in South and West Asia and 1.5 yearsless than a boy in sub-Saharan Africa (see StatisticalTable 12).Since 1999, there has been no change insub‐Saharan Africa while the difference was cut inhalf (from 2.2 to 1.0 more years for boys between1999 and 2008) in South and West Asia.In the Arab States, the difference dropped from1.5 to 1.2 more years for boys during the sameperiod (see Statistical Table 12).Participation and gender parity in primaryeducation since 1970The previously discussed measures of educationalparticipation all highlight a key finding: primaryeducation has reached much more of the world’schildren, especially since 2000. This is largely dueto national efforts to monitor primary education aspart of broader development initiatives that promotewidening access to primary education. Meanwhile, theinternational community also provided support andregular assessment of country progress (see Box 1).Since 1970, girls’ enrolments in primary educationhave increased faster than boys, which has helped toclose the gender gap at the primary level. The primaryGER increased by 20 percentage points for girlsbetween 1970 and 2008 but only 8 percentage pointsfor boys. As a result, the gender parity index (GPI)increased globally from 0.84 to 0.97 (see Box 2) .16
g l O b a l E d U C a T I O N d I g E S T 2 0 1 0 C O m P a r I N g E d U C a T I O N S T a T I S T I C S a r O U N d T h E w O r l db Ox 1Monitoring gender targets of education for All and the Millennium Development goalsFollowing the landmark conference on gender held in Beijing in 1995, the international community reacheda consensus on achieving gender equality in education. In 2000, the World Declaration on Education for All(EFA) as well as the Millennium Declaration reaffirmed the notion of education as a fundamental human right.Countries recognized that educating girls is a powerful and necessary first step to achieving that goal. Genderparity in primary and secondary education was included in EFA and the Millennium Development Goals(MDGs) that aimed to get as many girls as boys into school by 2005.EFA Goal 5Eliminating gender disparities in primary and secondary education by 2005, and achieving gender equality ineducation by 2015, with a focus on ensuring girls’ full and equal access to and achievement in basic educationof good quality.Dakar Framework for Action (2000)(UNESCO, 2000a)MDG-Goal 3: Promote gender equality and empower womenTarget 4: Eliminate gender disparity in primary and secondary education, preferably by 2005, and in all levelsof education no later than 2015.Millennium SummitSource: United Nations General Assembly, Resolution A/56/326, 6 September 2001.b Ox 2understanding the gender parity indexThe gender parity index (GPI) is a measure used to assess gender differences in education indicators. It isdefined as the value of a given indicator for girls divided by that for boys. A GPI value of 1 signifies that thereis no difference in the indicators for girls and boys – they are perfectly equal. UNESCO (2003) has defined aGPI value of between 0.97 and 1.03 (after rounding) as the achievement of gender parity. This allows for somemeasurement error but does not imply a judgement about the acceptability of any particular level of disparity.In cases where disparities are apparent, the interpretation of the GPI depends on the type of indicator. A GPIless than 1 indicates that the value of the indicator is higher for boys than for girls, and the opposite is truewhen the GPI is greater than 1.For indicators where higher values are desirable (e.g. school participation rates), a GPI of less than 1 means thatgirls are at a disadvantage and a GPI greater than 1 means that boys are at a disadvantage. For indicators wherelower values are desirable (e.g. drop-out rates), a GPI of less than 1 means that boys are at a disadvantage and aGPI greater than 1 means that girls are at a disadvantage.In general, the GPI should be interpreted together with the values of the underlying indicator. For example,the magnitude or significance of gender disparities across countries is not the same with very differentparticipation or drop-out rates.The most common indicator used to measure progress towards gender parity in education is the GPI of thegross enrolment ratio (GER) by level of education. However, it should be interpreted with caution since itmay overstate the level of disparity in certain contexts. For example, in countries where repetition rates aredifferent for boys and girls, this will be reflected in the GER by sex.One of the difficulties in presenting the GPI is that the scale of disadvantage for girls or boys is not representedsymmetrically around 1. For example, a GPI of 0.5 indicates that the female value of the indicator beingreviewed is half the male value whilst a GPI of 1.5 (also 0.5 units away from parity) indicates the male value ofthe indicator is two-thirds of the female value (not half). Consequently, when boys are underrepresented in agiven indicator, it appears more drastic than when girls are disadvantaged.Thus, for the analysis and figures presented in this chapter, the GPI is adjusted to present disadvantagessymmetrically for both genders. The adjusted GPI is derived from the standard GPI as presented in theStatistical Tables, yet, values greater than 1.00 are different than what is listed in the Statistical Tables. Theadjusted GPI presents disparities on a comparable scale. The adjusted GPI uses the following methodology:when the ratio of female to male values of a given indicator is less than 1, the adjusted GPI is identical to theunadjusted GPI. By contrast, when the ratio is greater than 1, the adjusted GPI is calculated as the ratio ofmale to female values and the ratio is subtracted from 2. For instance, if the GER for males is 33% and 66% forfemales, the ratio of male to female GER is 0.5. Then, subtracting 0.5 from 2 gives an adjusted GPI of 1.5 whilethe unadjusted GPI would show a result of 2. Please note that only the unadjusted gPI is presented in theStatistical Tables.1
s e c t i o n 1 / T h e e x p a n s i o n o f e d u c a t i o n a l o p p o r t u n i t i e s a n d g e n d e r p a r i t yF i g u r e 4Are countries reaching gender parity in primary education?Percentage of countries within parity range at primary education, 1970-2008Percentage of countries (%)North America and Western EuropeCentral and Eastern EuropeCentral AsiaLatin America and the CaribbeanEast Asia and the PacificArab StatesSouth and West AsiaSub-Saharan Africa Source: UNESCO Institute for Statistics, Statistical Table 3.Figure 4 summarizes the percentage of countrieswithin each region that have attained gender parityin primary schooling participation at five points intime between 1970 and 2008.There are three regions with historically highproportions of countries that fall within therange of gender parity in primary education:North America and Western Europe, Central andEastern Europe, and Central Asia. About 90%of the countries in each of these regions havedemonstrated gender parity at the primary level atleast since 1990. Two regions – Latin American andthe Caribbean and East Asia and the Pacific – arein the middle range with the percent of countrieswithin the parity range progressing slightly from50% to 60% over the past 40 years.The most dramatic increases in gender parity,however, occurred in those regions where boyshad vastly outnumbered girls in primary educationin 1970 (i.e. South and West Asia, sub-SaharanAfrica and, in particular, the Arab States). In 1970,only around 10% or less of the countries in eachof these regions had achieved gender parity inprimary schooling. In 2008, almost half of themreached parity in the Arab States and more thanone in three countries have done so in the othertwo regions. In sub-Saharan Africa, the greatestprogress in gender parity at the primary level tookplace in the last ten years, partly as a result of theemphasis on universal primary education (UPE)with a special focus on girls’ education.Participation and gender parity in secondaryeducation since 1970Beyond the primary level, the length of compulsoryschooling varies widely across countries. While35 countries require only 7 years or less ofcompulsory schooling, 8 to 9 years are compulsoryin 55 countries and 10 to 12 years in 105 countries18
G l o b a l e d u c a t i o n d i g e s t 2 0 1 0 C o m p a r i n g e d u c a t i o n s t a t i s t i c s a r o u n d t h e w o r l d(see Statistical Table 2). There is greatersegmentation of school type at the secondary thanat the primary level and a slight increase in thepercentage of students in private schools, implyinga higher level and wider range of costs thanprimary schooling (Shafiq, 2007).As with the primary GPI, there has been an upwardtrend over time in the percentage of countriesreaching gender parity in secondary participation –except in sub-Saharan Africa where only Mauritiusreached parity range in 2008 compared to twocountries (Rwanda and Seychelles) in 1970 – atime when enrolment rates were at a much lowerlevel. Central and Eastern Europe has shown thehighest increase since 1990. However, as shown inFigure 5, GPIs at the secondary level do not clusterinto distinct levels in the same way as they do atthe primary level. In all regions, the percentagesof countries with gender parity in participation atthe secondary level were lower in 1970 than thepercentages at the primary level in the same year,with the exception of the Arab States and Southand West Asia where the proportions were similar.In 2008, the percentage of countries reportinggender parity at the primary level was higher thanthat at the secondary level in all regions, except inSouth and West Asia (see Statistical Table 3 and 5).As educational participation declines at thesecondary level in comparison to primary, so doesthe proportion of countries attaining genderparity (from 61% to 33% of countries). This isaccompanied by an increase in the proportion(from 6% to 29%) of countries where secondaryparticipation rates are higher for girls than forboys. However, in the countries (38%) where girlsare disadvantaged, the scale of disparity is muchgreater.F i g u r e 5Are countries reaching gender parity in secondary education?Percentage of countries within parity range at secondary education, 1970-2008Percentage of countries (%)North America and Western EuropeCentral and Eastern EuropeCentral AsiaLatin America and the CaribbeanEast Asia and the PacificArab StatesSouth and West AsiaSub-Saharan Africa Source: UNESCO Institute for Statistics, Statistical Table 5.19
s e c t i o n 1 / T h e e x p a n s i o n o f e d u c a t i o n a l o p p o r t u n i t i e s a n d g e n d e r p a r i t yWhen using individuals rather than countries asthe unit of analysis, the high populations in lessdeveloped parts of the world means that in absolutenumbers, more girls are excluded from secondaryeducation than boys. As girls enter puberty they“hit the wall of culture” (Gilligan, 1990). Emotionaland physical dangers may increase for girls as theygrow into young women due to sexual harassmentand assault and social demands for conformity tonormative gender roles. Both the daily journey toschool and the school environment itself may beunsafe for girls and young women in communitiesaround the world (Odaga and Heneveld, 1995;Abrahams et al., 2006). Traditional conceptions of“proper” roles for both women and men are morepronounced in technical and vocational educationthan in general education (UNESCO, 2010b),reflecting that resistance to boundary crossing inoccupational activities still exists.The phenomenon of late entry into schoolingand overage children in primary and secondaryeducation contributes to early school leaving.Differences between the intended age for a givengrade level and the actual age at such a grade levelis found in many regions. Being overage in schoolaffects boys and girls for different reasons. Asboys in poor and rural families become older, theyface demands for their labour outside the home.In the case of girls, they are withdrawn to take ondomestic tasks or prepare for early marriages –prevalent in some areas of the world, such as Southand West Asia and sub-Saharan Africa.Regional patterns of gender parity in secondaryeducation can be more complex to interpret thanthose pertaining to primary education. For example,participation rates in secondary school varymuch more widely across countries than those inprimary school. Participation in schooling throughthe primary level is compulsory in virtually allcountries, with only four countries not reporting aminimum of 5 to 6 years of compulsory schooling(Bhutan, Cambodia, Ethiopia and Tokelau). Whenlegal compulsion is backed by the elimination orreduction of school fees, both girls and boys are farmore likely to enter school at the expected age andto complete it in a timely fashion (Nishimura et al.,2008; Obasi, 1997).Participation and gender parity in tertiaryeducation since 1970Tertiary education is the level at which femaleenrolments have seen the greatest increase inalmost all regions. The long-term trends showmore regions switching from an enrolment infavour of males to one in favour of females. Femaleenrolments have been outnumbering males fordecades in Central and Eastern Europe, NorthAmerica and Western Europe (since before the mid-1980s), Latin America and the Caribbean (since themid-1990s), and more recently in Central Asia.Since 1970, these changing patterns ofparticipation in tertiary education shifted genderdisparity from a male to a female advantage. Whilegreat disparity at the tertiary level persists in favourof men in South and West Asia and sub-SaharanAfrica (GPI of 0.76 and 0.66, respectively), femalestudents are much more represented than menin Latin America and the Caribbean, Central andEastern Europe, and North America and WesternEurope (see Statistical Table 8).At the tertiary level, female enrolment ratios exceedthose of men in two out of every three countrieswith data. In some cases, young men may be morelikely than young women to move directly fromsecondary education into the work force or nonformaleducation or go abroad to continue theireducation.20
G l o b a l e d u c a t i o n d i g e s t 2 0 1 0 C o m p a r i n g e d u c a t i o n s t a t i s t i c s a r o u n d t h e w o r l dF i g u r e 6Are educational opportunities equally distributed?Adjusted gender parity index of the gross enrolment ratio by level of education, 2008.Primary Secondary TertiaryAdjusted gender parity index.....PARITYWORLD Arab States CentralandEastern EuropeNote: For adjusted GPI, see Box 2.Source: UNESCO Institute for Statistics, Statistical Tables 3, 5 and 8.Central AsiaEast Asiaandthe PacificLatin Americaandthe CaribbeanNorth AmericaandWestern EuropeSouthandWest AsiaSub-SaharanAfricaOverall progress towards gender parityDespite the critical progress in bridging gendergaps, persistent inequalities remain in many regionsand at different levels of education. Figure 6highlights the varying rate in gender parity atdifferent education levels across regions. TheGPI shows that only East Asia and the Pacific hasreached or is close to gender parity in all levels ofeducation. Almost all other regions are closer togender parity at the primary level than at any otherlevel of education, except for the Arab States wheretertiary education is closest to a position of parity.The majority of countries fell short of achieving thefirst step towards the gender goal (i.e. parity in bothprimary and secondary education by 2005). Themost recent statistics available for 157 countriesthat provided data for both levels of education in2008 indicate that only one country out of threehas reached parity in both primary and secondaryeducation. This gender goal is therefore still beingmissed in over 63% of countries and is at risk ofnot being attained by 2015 for 46% of countries(see Table 1). Regions in which the majority ofcountries are at risk of not achieving the goal in2015 include sub-Saharan Africa, Latin America andthe Caribbean, the Arab States, and East Asia andthe Pacific.Among countries that are currently falling shortof the goal, only four countries – Cambodia,Guatemala, Guinea and South Africa – are likely toachieve gender parity at both primary and secondarylevels in 2015 if the observed trend is maintained.Twenty-three countries are not likely to reach thegoal for primary education by 2015 while almostthree times as many countries (63) are still far fromthe gender parity goal for secondary education. Thefollowing 14 countries will not reach either primaryor secondary goals: Bermuda, Brazil, Cameroon,Democratic Republic of the Congo, Dominica,Dominican Republic, Eritrea, Lao PDR, Mali, Niger,Portugal, Sudan, Suriname and Swaziland. Nineteencountries are likely to reach parity either in primaryor secondary education – but not both.21
s e c t i o n 1 / T h e e x p a n s i o n o f e d u c a t i o n a l o p p o r t u n i t i e s a n d g e n d e r p a r i t yTa b l e 1. Which countries will achieve gender parity by 2015?Gender parity in primary and secondary education: current status and prospects for achieving the 2015 goalGender parity in primary educationAchievedin 2008Likely toachieveby 2015At riskof notachievinggoalby 2015Number ofcountriesAchieved in 2008Azerbaijan, Bahamas, Belarus, Belgium,Bolivia, Bosnia and Herzegovina,Brunei Darussalam, Bulgaria, Canada,Cape Verde, Croatia, Cuba, Cyprus,Czech Republic, Denmark, Ecuador,El Salvador, Estonia, France, Germany,Guyana, Hong Kong SAR of China,Hungary, Iceland, Indonesia, Israel,Italy, Japan, Kazakhstan, Kyrgyzstan,Lithuania, Luxembourg, Macedonia FYR,Malta, Marshall Islands, Mauritius,Moldova, Myanmar, Netherlands,Norway, Oman, Palau, Peru, Poland,Romania, Russian Federation, Serbia,Singapore, Slovakia, Slovenia, Sweden,Tonga, United States of America,Ukraine, United Arab Emirates, UnitedKingdom, Uruguay and UzbekistanGender parity in secondary educationLikely to achieveby 2015Armenia, Austria, Bahrain, Bhutan,Bulgaria, Finland, Georgia, Ghana,India, Jordan, Kuwait, Mongolia,Malawi, Senegal, Saint Lucia,Switzerland, Turkey, Uganda,Venezuela and ZimbabweAt risk of not achieving goalby 2015Anguilla, Argentina, Australia, Belize,Botswana, Colombia, Costa Rica,Fiji, Greece, Ireland, Jamaica, Kenya,Kiribati, Republic of Korea, Lebanon,Lesotho, Malaysia, Mexico, Namibia,New Zealand, Nicaragua, PalestinianAutonomous Territories, Panama,Paraguay, Philippines, Qatar, Rwanda,Samoa, Seychelles, Solomon Islands,Spain, Thailand, Trinidad and Tobago,Tunisia and Zambia58 20 35Chile, Latvia, Syrian A.R.Cambodia, Guatemala, Guinea and Aruba, British Virgin Islands, BurkinaSouth AfricaFaso, China, Djibouti, Ethiopia, Liberia,Morocco, Mozambique, Nauru,Nigeria, Sierra Leone, Tajikistan andTogo3 4 14Cayman Islands, Iran (Islamic Republicof), Macao (China) and MonacoChad, Gambia, Maldives, Mauritaniaand Saint Vincent and the GrenadinesBermuda, Brazil, Cameroon,Democratic Republic of the Congo,Dominica, Dominican Republic, Eritrea,Lao People’s Democratic Republic,Mali, Niger, Portugal, Sudan, Surinameand Swaziland4 5 14Numberofcountries65 29 63 157Notes: Countries in bold indicate that enrolment rates are higher for males.The achievement of the gender goal is defined as a GPI value ranging from 0.97 to 1.03. The reported results have been derived by applying a linear extrapolation of the changein GPI at primary and secondary levels in the period of 1999 to 2008. Where data do not exist for one or both of these two data points, figures from up to two years after 1999and before 2008 have been used with the necessary adjustment to the extrapolation model. In cases where a simple extrapolation of past rates of growth would cause the goalto be exceeded (i.e. where previous inequality in favour of boys would thus become an inequality in favour of girls, or vice versa), it is assumed that no such switch will occurand that parity will be maintained.Source: UNESCO Institute for Statistics, Statistical Tables 3 and 5.1132123The shifting picture of over- and underrepresentationby sex in schooling, especially at higher educationlevels, raises important questions about theinteractions of schooling, culture, economy andgender roles. The push and pull factors exerted bychanging economic opportunities have a differentialimpact by sex and social class and are enacted throughcultural roles assigned to women and men in specificcontexts (see Section 3). In societies that restrictyoung women’s access to public life, perseverancein schooling becomes a desirable effort for girlsin middle-class families. Conversely, as argued byscholars in Australia, academic competence hasbecome increasingly constructed as a feminine qualityamong working class and some minority males incertain contexts, meaning that boys are increasinglyturning away from educational opportunities, which iscause for concern (Kenway and Kelly, 2000).Untangling the meaning, the sources and theimpacts of current patterns of gender imbalances inschooling around the world requires both close-upviews of how schooling is experienced by girls andboys of varied social identities and careful analysis ofgender-differentiated educational data in relationshipto similarly differentiated data on labour marketparticipation, earnings and political leadership.22
G l o b a l e d u c a t i o n d i g e s t 2 0 1 0 C o m p a r i n g e d u c a t i o n s t a t i s t i c s a r o u n d t h e w o r l dLong-term trends in adult literacy andgender parityIn the long term, the increased outputs of educationsystems will eventually lead to higher levels ofeducational attainment and literacy skills amongthe adult population as a whole. At the same time,disparities in educational attainment and literacyrates today reflect patterns which have been shapedby the social and education policies of the past. In2008, an estimated 796 million adults lacked basicliteracy skills. More than one-half of the world’sadult illiterates are found in South and West Asia,notably in India (283 million), Pakistan (51 million) andBangladesh (49 million) (see Statistical Table 15).Women account for two-thirds of the globalilliterate population. The severity of this disparitybecomes even more apparent when trends over timeare considered. The share of illiterate women hasremained virtually the same over the past 20 years(63-64%) even though the size of the global illiteratepopulation has been decreasing over time.Almost three in four female illiterates in the world arefound in only eleven countries: Bangladesh, Brazil,China, Democratic Republic of the Congo, Egypt,Ethiopia, India, Indonesia, Morocco, Nigeria andPakistan.Figure 7 illustrates male and female literacy rates forthree periods, 1985-1994 (identified as 1990 in thegraph), 1995-2004 (identified as 2000) and 2008. Atthe global level, the adult literacy rate increased from76% around 1990 to 83% in 2008. This improvementwas driven mainly by an increase in the female literacyrate by 10 percentage points from 69% in 1990 to79% in 2008. Over the same period, the male literacyrate grew by only 6 percentage points, from 82% in1990 to 88% in 2008.F i g u r e 7How have trends in adult literacy changed since 1990?Adult literacy rate by sex and region, 1990-2008MaleFemaleArab StatesCentral Asia Central and Eastern Europe Adult literacy rate (%)East Asia and the PacificLatin America and the CaribbeanNorth America and Western Europe South and West AsiaSub−Saharan AfricaWORLD Source: UNESCO Institute for Statistics, Statistical Table 15 and UIS database.23
s e c t i o n 1 / T h e e x p a n s i o n o f e d u c a t i o n a l o p p o r t u n i t i e s a n d g e n d e r p a r i t yThree regions have achieved or are close to universaladult literacy in the past two decades: Central Asia,Central and Eastern Europe, and North America andWestern Europe. Somewhat lower adult literacy ratesfor men and women were reported for East Asia andthe Pacific (91% for women and 96% for men), andLatin America and the Caribbean (90% for womenand 92% for men).The remaining three regions are characterized bymuch higher shares of adult illiterates and persistentgender disparity. In the Arab States, the male literacyrate grew from 68% to 81% from 1990 to 2008and the female literacy rate from 42% to 63%. Insub-Saharan Africa, the female adult literacy rateincreased by 10 percentage points over the sameperiod, reaching 53% in 2008, while the male literacyrate grew from 63% to 71% – meaning that the gapbetween male and female literacy rates shrank onlymarginally by two percentage points.In absolute terms, the biggest increase in the literacyrate for women was in South and West Asia (34% in1990 to 51% in 2008). Over the same period, the maleliteracy rate in the region increased from 68% to 81%.Overall, the gap between men and women shrankfrom 26 to 22 percentage points in South and WestAsia. However, this remains the biggest gender gapof all regions, larger than the 18-point gap in the ArabStates and in sub-Saharan Africa.Figure 8 displays the change in GPI for the adultliteracy rate between 1990 and 2008. Worldwide,the GPI improved from 0.84 in 1990 to 0.90 in 2008.Four regions have reached gender parity (defined as aGPI between 0.97 and 1.03): Central Asia, Central andEastern Europe, Latin America and the Caribbean, andNorth America and Western Europe. Due to strongimprovements in the female literacy rate, East Asiaand the Pacific has also made great strides towardgender parity and reached a GPI of 0.94 in 2008.F i g u r e 8How big are gender differences in adult literacy rates?Gender parity index for adult literacy by region, 1990-2008 Arab States...Central AsiaCentral and Eastern Europe......East Asia and the Pacific.Latin America and the CaribbeanNorth America and Western Europe........South and West Asia.Sub−Saharan Africa.....WORLD... . . . . Gender parity indexNote: Shaded area represents gender parity (0.97-1.03).Source: UNESCO Institute for Statistics, Statistical Table 15 and UIS database.24
G l o b a l e d u c a t i o n d i g e s t 2 0 1 0 C o m p a r i n g e d u c a t i o n s t a t i s t i c s a r o u n d t h e w o r l dBy contrast, South and West Asia (GPI 0.70), sub-Saharan Africa (0.75) and the Arab States (0.78)remain far from gender parity. However, the trenddata for the past two decades show that the ArabStates and South and West Asia have moved fastertoward gender parity than sub-Saharan Africa.Across the majority of countries with genderdisparities in literacy, the gender gap is smaller forthe youth literacy rate. There is cause for concernwhere the gap is still quite large – for example,in Benin, Ethiopia, Mali and Niger, where the GPIfor youth literacy is 0.66 or below. In 39 of the146 countries with data, the GPI for the youthliteracy rate is below 0.97, indicating that youngwomen are less likely to be literate than young men.In eight countries, young women were more likelyto be literate than young men.Regional overviewsRegional profiles are presented here in order tobetter evaluate progress made towards genderparity since 1999. In particular, these profileshighlight gender parity in countries that havecontributed to the expansion of educationalopportunities in primary, secondary and tertiaryeducation. These profiles also show thatdifferences within regions are often greater thanthe differences between them.Arab StatesOverall, the volume of educational participationhas grown as reflected by the number of expectedyears of schooling which rose from 9.4 to 10.1between 1999 and 2008 (see Statistical Table 12).In 2008, boys could expect 10.6 years of schoolingcompared to 9.4 years for girls. This represents thesecond largest gender difference after sub-SaharanAfrica.GERs for primary education in the region rangedfrom 46% in Djibouti to 124% in the Syrian ArabRepublic in 2008. The regional GPI for primaryGER rose from 0.87 in 1999 to 0.92 in 2008, whichreflects the growing educational participation ofgirls. Gender parity was reported in 9 out of theregion’s 19 countries with data. The followingcountries moved from a situation favouring boysin 1999 to a position of gender parity in 2008:Lebanon, Qatar and Tunisia. However, very differentand substantial disparities persist across the region.In Djibouti, for example, boys were more likely tobe enrolled in primary school (GPI of 0.88) in 2008whereas girls had higher rates in Mauritania (GPI of1.08) in 2008 (see Statistical Table 3).Overall, secondary education rates of participationwere lower than those at the primary level. Theyranged from 24% in Mauritania to 97% in Bahrain.Girls’ participation appears to be growing at afaster rate than boys, with the GPI for the regionalsecondary GER rising from 0.88 to 0.92 between1999 and 2008. Out of 16 countries with data,only 3 reached gender parity in 2008: Oman, theSyrian Arab Republic and the United Arab Emirates.Boys had higher enrolment rates in Djibouti, SaudiArabia, Morocco, Mauritania and Sudan. However,they had lower enrolment rates in the Libyan ArabJamahiriya, the Palestinian Autonomous Territories,Tunisia and Lebanon. In Qatar, the adjusted GPI forsecondary education was as high as 1.31 in 2008.This can partly be explained by substantial maleemigration as young as at the secondary school age.As such, the suggestion of a female advantage mayneed to be put into context (see Statistical Table 5).In tertiary education, there was wide variationwith participation rates ranging from 3% (2007) inDjibouti to 53% (2008) in Lebanon. The significantgrowth in female enrolment led to a shift in theregional GPI from 0.78 in 1999 to 0.97 in 2008,indicating parity. Countries with substantial25
s e c t i o n 1 / T h e e x p a n s i o n o f e d u c a t i o n a l o p p o r t u n i t i e s a n d g e n d e r p a r i t ygrowth among females from 1999 to 2008 includethe Palestinian Autonomous Territories (adjustedGPI of 0.89 to 1.18), Lebanon (1.00 to 1.15)and Tunisia (0.97 to 1.32). Despite the growingenrolment of women, none of the 14 countrieswith data have achieved gender parity. In mostcountries, women are more likely than men topursue higher education. GPI values appear tobe in the extreme in the United Arab Emirates,Bahrain and Qatar. However, this is mainly due tothe large number of mostly male foreign workers,who do not participate in tertiary education butare represented in the underlying population dataused to calculate indicators. Very high GPI figuressuggesting a female advantage may also mask thefact that some men pursue a tertiary educationabroad. Finally, it is also important to note thatwomen remain highly disadvantaged in Djibouti andespecially Yemen, where the GPI for tertiary GERwas only 0.42 in 2008 (see Statistical Table 8).Turning to adult literacy, the regional rate rosefrom 67% to 72% between 1999 and 2008. Out ofthe 19 countries with data, only Bahrain, Kuwaitand the United Arab Emirates have reached genderparity. Everywhere else, men are more likely thanwomen to be literate. Disparities were strongest inYemen (GPI of 0.54) followed by Morocco, Sudan,Mauritania, Egypt and Algeria (see StatisticalTable 15).East Asia and the PacificIn this region, the number of expected years ofschooling rose from 10.3 to 11.8 between 1999and 2008. In 2008, boys could expect 11.7 yearsof schooling compared to 11.9 years for girls.Much of the growth since 1999 can be attributedto increased enrolment at the secondary level.Moreover, since 1999, there has been a reversal ingender patterns – girls can now expect more yearsof schooling than boys (see Statistical Table 12).GERs for primary education in the region rangedfrom 55% in Papua New Guinea to 119% inIndonesia in 2008. The GPI for this region hasremained stable at about 1.0, indicating genderparity. Across the region, 19 out of 26 countrieswith data have achieved parity at this level ofeducation. Within this group, three countries –Palau, Tonga and the Solomon Islands – were able toeliminate disparities that previously favoured boys.Overall, secondary education rates of participation(i.e. GERs) ranged from 35% in the Solomon Islandsto 149% in Australia. The regional GPI for secondaryGER shifted from 0.94 in 1999 to 1.04 in 2008. Inother words, there has been a reversal in genderpatterns resulting in a small advantage for girls.Out of 21 countries with data, 7 reached genderparity in 2008. This includes countries such asIndonesia, which successfully removed barriersto girls’ secondary education, offering themequal opportunities. However, gender disparitiesagainst girls remain acute in Cambodia (GPI of 0.82)and in Lao PDR (0.81). Even though they are lessextreme than the barriers generally facing girls, itis nonetheless important to note the disparitiesagainst boys. This is the case in China (adjustedGPI of 1.05), Fiji (1.07), Malaysia (1.07), Samoa(1.12), Thailand (1.08) and the Philippines (1.08)(see Statistical Table 5).In tertiary education, there is wide variation inGERs, which range from as low as 7% in Cambodiato 58% in Japan, 77% in Australia and 98% in theRepublic of Korea in 2008. The regional GPI forthis level of education increased from 0.81 to 1.01between 1999 and 2008. Women were highlydisadvantaged in Cambodia, where the GPI was0.54 in 2008. In contrast, men were far less likelyto pursue higher education in Brunei Darussalam(adjusted GPI of 1.50), Myanmar (1.27) and NewZealand (1.32) (see Statistical Table 8).26
G l o b a l e d u c a t i o n d i g e s t 2 0 1 0 C o m p a r i n g e d u c a t i o n s t a t i s t i c s a r o u n d t h e w o r l dThe regional adult literacy rate increased from 92%to 94% between 1999 and 2008 in East Asia and thePacific. This change was most evident in China andMalaysia. Of 17 countries with data, 5 have reachedgender parity in terms of adult literacy: BruneiDarussalam, the Democratic People’s Republicof Korea, the Philippines, Samoa and Tonga. Menare more likely to be literate in all other countries.Disparities against women are most severe inLao PDR, Cambodia and Papua New Guinea (seeStatistical Table 15).Latin America and the CaribbeanIn this region, a child could expect to receive 13.6years of schooling in 2008 compared to 12.5 in1999 (see Statistical Table 12). More specifically,in terms of gender, the school-life expectancyis slightly higher for girls than boys (13.9 vs13.3 years), which is similar to the case in moredeveloped regions (see Statistical Table 12).GERs for primary education ranged from 82% inDominica to 127% in Brazil in 2008. The regionalGPI for primary GER has remained stable at 0.97.However, there have been important shifts withincountries. In Dominica, for example, there weremore boys than girls enrolled in primary educationin 1999, as reflected by the GPI (0.95). But by 2008,boys were at a disadvantage, with the GPI reaching1.06. A very different situation is found in theDominican Republic where disparities against girlswere found in 2008 even though gender parity wasachieved in 1999. Incidentally, some of the disparityfavouring boys can be explained by the highrepetition rates for boys found in some Caribbeancountries. Overall, more than half of the countrieswith data (22 out of 36) were within the range ofgender parity in 2008. A notable exception is thehighly populated country of Brazil where the GPI of0.93 reflects higher participation rates among boys(see Statistical Table 3).Secondary education rates of participation rangedfrom 57% in Guatemala to 114% in Antigua andBarbuda. For the region, the adjusted GPI forsecondary GER remained stable at 1.07, reflecting adisparity in favour of girls. The following countrieshave achieved parity: Bahamas, Bolivia, CaymanIslands, Chile, Cuba, Ecuador, El Salvador, Guyana,Montserrat, Peru and Uruguay. However, significantdisparities persist. In Grenada, boys were at anadvantage as the GPI for secondary GER was 0.92in 2008. In contrast, girls had the advantage inHonduras and in Suriname, where the adjusted GPIwas 1.21 and 1.22, respectively (see Statistical Table 5).In tertiary education, participation levels rangedfrom less than 5% in several Caribbean countriesto 118% in Cuba (see Statistical Table 8). Across theregion, women are increasingly enrolling in tertiaryinstitutions as reflected by the adjusted GPI, whichrose from 1.13 to 1.20 between 1999 and 2008.Women are more likely to enrol than men in mostcountries and have a substantial advantage in thefollowing: Honduras (adjusted GPI of 1.33), Jamaica(1.54), Panama (1.37), Uruguay (1.43) and Venezuela(1.69). In contrast, men and women are almost equallylikely to enrol in tertiary education in Mexico afteryears of disparities against women. Gender parityhas also been reached in Colombia, where womenused to have an advantage. It is important to notethat GPI values substantially higher than 1.0 shouldbe interpreted with caution. Refer to Box 2 for adiscussion on the adjusted GPI (see Statistical Table 8).The regional adult literacy rate increased from 90%to 91% between 1999 and 2008. This was mainlydriven by progress made in Brazil, Jamaica, Mexicoand Peru. Nineteen out of 26 countries with datahave reached gender parity in terms of adult literacy.However, men are more likely to be literate in Bolivia,Ecuador, El Salvador, Guatemala, Peru and Suriname.In contrast, women are much more likely to beliterate than men in Jamaica (see Statistical Table 15).27
s e c t i o n 1 / T h e e x p a n s i o n o f e d u c a t i o n a l o p p o r t u n i t i e s a n d g e n d e r p a r i t yNorth America and Western Europe/Central and Eastern Europe/ Central AsiaAll three regions have historically maintainedgender parity in education. Between 1999and 2008, the overall volume of educationalparticipation grew, with the number of expectedyears of schooling rising from: 12.1 to 13.6 inCentral and Eastern Europe; 11.0 to 12.4 in CentralAsia; and from 15.7 to 16.0 in North America andWestern Europe. In 2008, boys and girls couldexpect approximately the same number of years ofschooling in Central and Eastern Europe as well asCentral Asia. In North America and Western Europe,however, girls could expect one full additionalyear of schooling more than boys (16.5 comparedto 15.5). Much of the growth since 1999 can beattributed to enrolments at the tertiary level (seeStatistical Table 12).In 2008, GERs for primary education in the regionsranged from 87% in Andorra and 93% in boththe former Yugoslav Republic of Macedonia andUzbekistan to 116% in Azerbaijan and 128%in Monaco. The GPI for the three regions haveremained within the range of parity since 1999. Atthe country level, 48 of 53 countries in the regionsachieved this goal in 2008. However, there wereminor disparities favouring boys in Andorra, Latvia,Monaco, Portugal and Tajikistan. Between 1999 and2008, Turkey eliminated gender disparities in favourof boys to achieve parity (see Statistical Table 3).Participation levels in secondary education rangedfrom 82% in Turkey to 127% in the Netherlandsand 162% in Monaco. The GPI for secondary GERfor Central and Eastern Europe, Central Asia and forNorth America and Western Europe has remainedvery close to or within the range of parity since1999. A slight advantage for boys is found in Centraland Eastern Europe (GPI of 0.96 in 2008) dueprimarily to substantial disparities found in Turkey(see Statistical Table 5).In tertiary education, GERs range substantially from10% in Uzbekistan to 94% in Finland. In general,women are increasingly more likely to pursuehigher education than men. This disparity has beenwidening in Central and Eastern Europe as well asNorth America and Western Europe. In particular,there have been dramatic changes in Central Asiawhere disparities previously favouring men havereversed to show an advantage for women. Thispattern of female over-representation was foundin 42 out of 48 countries with data in all threeregions. Switzerland has reached the goal of parityand Cyprus is close to the target range with a GPI of0.96. However, male students outnumber females inTurkey (GPI of 0.78), Tajikistan (0.40) and Uzbekistan(0.68) (see Statistical Table 8).Adult literacy in 2008 is almost universal in Centraland Eastern Europe (98%), Central Asia (99%)and North America and Western Europe (99%).Moreover, gender disparities were apparent only inTurkey, where the GPI of 0.84 reflects an advantagefor men. Minor gender disparities also occur inPortugal (0.96) (see Statistical Table 15).South and West AsiaEducational participation has been steadily growingover the past decade in South and West Asia,where the regional number of expected years ofschooling rose from 7.9 in 1999 to 9.7 years in 2008.In 2008, boys could expect 10.2 years of schoolingcompared to 9.2 years for girls. This comparesto 9.0 for boys and 6.8 years for girls in 1999 (seeStatistical Table 12).GERs for primary education ranged from 85% inPakistan to 128% in the Islamic Republic of Iran in2008. The regional GPI for this indicator increasedfrom 0.83 in 1999 to 0.96, reflecting the increasingeducational participation of girls relative to boys.Out of eight countries in the region with data, three28
G l o b a l e d u c a t i o n d i g e s t 2 0 1 0 C o m p a r i n g e d u c a t i o n s t a t i s t i c s a r o u n d t h e w o r l dwere within the range of gender parity. Between1999 and 2008, India and Bhutan successfullyremoved barriers to girls’ education in order toprovide equal opportunities to both groups. Thisshift has tremendous implications, especially inhigh-population countries like India. However, girlsremain severely disadvantaged in Afghanistan,where the GPI for primary GER was 0.66 in 2008. Incontrast, gender disparities slightly favour girls inBangladesh in 2008 as reflected by the GPI of 1.06(see Statistical Table 3).Secondary education participation rates rangedfrom 29% in Afghanistan to 80% in the IslamicRepublic of Iran. In the Maldives, the GER forsecondary education was 84% in 2006. From aregional perspective, the barriers to girls’ secondaryeducation are apparent but diminishing as reflectedby the increase in the GPI from 0.75 to 0.87 between1999 and 2008. As it stands, Bhutan (in 2009) andthe Islamic Republic of Iran (in 2008) are the onlycountries (out of seven with data) to achieve genderparity. Gender disparities against girls remain acutein Afghanistan (GPI of 0.38) and Pakistan (0.76). InBangladesh, however, girls have higher rates (GPI of1.05) at the secondary level (see Statistical Table 5).In tertiary education, most countries showrelatively low to moderate rates of participation,with GERs ranging from 5% in Pakistan, 7% inboth Bangladesh and Bhutan to 36% in the IslamicRepublic of Iran in 2008. The regional GPI for thisindicator increased from 0.65 to 0.76 between 1999and 2008. However, this growth is primarily due tothe situation in the Islamic Republic of Iran – theonly country to report gender disparities in favourof women – with an adjusted GPI of 1.12 in 2008.In general, relatively few women are able to pursuea higher education compared to men in the region.This is clearly the case in Bangladesh (GPI of 0.55),Bhutan (GPI Of 0.59), India (0.70) and Pakistan (0.85)(see Statistical Table 8).From a regional perspective, the adult literacyrate increased from 59% to 62% between 1999and 2008. Change was most evident in Pakistan,Bangladesh and Nepal but negligible in India. Onlythe Maldives and Sri Lanka achieved gender parityin terms of adult literacy. Men are more likely to beliterate in all other countries. Disparities are largestin Pakistan, Nepal, India, Bangladesh and the IslamicRepublic of Iran – despite recent progress in thelatter country (see Statistical Table 15).Sub-Saharan AfricaThe number of expected years of schooling in sub-Saharan Africa rose from 6.8 in 1999 to 8.4 yearsin 2008. In 2008, boys could expect 9.0 years ofschooling compared to 7.6 years for girls and thedifference (1.4 years) was the same as in 1999 (seeStatistical Table 12).GERs for primary education in the region rangedfrom 52% in Eritrea to 158% in Sierra Leone in2008, which partially reflects high repetitionrates among pupils as well as late entry due toprevious internal conflict. The GPI for primaryGER increased from 0.85 to 0.91, reflecting thegrowing participation of girls across the region.Sixteen out of 43 countries with data are withinthe range of gender parity, including Botswana,Kenya, Madagascar, Malawi, Namibia, Senegal,Uganda, the United Republic of Tanzania, Zambiaand Zimbabwe. While gender disparities continue tobe an issue in several countries, the following havemade significant progress (i.e. largest increasesin GPI towards 1.0) towards parity: Benin, BurkinaFaso, Chad, Comoros, Equatorial Guinea, Ethiopia,Gambia, Guinea, Liberia, Mali, Mozambique andNiger. Gender disparities showing a disadvantagefor girls are greatest in Chad, the Central AfricanRepublic and Somalia where values were 0.70, 0.71and 0.55, respectively (see Statistical Table 3).29
s e c t i o n 1 / T h e e x p a n s i o n o f e d u c a t i o n a l o p p o r t u n i t i e s a n d g e n d e r p a r i t ySecondary education GERs were considerably lowerthan those reported for the primary level. The ratiosvaried from 8% in Somalia to 110% in Seychelles.The GPI for secondary GER for the region as a wholedecreased from 0.82 to 0.79 between 1999 and2008. This indicates that disparities against girls (orin favour of boys) are increasing across the region.Mauritius is the only country (out of 35 with data)to achieve gender parity in terms of secondaryenrolment. Significant disparities favouring boyspersisted in 2008 in countries such as Togo, Chad,the Central African Republic, the DemocraticRepublic of the Congo and Somalia where the GPIwas 0.53, 0.45, 0.56, 0.55 and 0.46, respectively.In contrast, girls are strongly favoured in Lesotho,Namibia, Sao Tome and Principe and in Seychelleswhere the adjusted GPI was 1.24, 1.16, 1.11 and1.16, respectively (see Statistical Table 5).Participation in tertiary education is very lowacross the region. In 2008, the tertiary GERwas 10% or less in most countries, except forMauritius (26%) and Cape Verde (12%). In addition,barriers to women’s higher education appear tobe getting stronger, with the regional GPI fallingfrom 0.70 to 0.66 between 1999 and 2008. Not asingle sub-Saharan African country has achievedgender parity at this level of education. In mostcases, the disparities are against women. Theimbalance is very acute in Chad, where the GPIwas 0.15 in 2008. However, female tertiarystudents outnumber males in Botswana (adjustedGPI of 1.15), Cape Verde (1.19), Lesotho (1.16),Mauritius (1.15) and especially in Namibia (1.24)(see Statistical Table 8).The regional adult literacy rate increased from57% to 62% between 1999 and 2008. Five out of43 countries with data have now reached genderparity. Men are far more likely to be literate thanwomen in all of the remaining countries with theexception of Lesotho. Disparities are particularlyextreme (i.e. GPI values below 0.60) in the followingcountries: Benin, Burkina Faso, Chad, Ethiopia,Guinea, Guinea-Bissau, Mali, Mozambique, Nigerand Sierra Leone (see Statistical Table 15).30
S E C T I O N 2Gender and schooling trajectoriesin primary and secondary educationGender-specific indicators of school enrolment,as discussed in Section 1, provide a goodsummary measure to monitor gender disparitiesin education. Nonetheless, to better understandthe possible origins of disparities, it is importantto examine the different schooling trajectories ofboys and girls – from entry into primary throughto secondary education. As such, this sectionexamines gender differences in terms of schoolaccess, progression and completion.To effectively target education policies, it iscrucial to understand the ways in which genderdifferences are shaped at different points in theprogression of girls and boys through school.Thus, this section seeks to answer the followingquestions: to what extent do boys and girlsenter school late? Do they differ in terms ofrepeating grades or early school leaving? At whatage do they complete primary education andtransition to secondary education? Finally, thesection highlights gender differences in schoolparticipation in general and vocational educationand completion of secondary education.The patterns of gender differences in schoolprogression highlight the importance of movingbeyond simple measures of enrolments. Whilemany countries have achieved gender parityin primary enrolments, gender disparities areprevalent within the schooling process in both richand poor countries alike. Virtually all countriesmust address the gender disparities that shapethe ways in which boys and girls progress throughschool. In many countries, girls continue toface barriers that effectively exclude them fromeducation. Addressing the specific needs of boysand girls in order to keep all children in schoolthrough to completion of their education is neededin order to achieve and maintain gender equality ineducation.Disparities in entry into primary educationGlobally, in 2008, 137 million children enteredprimary school whereas 122 million were childrenat the official age to start school. In both cases,48% of these children were girls. However, it isimportant to use the gender parity index (GPI) ofgross intake ratios (GIRs) for boys and girls whenjudging disparities in order to take into accountpopulation differences between boys and girls.The GIR expresses the number of children– regardless of age – who enter school for thefirst time as a percentage of the correspondingpopulation at the official primary school-entryage. The GIR can exceed 100 if there are significantnumbers of overage or underage pupils enteringschools. In addition, repetition in the first gradeof primary school is often underestimated wherechildren who are repeating the grade are countedas new entrants.Globally in 2008, the GIR for boys (114%) wasjust slightly higher than that for girls (110%) (seeStatistical Table 2). The GPI for this ratio is 0.97,which falls within the range of parity. However, thisglobal average masks significant gender disparitiesbetween regions and countries.Intake ratios for girls are substantially lower thanthose for boys in two regions: South and West Asia31
s e c t i o n 2 / G e n d e r a n d s c h o o l i n g t r a j e c t o r i e s i n p r i m a r y a n d s e c o n d a r y e d u c a t i o nwhere the female GIR is 118% and 126% for boys andsub-Saharan Africa where the ratios are 112% forgirls and 119% for boys. The GPI, which is adjustedfor population differences, is 0.94 for both regions. Insub-Saharan Africa, there are 93 girls starting schoolfor every 100 boys. In absolute numbers, because ofthe greater number of boys of school starting age inthe population, the difference is even bigger in thecase of South and West Asia where only 87 girls startschool for every 100 boys.It should also be noted that girls are slightly less likelyto enter school than boys in the Arab States. However,the difference in ratios is so small (GPI of 0.96) thatthe region is considered close to gender parity.The nature and extent of gender disparities of intakeratios are more apparent at the country level, asshown in Figure 9. Overall, most countries havereached gender parity in terms of entry to primaryeducation. However, girls have more limited accessto school in the remaining countries. Even thoughthere are some exceptions in which boys are ata disadvantage, the disparities against girls aretypically more extreme.Of the 161 countries reporting intake ratios, 96have reached gender parity while 65 still face genderdisparities in access to primary education. In threeout of four countries, disparities are against girls.In the following 16 countries, boys are at least 10%more likely to start the first grade than girls (i.e. GPIbelow 0.90): Afghanistan, Benin, Cameroon, CentralAfrican Republic, Chad, Côte d’Ivoire, DominicanRepublic, Eritrea, Ethiopia, Guinea, Mali, Niger,Pakistan, Papua New Guinea, Tuvalu and Yemen.The greatest disparities against girls are foundin countries where children’s access to school ismore limited. This is notably the case in Papua NewGuinea, where the GIR is only 31% and the GPI is 0.87.A similar situation is found in Eritrea, Côte d’Ivoireand Niger.However, there are exceptions to this pattern.Surprisingly, the lowest GPIs occur in threecountries where the GIR is close to 100: Afghanistan(GIR 101%, GPI 0.69), Chad (GIR 99%, GPI 0.74) andthe Central African Republic (GIR 97%, GPI 0.78).Also, Benin, Cameroon, Ethiopia and Tuvalu havevery low GPIs, reflecting strong disparities againstgirls, despite gross intake ratios that exceed theglobal average (112%).Moderate disparities against girls (i.e. GPI between0.90 and 0.96) are found in 41 diverse countries.This group includes countries with a GIR below90%, such as Antigua and Barbuda, Burkina Faso,Djibouti and Jamaica. It also includes countries suchas Burundi, Mozambique, Nicaragua and SierraLeone, where the GIR exceeds 140%.Approaching universal access to primary educationgenerally leads to gender parity. However, a fewcountries have reached gender parity despitebeing far from reaching universal entry. This is thesituation in Cape Verde, Oman and the PalestinianAutonomous Territories. In this small group, manychildren never enter the countries’ school systemsyet no gender differences in intake are observed,suggesting that gender is not a major factor in thedecisions or opportunities available.There are relatively few countries (15 out of 165)where boys are at a disadvantage in terms of accessto grade 1. The strongest disparities (adjustedGPI exceeding 1.06) are found in Anguilla, theDemocratic Republic of the Congo, Dominica, theIslamic Republic of Iran, Mauritania, Montserratand Nauru. A greater intake of girls may be theresult of countries catching up with a backlog ofoverage girls who never went to school while moreboys were accommodated at the official entry age.Thus, what appears to be a disadvantage for boysmay represent a transition phase in overcoming ahistorical disadvantage for girls.32
G l o b a l e d u c a t i o n d i g e s t 2 0 1 0 C o m p a r i n g e d u c a t i o n s t a t i s t i c s a r o u n d t h e w o r l d.F i g u r e 9Do boys and girls have equal chances to enter primary school?Gross intake ratio to primary education and the corresponding gender parity index, 2008 or most recent year availableAnguilla.NauruIntake for girls is higher than for boysDominicaCongo, Dem. RepAdjusted GPI of gross intake ratio (GIR)...Papua New GuineaEritreaGambia LuxembourgMauritaniaBelarusSenegalMalawiPARITYOman PalestineCape VerdeDjiboutiCambodiaBurundiSt. Lucia LesothoVanuatuPhilippinesAntigua&BarbudaTogoComorosSouth AfricaCongoIndiaBurkina FasoLiberia Lao P.D.R.Timor-LesteMarshall Isl.GuineaSudan Cayman Isl. Dominican Rep.BeninYemenNigerMaliCameroonCôte d'IvoirePakistan TuvaluIntake for boys is higher than for girlsNicaraguaEthiopiaMozambique.Cent. Afr. Rep.ChadAfghanistan. Gross intake ratio (GIR, %)Notes: Countries with an adjusted GPI greater than 1.30 are not displayed (i.e. the Islamic Republic of Iran and Montserrat). Countries with an intake ratio greater than 160% are not displayed: Madagascar (186%),Rwanda (210%) and Sierra Leone (192%).Countries with GIRs below 85% or a GPI below 0.95 or above 1.05 are labelled.Source: UNESCO Institute for Statistics, Statistical Table 2.In order to better understand patterns in schoolaccess, it is helpful to consider the number of girlsand boys entering school at or before the officialentry age. This can be monitored using the adjustednet intake rate (ANIR), which was developed bythe UIS in order to complement the traditional netintake rate. It is used to help distinguish timely orearly entrants from overage school entrants (seeBox 3 and Statistical Table 2).In comparing GIRs and ANIRs, the GPI for the grossratio tends to be lower than that of the ANIR forcountries where girls are disadvantaged in schoolaccess. This indicates that a greater proportionof girls who do not start school on time willnever begin their education as compared to boys.Households are more likely to send a boy late toschool than a girl who is past the official entry age.This is clearly seen in Eritrea, where the GPI for theANIR is 0.88 compared to 0.84 for the GIR, whichincludes overage children.From a policy and planning perspective, thesecomparisons suggest that policies and programmesmust specifically target overage girls in order toachieve gender parity in primary education.33
S E C T I O N 2 / g E N d E r a N d S C h O O l I N g T r a j E C T O r I E S I N P r I m a r y a N d S E C O N d a r y E d U C a T I O Nb Ox The adjusted net intake rate for the first grade of primary educationWhile the traditional net intake rate (NIR) measures timely access to primary school for children of the official entryage, the adjusted net intake rate (ANIR) also accounts for children of the official entry age who entered earlier.The NIR reflects efforts made by governments to achieve universal entry to primary education for the eligiblepopulation at the official primary school-entry age. A value of 100% theoretically indicates that the system hasreached all children of the official primary school-entry age – an important step towards achieving the UPE goal.This value also implicitly reflects the achievement of equal gender access to primary education of the population atthe official entry age.The ANIR determines the proportion of children of the official primary school-entry age that are enrolled at theprimary level but not necessarily for the first time or in the first grade. The difference between 100% and the ANIRvalue provides a measure of the proportion of this population that have not achieved timely access to primaryeducation. They either never enter school or enter as overage pupils.The difference between the gross intake ratio and the ANIR gives an indication of the share of late entrants. Thedifference between the NIR and the ANIR indicates the share of children that enter school early.disparities in primary school progressionIn order to reach the goal of universal primarycompletion, it is important not only to enrol childrenbut also to ensure that all pupils remain in primaryschool until completion of the last grade. For avariety of school- or family-related reasons, largenumbers of children leave school before completion.Gender differences in school progression areanother facet of gender disparities in education.Two complementary indicators are used to monitorprogression: the survival rate to the last grade ofprimary education and the drop-out rate. box provides background information that is needed tointerpret and compare these indicators.b Ox gender dimensions of survival and drop-out ratesThe survival rate to the last grade of primary education expresses how many students out of 100 who enter schoolare expected to reach the final grade of primary education. Survival rates are calculated based on the reconstructedcohort method, which uses data on enrolment by grade for the two most recent consecutive years (t and t+1) andrepeaters by grade for the last year of these two years (t+1) to reflect current patterns of grade transition. Drop-outrates are simply the inverse of survival rates (the difference between 100 and the survival rate).A survival rate of 95% indicates that 95 out of 100 children entering school are expected to enrol for the full cyclewhile five drop out before reaching the last grade. This is identical to a drop-out rate of 5%. The gender parityindex (GPI) for both indicators is calculated as the ratio of the result for girls to that for boys. The difference lies inthe interpretation of the results. For survival rates, a GPI exceeding 1.0 indicates disparities against boys (highersurvival rates for girls). For drop-out rates, a GPI exceeding 1.0 indicates disparities against girls (since their dropoutrate is higher than that for boys).Disparities may be difficult to interpret when survival rates are very high or drop-out rates are very low. Forexample, in the case of the Syrian Arab Republic the survival rates to the last grade of primary school for boys andgirls are relatively high in this country at 96.4% and 97.0%, respectively. By subtracting these rates from 100, wefind that the drop-out rate for boys is 3.6% compared to 3.0% for girls. While the GPI for survival rates (1.01, or theratio of 97.0% to 96.4%) indicates parity, a very different perspective emerges when considering the GPI for thedrop-out rate, which is substantially higher. It is calculated as the ratio of 3.0% to 3.6%, which is 0.8. This valuereflects the disadvantage boys face in the Syrian Arab Republic. The risk of dropping out is one-fifth greater forboys than girls and would not have been captured by the GPI of the survival rate alone.This type of disparity is found in 44 out of the 131 countries with data. Thus, the gender differences are betterreflected in the GPI for drop-out rates than for survival rates. However in the case of Chad and Uganda, countrieswith very low survival rates (32% or less), gender disparities are indicated by the GPI for the survival rate ratherthan the drop-out rate (see Figure 10). In examining gender disparities related to school progression it is essentialto analyse the GPI for both drop-out and survival indicators.
G l o b a l e d u c a t i o n d i g e s t 2 0 1 0 C o m p a r i n g e d u c a t i o n s t a t i s t i c s a r o u n d t h e w o r l dFigure 10 illustrates the use of the adjusted GPI(see Box 2) for both indicators, but here the focusis specifically on drop-out rates. In almost everycountry in the world – regardless of its economicdevelopment – gender is a significant factor inschool survival. Only 12 out of 125 countriesmet gender parity in terms of both drop-out andsurvival rates: Antigua and Barbuda, Belize, BruneiDarussalam, Burkina Faso, Cameroon, Congo, Cuba,Ecuador, Madagascar, Saint Kitts and Nevis, Ugandaand Vanuatu.Among the countries with disparities in dropoutrates, boys tend to drop out more than girls.This is the case in 76 countries. In contrast,drop-out rates for girls are higher than for boysin 37 countries. Countries with the most severedisparities (22 countries), however, can be almostequally divided between those favouring girls andthose favouring boys. Severe disparities refer toan adjusted GPI that is either below 0.5 or above1.5 (see Box 2). Both figures indicate that one sex istwice as likely to drop out as the other.Boys are twice as likely to drop out from primaryschool as girls in the following 12 countries:Argentina, Austria, Bhutan, Fiji, Iran (IslamicRepublic of), Mauritius, Montserrat, Qatar, SaintLucia, Sudan, Ukraine and United Arab Emirates.Drop-out rates for girls are double those for boysin a group of 10 countries: Cayman Islands, Chile,Côte d’Ivoire, Egypt, Grenada, Jordan, Maldives,Palestinian Autonomous Territories, Saudi Arabia,and Turks and Caicos Islands.F i g u r e 1 0Adjusted GPI of dropout rates..........Girls are more likely to drop outNiuePARITYBoys are more likely to drop outAre boys or girls more likely to drop out of primary school?Gender parity in survival and drop-out rates, 2008 or most recent year availableGender parity index in drop-out ratesCent. Afr. Rep.TogoChadMozambiqueMalawi UgandaEthiopiaMadagascarNicaraguaLesothoCôte d'IvoireEgyptGrenadaSaudi Arabia ChilePalestinian A.T.Turks&Caicos Is. MaldivesCayman Islands JordanSerbiaSt. LuciaUkraineUn.Arab EmiratesQatarArgentinaBhutan AustriaMontserratFiji MauritiusIran, Isl.Rep.SudanAdjusted GPI of survival rates..........PARITYGender parity index in survival ratesGirls are more likely to reach last gradeLesothoIran, Isl.Rep.Brit. Virgin IslDominican Rep.NicaraguaNamibiaBhutanBurundiPhilippinesKenya SudanMadagascar EthiopiaUgandaMalawiGrenadaMozambiqueEritreaChileEgyptTogoGuineaTurks&Caicos Is.Cent. Afr. Rep.IraqChadCôte d'IvoireBoys are more likely to reach last gradeNiueMontserrat. Survival rate to last grade (boys and girls, %). Survival rate to last grade (boys and girls, %)Notes: Countries with survival rates exceeding 98% for both sexes - or 99% for one - are excluded.In the graph to the left, countries with survival rates below 50% or drop-out rates for one sex that are 1.5 times that of the other are labelled. In the graph to the right, countries with a survival rate that areone-tenth greater for one sex than for the other are labelled.Drop-out rates = 100 – (survival rate).The reference year is prior to 2006 for Bangladesh, Botswana, Chad, Comoros, Egypt, the Islamic Republic of Iran, Iraq, Jamaica, Kenya, Kiribati, Malta, Niue, Pakistan, Sao Tome and Principe, Tonga, the Turksand Caicos Islands, the United Arab Emirates and Yemen.Source: UNESCO Institute for Statistics, Statistical Table 4 and UIS database.35
s e c t i o n 2 / G e n d e r a n d s c h o o l i n g t r a j e c t o r i e s i n p r i m a r y a n d s e c o n d a r y e d u c a t i o nF i g u r e 11Are boys or girls more likely to repeat grades in primary school?Percentage of repeaters by gender for countries with the most severe gender differences in primary education, 2008 or most recent year availableBoysGirlsArgentina -¹Albania -⁴FijiNamibiaCape VerdeAndorraDominican Rep.Repeaters in primary education (%)TunisiaMexicoBotswana -²AlgeriaVenezuelaChile -¹IndonesiaMaldivesAntigua & BarbudaEgypt -¹MacaoThailand -¹Philippines -¹Portugal -⁴GrenadaSt. LuciaIran, Isl.Rep.DominicaBrit. Virgin Isl -¹St. Kis & NevisLatviaNotes: Countries are displayed that have a GPI for percentage of repeaters below 0.66 and have a percentage of repeaters that exceeds 2% for boys or girls. No country has an adjusted GPI exceeding 1.33.Countries are sorted in increasing order of disparities in GPI of the percentage of repeaters. When interpreting the data, -1 data refer to 2007, -2 data refer to 2006 and -4 data refer to 2004.Source: UNESCO Institute for Statistics, Statistical Table 4 and UIS database.Gender disparities in grade repetitionThe same general tendencies found in schoolprogression indicators are confirmed by repetitionrates for primary education. Almost all countriesface gender disparities in which girls tend toprogress in a more timely manner than boysthrough primary education.There are 113 countries with repetition ratesgreater than 2%. Within this group, only17 countries have roughly the same percentageof boys and girls repeating grades. Moreover, it isremarkable that gender parity was found in threecountries with very high repetition rates: Burundi(33.8%), Central African Republic (24.0%) andComoros (24.4%).Overall, boys are more likely to repeat primarygrades than girls in 90 out of 113 countries withdata. Figure 11 presents data for countries withthe greatest gender differences in grade repetition.In all of these countries, the percentage of boysrepeating grades is at least 1.5 times that of girls.Boys are twice as likely to repeat as girls (GPI forrepetition below 0.5) in five countries: British VirginIslands, Dominica, the Islamic Republic of Iran,Latvia and Saint Kitts and Nevis.36
G l o b a l e d u c a t i o n d i g e s t 2 0 1 0 C o m p a r i n g e d u c a t i o n s t a t i s t i c s a r o u n d t h e w o r l dGirls are more likely to repeat than boys in only sixcountries. Yet, these disparities are relatively small,with an adjusted GPI ranging from 1.03 to 1.08. Thisgroup includes Turkey, where 2.2% of female pupilsrepeat grades compared to 2.1% of boys, and fivesub-Saharan African countries: Chad (22.8% and21.1%), Guinea (15.9% and 15.1%), Liberia (6.9%and 6.5%), Nigeria (3.0% and 2.8%) and SierraLeone (10.2% and 9.8%).While these figures highlight differences inrepetition between girls and boys, caution isrequired when interpreting the data. Higherrepetition rates for boys reflect poor academicperformance. Yet, they may also suggest that boysreceive greater attention than girls in the schoolsystem as they may be more visible and singled outto repeat a grade.The repetition patterns found in primary educationare similar at the secondary level. In 100 outof 136 countries, repetition rates for boys aresubstantially higher than those for girls. The GPIfor the percentage of repeaters is below 0.4 inBelarus, Croatia, Cuba, Israel, Jamaica, Kazakhstan,Lithuania, the former Yugoslav Republic ofMacedonia, the Philippines, Poland and Serbia. Incontrast, girls are more likely to repeat secondaryeducation grades in just 20 out of 136 countries.The strongest disparities for girls are found inBotswana, Burundi, Rwanda, Saint Lucia and theUnited Republic of Tanzania (see Statistical Table 5).Gender differences in the ages of pupilsPrimary pupils who are significantly older (bytwo or more years) than the target age for theirgrade are at greater risk of dropping out of school,poor academic performance and not making thetransition to lower secondary education. Primarypupils are overage because they start school late orrepeat grades. There are strong gender differencesamong overage pupils.Figure 12 shows the share of boys and girls inthe last grade of primary education who are twoor more years older than the target age of thegrade. Gender differences are found in 92 out of105 countries with data. These differences weresubstantial, with adjusted GPIs for the percentageof overage boys and girls ranging from 0.2 to 1.7.In general, boys are more likely than girls to beoverage for their grade. In 85 countries in 2008,the percentage of boys who are two years over thetarget age is at least two percentage points higherthan that of girls. These countries are identified inFigure 12. In Botswana and Swaziland, for example,53% and 63%, respectively, of boys in the lastgrade of primary school are overage by two years.Among girls in these countries, the rates are 37%and 42%, respectively or more than 15 percentagepoints less than the share for boys. A similarsituation is found in another six countries, wherethe percentages of overage boys exceed those ofgirls by 10 percentage points. These countries areAlgeria, the Dominican Republic, Lao PDR, Lesotho,Morocco and Namibia.In contrast, girls were more likely to be overage (byat least two years) in seven countries. However,the gender differences were less severe – thepercentage of overage girls exceeds that of boys bymore than 5 percentage points (9% for girls and 3%for boys) in only one country - Bangladesh.School census data in many countries lack theprecision needed to identify the exact numberof overage pupils. This problem arises when thereference data for ages does not coincide with thebeginning of the school year or with the date atwhich the official school starting age is defined.Children enrolled at the right age could be wronglyidentified as being overage because their birthdaysfall between the beginning of the school yearand the reference date for ages at the end of thecalendar year. Even though this analysis focuses37
s e c t i o n 2 / G e n d e r a n d s c h o o l i n g t r a j e c t o r i e s i n p r i m a r y a n d s e c o n d a r y e d u c a t i o nF i g u r e 12Are boys older than girls in primary school?Percentage of overage boys and girls in the last grade of primary education, 2008 or most recent year availableLesothoBoys who are overage as % of all boys in the last gradeBoys are more likely to be overage than girls(86 countries with GPI of percent overage < 0.97)EthiopiaDominican Rep.SurinameMoroccoEritreaCape VerdeBelizeAlgeria IraqSouth AfricaBotswanaNamibiaZambiaSwazilandLao P.D.R.MadagascarGirls are more likely to be overage than boys(7 countries with GPI of percent overage >1.03) Girls who are overage as % of all girls in the last gradeNotes: Countries with differences between the sexes exceeding seven percentage points are labelled. For this chart, overage pupils are those who are two years or more older than the target age for their grade.Source: UNESCO Institute for Statistics, UIS database.on children being reported as overage by at leasttwo years, cross-national comparisons of thepercentage of overage children can be affected bythis measurement problem. Yet, since both boysand girls are affected similarly, this bias does notaffect the analysis of gender differences.Inequalities in progression from primary tolower secondary educationTo better understand how gender differences canaccumulate and lead to significant disparities oreventually cancel each other out, a combination ofthree indicators – the primary intake, the expectedintake to the last grade of primary (as a proxy ofcompletion), and the expected entry to secondaryeducation ratio – traces progression from primaryto lower secondary education.Figure 13 presents the cumulative effects of genderdifferences at each level of education: entry toprimary education, expected entry to the last gradeof primary education (a proxy for completion) andentry to secondary education (see Statistical Tables1 and 4). The 79 countries with available data canbe divided into five groups based on the patterns inwhich disparities evolve over the primary educationcycle.38
G l o b a l e d u c a t i o n d i g e s t 2 0 1 0 C o m p a r i n g e d u c a t i o n s t a t i s t i c s a r o u n d t h e w o r l dF i g u r e 13How does school progression in primary education and access to lower secondary education vary among countries?Gender parity index of intake to and expected completion of primary education and entry to lower secondary education,2007 or most recent year available..Arab StatesEntry to primaryCentraland EasternEuropeCentral AsiaExpected completionEast Asiaand the PacificEntry to secondaryLatin America and the Carribean........Mauritania ¹Lebanon ¹Qatar -¹TunisiaSaudi ArabiaAlgeriaMoroccoKuwaitBahrainIraq -³SudanLatviaLithuaniaMoldovaGeorgiaAzerbaijanUzbekistanTajikistan -²ChinaIndonesiaCambodiaVanuatu -¹Philippines -¹Lao P.D.R.DominicaArgentina -¹Costa RicaAruba -¹Uruguay -¹GuatemalaColombia -¹St. Lucia -³VenezuelaParaguay -¹El SalvadorHonduras -²BahamasBelizeAdjusted GPITrinidad&TobagoSuriname -¹Dominican Rep...North America andWestern EuropeSouth andWest AsiaSub-Saharan Africa..Adjusted GPI......Iceland -²BelgiumGreece -²AustriaLiechtensteinCyprusBangladesh -²Bhutan ¹Sri LankaIndia -²Pakistan -³Congo, Dem. RepMalawi -¹GambiaSenegalZambiaSaoTome&PrincipeUganda -¹Namibia -²Mauritius ¹Cape VerdeSwaziland -²MozambiqueTogo -¹Lesotho -¹Burkina Faso ¹CongoBurundi -³GuineaComoros -³EthiopiaMali ¹CameroonNiger ¹Côte d'Ivoire -¹EritreaCent. Afr. Rep. ¹Chad -²Notes: Only countries with gender disparities in at least one indicator are included.The GPI for entry to the last grade of primary education is the product of the GPIs for intake and survival ratios at this level. This value multiplied by the GPI for transition rates results in the GPI for intake insecondary education. For instance, if the GPI for the primary intake rate is 0.8 and that for survival to last grade of primary is 0.9, the expected intake to last grade of primary has a GPI of 0.72, which is theproduct of 0.8 and 0.9. When interpreting data, 1 data refer to 2007, -1 data refer to 2006, -2 data refer to 2005 and -3 refer to 2004.As data are required for the same reference period, some of the data presented in this figure may be for a different reference period than those presented in Statistical Tables 2 and 4.Source: UNESCO Institute for Statistics, Statistical Tables 2 and 4.39
s e c t i o n 2 / G e n d e r a n d s c h o o l i n g t r a j e c t o r i e s i n p r i m a r y a n d s e c o n d a r y e d u c a t i o nIn the first group of countries (7 out of 79), girls aredisadvantaged at all stages of school progression– that is fewer girls enter schools than boys whilemore drop out and finally, girls are less likely tomake the transition to secondary education. InGuinea, for example, the primary education GIR forgirls (87%) is 10 percentage points below that ofboys, with a GPI of 0.90. Survival rates to the lastgrade of primary for girls are 49% compared to60% for boys (GPI of 0.83). As a result, the expectedgross intake ratio to the last grade of primaryeducation for girls is 43% compared to 58% forboys (GPI of 0.75). Furthermore, only 26% of girlsenrolled in the last grade of primary educationactually enter secondary education compared to34% of boys. The gender differences that build upduring entry and survival result in high levels ofdisparity for entry to lower secondary education. InGuinea, 20 out of 100 boys but only 11 out of 100girls are expected to enter secondary education.The accumulation of disparities is reflected by aGPI of 0.56 for entry into secondary education. Inaddition to Guinea, this first group of countriesincludes: Chad, Eritrea, Iraq, Mali, Niger and Togo.Basically, the inequalities facing girls intensify asdisparities accumulate in the process of enteringschool, staying in the system and making thetransition to secondary education.Burkina Faso and Lao PDR are part of a secondgroup of countries. In this case, girls are lesslikely than boys to enter primary and secondaryeducation. Disparities are specifically linked toaccess to education. Once they enter primaryschool, girls tend to complete it. However, they donot have the same opportunities as boys to beginsecondary education.In the third group of countries, there is genderparity, but it is the result of disadvantages for girlsin access to the first grade of primary education,which is then balanced by boys dropping out morefrequently than girls. To begin with, girls havelower rates of access to primary education. This isreflected by the GPI of the primary GIRs in Burundi(0.92), Comoros (0.89) and Swaziland (0.94). Yet, thisdisadvantage is offset by higher survival rates forgirls, indicated by a GPI for survival rates exceeding1.06 in these countries. As a consequence of theopposing gender effects, parity is observed forcompletion rates. Even though girls are more likelyto complete primary education once enrolled, theyare less likely to pursue their studies in secondaryeducation. The GPI for transition from primary tosecondary education for this group of countriesranges from 0.78 to 0.96. Once again, the originof the gender disparities affecting girls is relatedto barriers to entry and not to their progression inschool.A similar pattern is found in the fourth group ofcountries. Boys have a higher chance of startingprimary school and dropping out. However, girlswho do manage to enter primary school tend toprogress well and make the transition to secondaryeducation. This geographically diverse groupincludes the Dominican Republic, Honduras, Sudanand Suriname. In effect, more boys are enteringprimary school but girls have the same or betterchances of completing this level of education andentering lower secondary education. As a result, theGPI for expected intake to secondary school rangesfrom 1.07 to 1.21, indicating disadvantages for boys.In the fifth group of countries, girls and boys havevirtually the same chances of entering primaryschool. However, girls outperform boys, who arefar more likely to repeat grades and drop out. Asa result, more girls complete primary school andmake the transition to secondary education. Forexample, in Indonesia, the GIR to primary educationis identical for boys and girls. However, 23% ofmale pupils drop out compared to 17% of femalepupils. These disparities increase in the next stageof the educational process where 93% of girls whocomplete primary education make the transition40
G l o b a l e d u c a t i o n d i g e s t 2 0 1 0 C o m p a r i n g e d u c a t i o n s t a t i s t i c s a r o u n d t h e w o r l dto secondary education compared to 86% of boys.This situation is also found in Bangladesh, Bhutan,Mauritius, Namibia and Uruguay.There are countries which do not fit into any ofthese five groups. Girls are more likely than boysto begin primary school but have greater chancesof dropping out in the Democratic Republic of theCongo, Malawi, Mauritania and Senegal.Gambia and Lebanon are the only two countrieswith available data where boys are disadvantagedat all stages of schooling until lower secondaryeducation. Disparity in entry to school accumulatesin the school progression, with higher drop-out andrepetition rates for boys. As a result, GPIs for thekey three indicators accumulate. In Lebanon, forexample, the primary intake for boys is 1.06 thenrises to 1.08 for completion and is 1.14 for entry tosecondary education.Gender differences in upper secondaryeducationIn upper secondary education, students typicallyhave greater choice in the type of programmes topursue than at lower education levels. Students areable to choose from more varied and specializedstudy programmes which offer different levels ofinstruction and lead to different career paths. Interms of gender patterns, the interest turns fromparticipation levels to the types of programmesthat young men and women pursue at the uppersecondary level. Perhaps most importantly, dothey complete programmes which are designedto lead to tertiary education or more specializedprogrammes that prepare them for the labourforce?There are two main types of upper secondaryeducation programmes – those that are designedto prepare students for tertiary education (ISCED3A) and those that offer more specialized trainingwhich generally does not lead to tertiary educationbut instead provides students with certificationfor entry into the labour market (ISCED 3C) (seeAnnex C). Internationally comparable completionrates for ISCED3A and ISCED3C programmes aregenerally limited to high- and middle-incomecountries. In 2007, the UIS pilot-tested a detailedquestionnaire on upper secondary education andin the future, data on secondary completion will befurther developed and integrated within the annualeducation data collection.Overall, gender disparities tend to increase in uppersecondary education, according to available datafrom 69 countries (see Statistical Table 7). Youngwomen clearly have the advantage in ISCED3Aprogrammes which lead to tertiary education.This is evident in the GPIs of graduation ratios for50 out of the 69 countries. There are nearly threefemales graduating from ISCED3A programmes forevery two males in the following countries: Austria,Iceland, Luxembourg, Malaysia, Norway, Slovenia,Tajikistan, Thailand and Tunisia.However, graduation rates for ISCED3Aprogrammes are higher for men than women in13 countries, including Liechtenstein, Panamaand the Republic of Moldova, where disparitiesare high (see Statistical Table 7). In contrast, onlyseven countries have equal shares of men andwomen graduating from these upper secondaryprogrammes: the former Yugoslav Republic ofMacedonia, Uzbekistan, China, Republic of Korea,Bolivia, Guatemala and Peru.A very different pattern emerges when consideringupper secondary programmes designed to preparestudents for the labour market or more specializedtraining (ISCED3C). Young men are more likely thanyoung women to graduate from these certificationprogrammes. This is the case for three out of everyfive (59%) countries.41
s e c t i o n 2 / G e n d e r a n d s c h o o l i n g t r a j e c t o r i e s i n p r i m a r y a n d s e c o n d a r y e d u c a t i o nIn 2008, 24% of all students pursuing upper secondaryeducation were enrolled in vocational educationprogrammes (see Statistical Table 5). Almost half ofall upper secondary students in Central and EasternEurope and Central Asia are enrolled in vocationaleducation. This is the case for only 3% of students inSouth and West Asia and 14% in sub-Saharan Africa.In the majority of countries worldwide, young men aremore likely than young women to enrol in vocationaleducation. Figure 14 presents the percentages of maleand female upper secondary students who are pursuingvocational education. In three out of four countries,male vocational students outnumber females. Therates for these young men are twice as high as thosefor young women in 23 countries. The greatest genderdisparities are found in Cyprus (21% for males and 4%for females), Kyrgyzstan (18% and 8%), Mauritius (19%and 6%), San Marino (52% and 23%), and Sao Tomeand Principe (16% and 4%).However, the opposite pattern is found in severalcountries in sub-Saharan Africa. The share of femaleupper secondary students pursuing vocationaleducation exceeds that of males by five percentagepoints in the following countries: Benin (36% for malesand 56% for females), Burkina Faso (16% and 29%),Ethiopia (48% and 64%), Mali (37% and 45%), Rwanda(42% and 48%), Sierra Leone (9% and 26%), and Togo(21% and 37%). Outside of the region, this is the casefor only one country, Azerbaijan (37% and 48%).This analysis of school progression leads to twomain conclusions. First, that access is the singlemost important cause of disparities against girls inthe pursuit of primary and secondary education. Formany different reasons, girls are being excluded fromprimary or lower secondary school and denied theirright to education. Those who are able to accesseducation, tend to progress very well but they aredisadvantaged in the complicated selection processwhereby certain children are given the chance toenter primary or secondary education while othersare denied this right.In contrast, boys are not more likely to be excludedfrom education based on their gender. This doesnot mean that boys do not face gender-specificdisadvantages in the education system, but thesource of these disparities originate from withinschools and relates to higher repetition and drop-outrates.Gender disparities can take many different formsacross countries. As a result, countries need arange of different policies to address the specificinequalities arising in school intake, withinclassrooms and in the transition to higher levelsof education. Most countries require initiatives toensure that girls have access to school. They alsoneed policies to address the different disadvantagesfacing boys and girls that arise at different stages ofschooling.42
G l o b a l e d u c a t i o n d i g e s t 2 0 1 0 C o m p a r i n g e d u c a t i o n s t a t i s t i c s a r o u n d t h e w o r l dF i g u r e 14Is vocational education mainly a male pursuit?Percentage of upper secondary students enrolled in vocational education by gender, 2008 or latest year availableCentral and Eastern EuropeMale vocational enrolment as % of total male upper secondary enrolmentNorth America and Western EuropeSouth and West AsiaCentral AsiaLatin America and CaribbeanEast Asia and the PacificArab StatesSub-Saharan AfricaSan MarinoBrit. Virgin IslSloveniaAustraliaMacedonia, FYRSwedenNorwayBulgariaGermanyFinlandMaltaBelgiumPolandDenmarkCubaRussian Fed.FranceThailand PanamaBahrainTurkeyEstonia LatviaIndonesiaMoldova MonacoGreeceIcelandPortugalAzerbaijanLithuaniaIsraelMaliArubaLebanonKazakhstanHungaryUkraineMongoliaAlgeria IraqSyrian Arab Rep.BotswanaCyprus MauritiusIran, Isl.Rep.Brunei Daruss.JordanTogoKyrgyzstan MadagascarSaoTome&PrincipeTunisia FijiBurkina FasoItalyLiechtensteinBosnia&Herzegov.AustriaCroatiaSerbiaCzech RepublicSlovakiaRomaniaSwitzerlandBeninEthiopiaSierra Leone Female vocational enrolment as a percentage of total female upper secondary enrolment (%)Notes: Countries with a difference between the sexes that is seven percentage points or more are labelled.Source: UNESCO Institute for Statistics, UIS database.43
S E C T I O N 3Education, gender and the compoundingeffects of disadvantageGender roles take different forms in differentplaces as a result of varying social and culturalconditions, including household and kin-basedpatterns. Women encounter diverse forms ofinequality through compounding factors such associo-economic status, ethnicity and geographiclocation. These factors are powerful determinantsof an individual’s life chances. A woman who ispoor or a member of a discriminated ethnic groupcan face stronger social disadvantage than a man,especially in terms of educational opportunity.This section explores the ways in which children’seducational opportunities are shaped bygender in combination with other key factors.It examines the interaction of gender with fourkey determinants of school attendance: socioeconomicstatus, geographic location, ethnicityand conflict. The section seeks to answer thefollowing questions: which children are most likelyto be excluded from education? How is genderdisparity linked to area of residence and householdwealth? How does ethnicity and armed conflictaffect educational opportunities? The section alsopresents four country studies – for Bangladesh,Guatemala, Kenya and Morocco – that describelong-term trends in educational attainment andhighlight some national characteristics that helpexplain educational participation patterns ofdifferent segments of the population.As the analysis focuses on individual andhousehold characteristics, it draws more onhousehold surveys that collect information, suchas current and past school attendance, gender, areaof residence and household wealth. Internationalsurvey programmes, such as the Demographicand Health Surveys (DHS) or Multiple IndicatorCluster Surveys (MICS), as well as nationalsurveys are usually designed to be nationallyrepresentativeand provide reliable results forbroad subgroups of the population.Socio-economic status and gender disparityin educationOne’s economic condition – usually measuredin terms of assets, income or consumption – isoften the most powerful determinant of accessto schooling and success in completing one’seducation. Throughout the world, children in thelowest income quintile are more likely to be out ofschool than children from higher income quintiles(UIS, 2005). This pattern can be confirmed usingan analysis of data from 43 of the 50 countrieswith the highest number of out-of-schoolchildren in 2007 (see Figure 15). The wealth ofdata found in household surveys helps to broadenknowledge on out-of-school children and isthe focus of a joint UNESCO/UNICEF projectto further explore issues that affect the risk ofexclusion (see Box 5).The country mean of the adjusted primary schoolnet attendance rate (NAR, see Box 6) – the shareof children of primary school age in school – forthis group of countries is 76%. In the pooresthousehold wealth quintile, only 64% of all schoolagechildren are in school, compared to 90% ofchildren in the richest quintile.44
g l O b a l E d U C a T I O N d I g E S T 2 0 1 0 C O m P a r I N g E d U C a T I O N S T a T I S T I C S a r O U N d T h E w O r l db Ox New global initiative on out-of-school children by the uiS and uNiCeFThere were 72 million out-of-school children of primary school age in 2007. Based on this number,56 million children would be out of school in 2015 (UNESCO, 2010b). To provide better information tohelp address this problem, the UIS and UNICEF have launched a new global initiative on out-of-schoolchildren as an extension of an earlier collaboration that led to the publication of Children out of school:Measuring exclusion from primary education.The earlier study by the UIS and UNICEF provided data on out-of-school children at the global level. Incontrast, the new initiative focuses on 21 countries in the developing world that were selected basedon the relevance of the issue of out-of-school children. Participating countries are: Bangladesh, Bolivia,Brazil, Cambodia, Colombia, the Democratic Republic of the Congo, Djibouti, Ethiopia, Ghana, India,Indonesia, Liberia, Nigeria, Pakistan, Philippines, Romania, Sudan, Timor-Leste, Turkey, Yemen andZambia.The initiative aims to provide new estimates of the number of out-of-school children and those inschool that are at risk of exclusion. Researchers will draw on a wide range of data from administrativerecords and from household surveys with particular emphasis on disparities in access to education bygender and other characteristics that can inform policy and planning. Moreover, the initiative aims toidentify the bottlenecks in achieving universal primary education and explain why existing policies donot yield the desired results.For individual countries, this difference is evengreater. In Nigeria, based on 2008 DHS data,attendance rates among children of primary schoolage are 31% in the poorest quintile and 89% in therichest quintile – a gap of 58 percentage points. Thegap in attendance rates between the poorest andrichest quintiles is 40 percentage points or morein the following 12 countries: Benin, Burkina Faso,Central African Republic, Eritrea, Ethiopia, Guinea,Lao PDR, Liberia, Mali, Niger, Pakistan and Yemen.In contrast, the difference between male and femaleattendance rates – on average 77% and 75%,respectively – is only two percentage points. Amongthe 43 countries with data, the difference is at most13 percentage points, which is the case in Niger. For31 of the 43 countries, the gender gap is less thanfive percentage points. In terms of the gender parityindex (GPI) – the ratio of female to male adjustedNAR – 22 of the 43 countries have reached genderparity with a GPI between 0.97 and 1.03.b Ox Net attendance rateIndicators based on household survey data differ from those using administrative data sources in termsof the methodology used to calculate school participation. Household survey estimates of schoolparticipation use data on participation reported by the head of the household while estimates based onadministrative data use official school enrolment records. For household surveys, the most commonlyusedestimate for international comparisons is attendance at some point during the school year. This isbased on the survey respondent’s answer as to whether a child in the household attended school at anytime during the school year. A child is considered to have attended even if he or she attended only oneday in the reference school year.The analysis in this section is based on the adjusted net attendance rate (NAR) as measurement ofschool attendance. The adjusted NAR measures the share of children of primary school age that areattending primary or secondary school. In contrast, the unadjusted NAR measures the share of childrenof primary school age that are attending primary school. The unadjusted NAR can overestimateexclusion from education because it considers children of primary school age in secondary school to beout of school.
s e c t i o n 3 / E d u c a t i o n , g e n d e r a n d t h e c o m p o u n d i n g e f f e c t s o f d i s a d v a n t a g eF i g u r e 1 5Which children are most likely to be excluded from education?Primary school attendance rates by gender, area of residence and household wealth, 2000 to 2008National valuesMean valuesTotal75.9MaleFemale74.977.0UrbanRural71.685.6Poorest quintileSecond poorest quintileMiddle quintileSecond richest quintileRichest quintile63.771.076.482.489.6Urban maleUrban femaleRural maleRural female70.173.286.185.2Poorest maleSecond poorest maleMiddle maleSecond richest maleRichest malePoorest femaleSecond poorest femaleMiddle femaleSecond richest femaleRichest female62.065.372.577.269.475.681.783.190.289.0 Adjusted primary school net aendance rate (%)Note: Mean values represent the unweighted averages of the results for 43 countries. Each country result has the same weight in the calculation of themean value, regardless of the size of its population or number of out-of-school children.Sources: 43 national household surveys: DHS: Bangladesh (2007), Benin (2006), Cambodia (2005-06), Colombia (2004-05), Congo (2005), DominicanRepublic (2007), Egypt (2008), Eritrea (2002), Ethiopia (2005), Ghana (2008), Guinea (2005), India (2005-06), Indonesia (2007), Kenya (2003),Lesotho (2004-05), Liberia (2007), Mali (2006), Morocco (2003-04), Mozambique (2003-04), Nepal (2006), Niger (2006), Nigeria (2008),Pakistan (2006-07), Philippines (2003), Senegal (2005), Tanzania (2004-05), Turkey (2003-04), Uganda (2006), Ukraine (2007), Zambia (2007),Zimbabwe (2005-06); MICS: Burkina Faso (2006), Burundi (2006), Central African Republic (2000), Iraq (2006), Lao PDR (2006), Malawi (2006),Thailand (2005-06), Togo (2006), Uzbekistan (2006), Venezuela (2000), Yemen (2006); other surveys used: Brazil (PNAD 2006). For information onDHS, see www.measuredhs.com; for information on MICS, see www.childinfo.org/mics.html; for information on PNAD, see www.ibge.gov.br.46
G l o b a l e d u c a t i o n d i g e s t 2 0 1 0 C o m p a r i n g e d u c a t i o n s t a t i s t i c s a r o u n d t h e w o r l dF i g u r e 16How is gender disparity linked to area of residence and household wealth?Gender parity index of adjusted primary school net attendance rate by area of residenceand household wealth, 2000 to 2008National values Mean valuesGender parity (0.97 - 1.03)Total0.96UrbanRural0.940.99Poorest quintileSecond poorest quintileMiddle quintileSecond richest quintileRichest quintile0.920.940.970.970.99. . . .Note: See Figure 15 for additional information.Sources: 43 national household surveys, 2000-2008. For further details, see Figure 15.Gender parity index (of adjusted primary school net aendance rate)A different perspective emerges when consideringgender disparities by household wealth. Acombined analysis of gender and household wealthreveals an interaction between the two. Figure16 plots the GPI of the adjusted NAR for the samegroup of 43 countries shown in Figure 15. In therichest quintile, gender parity is near 1, withan average GPI of 0.99. In the second and thirdrichest quintiles, the average GPI is 0.97, whichalso qualifies as gender parity. By contrast, in thepoorest quintile, the average GPI is 0.92, meaningthat girls are less likely to be in primary school thanboys. However, it should be noted that even in thepoorest quintile some countries – such as Brazil,Thailand, Uganda and Uzbekistan – have reachedgender parity, while in other countries – includingBenin, Guinea, Liberia, Mali, Niger and Togo– gender disparity against girls persists even in therichest quintile.The poor are more likely to cite lack of money asthe main reason for not enrolling their children inschool (Hallman et al., 2007). While it is difficult tomake generalizations, there is a tendency for poorfamilies who cannot afford education for all of theirchildren to invest their limited resources in boysrather than girls. This can be seen in the followingexamples from diverse regions.In poor rural areas in Peru, girls must often workfor the good of the household and forego theireducation, which represents an option that wouldbear a significant cost in the form of loss of incomefrom their labour in addition to direct expensesfor school supplies (Alfonso, 2008). Poor ruralgirls living in the Lao PDR spend on average morethan twice as much time as boys on householdchores and are more likely to be out of school(UNESCO, 2010b). In Nicaragua, household wealthis an important predictor of secondary schoolattendance and of being at the appropriate gradelevel (Parker, 2008). In Ghana, Malawi, Mozambique,Tanzania and Uganda, poor girls face considerablebarriers to enter school and those that do beginclasses are more likely to drop out than childrenfrom other groups (Lewin, 2009).47
s e c t i o n 3 / E d u c a t i o n , g e n d e r a n d t h e c o m p o u n d i n g e f f e c t s o f d i s a d v a n t a g eGeographic location and access to educationGeographic location makes a considerabledifference in terms of school access andcompletion. The study of household survey datafrom 43 countries with large numbers of out-ofschoolchildren found that the adjusted primaryschool NAR is on average 72% in rural areas and86% in urban areas (see Figure 15). In addition, veryclear gender disparities become apparent whencomparing the specific situation of rural boys andgirls.As shown in Figure 16, girls in rural areas are lesslikely than boys to attend school, with a GPI of0.94. Yet, in urban areas the GPI is 0.99, indicatingsimilar attendance patterns for boys and girls.The models of national development followedby many countries usually rely on rural areas tosubsidize industrial development. In these cases,industrial growth is achieved primarily through lowprices for agricultural products, lower salaries andlower economic investment in rural areas. In manyrural areas, efforts to improve economic conditionsand well-being, including education, tend to beweak and sporadic. Furthermore, the fact thatpopulations are small and spread out in ruralsettings complicates the provision of educationalservices. In a cross-national study of 30 countries,Huisman and Smits (2009) found that distance toschool had a negative impact on school enrolmentfor both boys and girls. Glick (2008) found thatgirls are the first to benefit from constructionprogrammes that reduce the average distancebetween home and school.Few studies detail school conditions and dynamicsby geographic location. One study centred onNicaragua compared school attendance in thecapital city, smaller cities and in rural areas(Parker, 2008). It was found that attendance ratesin the capital of Managua were lower than inother cities in the country. This was attributed toManagua’s layout – a large sprawling city requiringtransportation to get to secondary schools.Although girls were more likely than boys tograduate from primary school, they were less likelythan boys to attend secondary school.The changing nature of urban areas appears tobe shaping the educational opportunities of boysand girls. As urban areas expand, urban slumstend to appear. For children living in these areas,the situation can be dismal. Very often, thesecommunities do not have access to water, fuel orelectricity. As a result, the burden of domestictasks often falls on the shoulders of girls. In theend, their situation is similar to girls living in ruralareas.A study conducted in India found that only 20-27%of children of rural parents migrating to urbanslum areas have a birth certificate – the lack of oneprevents these children from enrolling in school.By comparison, 37% of children born in Delhihave a birth certificate (Tsujita, 2009). A similarsituation exists in other developing countries andgirls appear to be particularly at risk. Young girlsliving in urban slums in Kenya show a decline inschool enrolment at age nine – at least two yearsbefore male or rural enrolment levels begin to fall(Mugisha, 2006).Despite these findings, it is difficult to draw anyfirm conclusions on the impact of slum conditionson gender disparities. A study in Bangladesh, forexample, reported that boys usually join theirparents in work outside the home while girls helpmothers at home and can arrange to attend classesmore easily (Nath, 2009). Gender disparity in urbanslums in Bangladesh is strongly in favour of girls,with GPI values as high as 1.31.48
G l o b a l e d u c a t i o n d i g e s t 2 0 1 0 C o m p a r i n g e d u c a t i o n s t a t i s t i c s a r o u n d t h e w o r l dGender disparity among indigenous peoplesand ethnic minoritiesThere is a growing consensus that if socialexclusion is to be challenged, one needs toaddress the often politically sensitive andmethodologically challenging issue of collectingdata on race and ethnicity (UNESCO, 2010b). It iscrucial not only to understand the condition ofdisadvantaged groups but also to monitor theirprogress. However, this is also constrained by thedifficulties in the measurement of households’ethnic, linguistic or religious affiliations.In every region of the world, available data showthat ethnic minorities and indigenous groupsoften have less access to formal education thanother groups. For example, indigenous peoplesin Latin America, Roma in Eastern Europe andAfrican Americans in the United States usuallyhave lower attendance rates and fewer years ofeducation than members of other communitiesin their respective countries. Within the excludedgroups, gender disparities tend to be morepronounced. However, it is difficult to establishclear causal effects as ethnicity and languageare often closely linked to other determinants ofeducation such as poverty or geographic location.Nevertheless, it is possible to establish somepatterns based on evidence from a variety ofcountries.Data from several MICS conducted around2005 make it possible to link educational statusto ethnicity or language of the head of thehousehold. In general, many of the studies showthat girls and women from minority groups faceconsiderable educational disparities. Accordingto a 2006 survey in the Lao PDR, childrenfrom majority Lao-speaking households havesignificantly higher primary and secondaryschool attendance rates than speakers ofother languages. In addition, girls in Hmonghouseholds are often excluded from primary andsecondary education, with GPI values of 0.75and 0.39, respectively. Khmou girls face a similarsituation at the secondary level of education,with a GPI of 0.44. By comparison, the GPI for Laospeaking children is 1.02 in primary school and0.91 in secondary school (Ministry of Planningand Investment [Lao PDR], Ministry of Health[Lao PDR], and UNICEF, 2008).In the former Yugoslav Republic of Macedonia,Roma children had not only the lowest primaryand secondary school attendance rates of allethnic groups, they were also more likely tosuffer from gender disparity. According to a2005-2006 MICS, the primary education GPIfor children from the majority Albanian andMacedonian ethnic groups was 1.00 and 0.97,respectively. Among Roma children, the GPIwas 0.88, indicating serious barriers to girls’education (State Statistical Office [Macedonia],2007).In Thailand, according to a 2005-2006 MICS,children from Thai-speaking families had higherattendance rates in primary and secondaryeducation. Children from families that spokeother languages were less likely to attendschool, especially secondary education, wherethe NAR was 81% for Thai children and 66%for other children. Moreover, Thai childrenhad reached gender parity in primary andsecondary education. The GPI for children fromhouseholds where the primary language wasnot Thai was 0.98 at the primary level and 1.37at the secondary level (National StatisticalOffice [Thailand]; and UNICEF, 2006). Thus,boys from non-Thai speaking families weredoubly disadvantaged in terms of access tosecondary education – a reversal of the pattern49
s e c t i o n 3 / E d u c a t i o n , g e n d e r a n d t h e c o m p o u n d i n g e f f e c t s o f d i s a d v a n t a g eobserved in the Lao PDR and the former YugoslavRepublic of Macedonia where minority girls weredisadvantaged.In Nepal, gender inequalities vary betweenmembers of different ethnic groups and womenfrom lower castes are disadvantaged in theeconomic and political sphere compared towomen from higher castes (Geiser, 2005). Genderdisparities in school participation among Nepalichildren aged 6 to 10 years are highest for Dalits,Janajatis and Muslims, while there is virtually noparticipation gap between boys and girls fromthe Brahman and Chhetri castes (World Bank andDFID, 2006).In Guatemala, groups that are classified asindigenous are disadvantaged by considerablegaps in income levels and years of schooling– when compared to other groups (Telles, 2007).Among 16-year-olds in Guatemala, only 4% ofextremely poor indigenous girls attend schoolversus 20% of poor indigenous girls and 45% ofnon-poor indigenous girls (Lewis and Lockheed,2007). These data reflect the influence ofethnicity in limiting educational access and thecompounded effect of being indigenous andpoor. Indigenous people face not only barriersto school but also lower financial returns toeducation than non-indigenous people for eachyear of schooling attained (Hall and Patrinos,2006).Canada is an example of a country whereindigenous women have higher educationalattainment than indigenous men. They aremore likely to graduate from high school, enterpost-secondary education, and earn a college oruniversity degree (Lewis and Lockheed, 2007).However, both indigenous men and women havesignificantly lower educational attainment thenthe non-indigenous population.Effect of conflict on educationalopportunities for boys and girlsEstimates suggest that more than 25 million outof-schoolchildren live in low-income countriesaffected by conflict – around 35% of the globaltotal (UNESCO, 2010b) While armed conflictis devastating for all members of the affectedpopulation, war can have different effects onboys and girls. Males are more often the directparticipants in conflict. The use of boys and girlsas child soldiers or sex slaves by armed groups,often recruited or abducted from or on their wayto school, is a tragic example of war’s negativeimpact on education (UNESCO, 2010c). In theDemocratic Republic of Congo the use of rapeas a weapon of war created a great sense ofinsecurity for girls and women, discouraging themto attend school or work as teachers (UNESCO,2010c). During the civil war in Tajikistan, schoolattendance of girls was negatively affectedby the fear of attacks while travelling to class(Shemyakina, 2006).Although it is obvious that war engenders aclear physical insecurity, it also produces anenvironment of dire economic insecurity, whichoften disproportionately affects women. Theabsence or loss of male members of the familyoften imposes a greater burden on women, whoin turn may be obliged to have their girls enterthe labour market or to do more household work.War also creates many orphaned children, whichplaces burdens on girls to take on additionalresponsibilities to care for their siblings(Shemyakina, 2006).Schooling in refugee camps is often limited to thefirst grades of primary education, which leads tolow levels of education and even illiteracy amongsuch populations. Education statistics on refugeeor displaced populations are limited and often50
G l o b a l e d u c a t i o n d i g e s t 2 0 1 0 C o m p a r i n g e d u c a t i o n s t a t i s t i c s a r o u n d t h e w o r l dnot disaggregated by sex, which impedes greaterunderstanding of the situation of girls’ and boys’education. A study of schools serving displacedpopulations in Darfur found that girls represented44% of the refugee student enrolment (Lloydet al., 2010). A study of children living in Indianrefugee camps near Jammu and Kashmir foundthat the insecurity of the camp and lack ofeducational and training opportunities lead manyfamilies to marry off their daughters as childbrides (Sudan, 2010).Using household survey data for 25 countries,Bell and Huebler (2010) show that conflict hadsignificant negative effects on the educationalattainment of cohorts of school-going ageduring periods of violence. They also find thatconflict’s effect on education is not uniformacross countries. In some cases, women weredisproportionally affected, while in others, thehardest hit were men. The education of womenin conflict-affected regions of the DemocraticRepublic of the Congo, Eritrea, Congo, Ugandaand Zimbabwe was disproportionately affectedby conflict, both in terms of the proportion ofthe population with no formal education, and theaverage number of years of education attained.In contrast, males of school-going age during thelong Mozambique civil war displayed a significantdrop in average educational attainment ascompared with the pre- and post-conflict cohorts.In many cases, the effects of conflict were notequally felt by all groups in the population.Disadvantaged groups can be characterizedby multiple dimensions such as gender, region,urban or rural residence, wealth or ethnicity.In the case of Pakistan, Bell and Huebler (2010)find that girls living in the Northwest FrontierProvince during periods of conflict with India havesignificantly lower levels of average educationalattainment than girls living in other regions ofPakistan. In some countries, urban populations orthose in the richest two cohorts were the mostadversely affected by conflict. This is due to avariety of reasons. First, in the case of Cambodia,Rwanda and Somalia, armed violence explicitlytargeted the elite. Second, it is more difficult toprovide secondary than primary education duringand immediately after conflict due to the addedspecialization of resources and teachers.Case studies for gender disparity in education:Bangladesh, Guatemala, Kenya and MoroccoTo illustrate the interaction of gender, householdwealth and area of residence with other historicaland contextual factors, four case studies arepresented: Bangladesh, Guatemala, Kenya andMorocco. These countries represent four distinctgeographic regions: South Asia, Latin America,sub-Saharan Africa and the Arab States. In addition,household survey data from these countriesprovide a dynamic perspective of gender disparityacross different population groups.Household survey data show that educationalattainment in Bangladesh, Guatemala, Kenyaand Morocco has steadily increased over thepast 50 years. Figure 17 displays the share of thepopulation that have completed at least five yearsof primary education for single-year age cohortsby year of birth based on an analysis of DHS datafrom the four countries. Trends are shown for eightdifferent groups: men and women from the richestand poorest household wealth quintile, and menand women from urban and rural areas.BangladeshWith a population of about 160 million peopleliving on 143,998 square kilometres of land,Bangladesh is one of the most densely populatedcountries in the world. The number of males51
s e c t i o n 3 / E d u c a t i o n , g e n d e r a n d t h e c o m p o u n d i n g e f f e c t s o f d i s a d v a n t a g eF i g u r e 17How has educational attainment for different cohorts evolved since the 1950s?Share of population with at least five years of education by year of birth, 1950 to 1990Richest malePoorest maleRichest femalePoorest femaleUrban maleRural maleUrban femaleRural femaleBangladeshGuatemalaPercentage (%) KenyaMorocco Year of birthNote: The years of education by individuals exclude years spent repeating.Source: Bangladesh DHS 2007, Guatemala DHS 1998-99, Kenya DHS 2003 and Morocco DHS 2003-04.as a percent of total population is high at 51%,which may suggest sex-selective abortion andother practices that favour males (Amin, 2003;OECD, 2010).Women in Bangladesh have performedexceptionally well in terms of educationalattainment. Researchers explain this phenomenonby citing – among other things – culturallymandated practices of redistributing wealth fromrural elites to the impoverished majority that areundergoing transformation in favour of girls andwomen (Khan, 1999; Rhaman, 1999). As Figure17 shows, the proportion of persons with at least52
G l o b a l e d u c a t i o n d i g e s t 2 0 1 0 C o m p a r i n g e d u c a t i o n s t a t i s t i c s a r o u n d t h e w o r l dfive years of education is greater for womenthan for men among cohorts born since the late1980s, reversing the situation that existed inearlier decades. Surprisingly, gender disparity ineducation attainment in favour of girls and womenis particularly large in rural areas and in the poorest20% of all households, which may be linked torelatively higher child labour rates among boyscompared to girls in rural and poor households(ILO, 2004).However, there are still challenges to genderequality. Cultural codes of purdah in Bangladeshdiscourage women’s visibility. For example, dowrytransfer is outlawed but continues nonetheless.Educated girls are sometimes expected to providehigher dowry payments to husband’s families.Perceptions of over-educated wives fuel somecases of gender-based violence, which do occurfrequently in Bangladesh (Nosaka, 2000; OECD,2010).In a context where the mobility of women isrestricted and where security and state-fundedwelfare services are limited, women occupyvulnerable positions and many rely heavily onmen for protection. Parental preference, includingamong women, is thus strongly in favour of raisingsons (Nosaka, 2000).Organizations, such as the Grameen Bank andthe Bangladesh Rural Advancement Committee(BRAC), provide much needed micro financingcredit to women, offering low- or no-interest loansthat make women more likely to participate in thecash economy. Investment in women’s educationalso offsets the market forces that disadvantagewomen. Women’s associations and internationalnetworks have strong support within the country.Programmes that reshape location, gender andidentity may account for a generational shift inschool enrolment trends (Rhaman, 1999).GuatemalaOf Guatemala’s 13.7 million people, approximately3 million live in the capital city and its suburbs.Many are indigenous peoples driven from villagesduring the civil war who today live in extremepoverty. Significant gender differences by ethnicityand geographic location are evident in field-basedresearch (Chiappari, 2001; Hamilton, de Barrios, andTevalan, 2001; Lyon, 2008; Nelson, 2009).Figure 17 shows significant disparities ineducational attainment by gender, householdwealth and geographic location. Although theshare of the population with at least five yearsof education has increased since the 1960s,the gap between urban and rural residents andbetween the richest and poorest households hasremained virtually unchanged despite the factthat more recent school completion data points toimprovements. Gender disparities have fluctuatedand there are few signs that women’s educationalattainment is catching up with that of men. Inthe youngest cohort, nearly all men and womenin the richest wealth quintile have at least fiveyears of education. In the poorest quintile, this isthe case for less than 20% of the population. Thegap between urban and rural areas of Guatemalais smaller than between the richest and poorestquintile, but has remained unchanged over the pastfive decades. Nevertheless, recent data on primaryschool enrolment in Guatemala hint at a reductionin disparity between women and men in the years tocome (see Statistical Table 3).Many aspects of Guatemala’s history and culturehad a disproportionately negative effect on poorgirls and women. Women constitute the majorityof the indigenous poor and are more likely to beunemployed or illiterate. They occupy the lowestpaid jobs and they live in a country with one ofthe highest rates of domestic violence and rape(OECD, 2010; Rueda and Pascal, 2007). In rural53
s e c t i o n 3 / E d u c a t i o n , g e n d e r a n d t h e c o m p o u n d i n g e f f e c t s o f d i s a d v a n t a g ecommunities, cultural codes enforcing activeservice roles in the public domain for men, includingcodes of cofradías (brotherhoods, fraternities, maleeconomic cooperative ventures) exclude women.Women are highly relegated to the domestic sphere.According to the constitution and indigenous(Mayan) custom, land ownership is gender-equalbut in practice male-dominated (Lyon, 2008; OECD,2010).Household work has a negative impact on girls’schooling. Demand for girls’ household labour resultsin late school entry, and pregnancies and earlymarriages lead to high rates of drop out withoutcompletion of primary or secondary education. Whenit comes to agricultural labour, parental preference isfor sons (Chiappari, 2001; Lyon, 2008).International agencies’ actions to promote educationfor girls and women – including UNESCO’s 16-yearinnovative programme Solo para mujeres (for womenonly) – offset some of the forms of discriminationexperienced by girls and women. Notwithstandingthese programmes, inequalities are prevalent.KenyaOf Kenya’s 38 million people, more than 78% live inrural areas. Of the 22% residing in cities, many livein urban slums. Overall, Kenya has made progresstowards elimination of disparities in educationalattainment, both between men and women andbetween other groups of disaggregation. Virtuallyno women from the poorest household wealthquintile born in the early 1950s completed at leastfive years of primary education. In contrast, around60% of the poorest female cohorts born in the late1970s and early 1980s have at least five years ofeducation. While some gender disparity persists inthe poorest quintile, women have caught up to menin terms of educational attainment in the richestquintile and in urban and rural areas of Kenya.History and culture play a role in overall increasesin education and the simultaneous decrease ingender disparities. The generally stable politicalcontext of Kenya – notwithstanding riots followingelections in 2007 – ensures public services areavailable. Yet, highly educated groups living inCentral Province or Lake Victoria, for instance,have comparatively greater access to key resourcesthan those in the arid areas or Northern Kenya(Fratkin, 1994; Holtzman, 2001; Shipton, 2010).Densely populated areas around Nairobi, theCentral Highlands and Lake Victoria are home to agreater proportion of schools and adult educationprogrammes. Moreover, research indicates thaturban Kenyan professional women remit moneyto extended family members, including to theiryounger sisters and siblings’ daughters forpurposes of education (McAddo and Were, 1987;Richardson, 2001).Cultural codes regarding marriage favour men butare varied and changing. Some married womenmove to husbands’ homes and by the age of 7and 14, respectively, boys and girls are oftensaid to belong to their fathers’ lineage. Marriageis transacted through mahari or bridewealththroughout much of this region. In rural areas,cattle, goats and food are given to the bride’sfamily. In urban areas, marital transactions mayoccur through the exchange of money or consumergoods. Marriage practices have implications forgender and education as educated daughters arethought to require more expensive mahari (Bledsoeand Pison, 1994; Parkin and Nyamwaya, 1987).Rural communities perceive that highly schooledgirls present a liability in that men must providea larger “gift” to marry educated wives. Urbandwellers more typically argue that highly educatedwomen reduce the level of mahari as educatedwomen consider the exchange to be a practice ofthe past (Luke and Munshi, 2006).54
G l o b a l e d u c a t i o n d i g e s t 2 0 1 0 C o m p a r i n g e d u c a t i o n s t a t i s t i c s a r o u n d t h e w o r l dParental preference is generally for sons althoughresearch indicates that mothers sometimes preferto educate daughters because schooled daughtersare more likely to take care of their elderly mothers(Hakansson, 1994; Richardson, 2001). Untilrecently, mothers tended to supplement fathers’contributions for public school fees (Smith, 2004).However, with a drive toward universal primaryeducation and the expansion of an expensiveprivate school system, and with market forces andadvertising targeting the resources of wealthymen, women’s lower economic capacity reinforcesprinciples of male inheritance (Agesa, 2004;Holtzman, 2001; Shipton 2010). Women’s lowercapacity to take out loans means that men are in astronger position to play a lead role in a privatizededucation economy.MoroccoAbout 56% of the Moroccan population (32 million)live in urban areas – some 14 million are widelydispersed across the nutrient-poor, Amazighspeaking(Berber) countryside. Morocco’s 2004Family Code significantly improved the situation forwomen, yet there remain gender differences withrespect to educational attainment (see Figure 17).Historically, there were large gaps between thefemale and male proportion of persons with at leastfive years of education, but this gap has closed inthe richest household quintile and in urban areas.On the other hand, gender gaps continue to existin the poorest quintile and in rural Morocco. Inaddition to disparities linked to gender, there arealso large gaps between urban and rural residentsand between the richest and poorest 20% of thepopulation. However, recent data on primary schoolenrolment indicate that disparities between menand women in educational attainment can beexpected to decrease (see Statistical Table 3).Historical and cultural information help usunderstand the data from Morocco. State policiesadvance gender and educational equality andin recent years, laws and customary practiceshave been revised to favour girls’ and women(Newcomb, 2006; OECD, 2010). Civic education andschool-based campaigns have targeted changesin mudawana (cultural codes that structure termsof divorce), the age at which women marry andpolygyny. Despite improvements, gender-basedeconomic disparities persist. Daughters legally mayinherit half the wealth bequeathed to sons, and inrural areas, girls and women frequently are excludedfrom inheriting and owning land (OECD, 2010).Market forces target the resources of wealthy men.Moroccan women in rural areas are not permittedto sign their own bank loans but the Moroccangovernment has responded by developing women’scredit programmes (OECD, 2010).55
S E C T I O N4Gender, teachers and learning achievementDespite the progress towards universal primaryeducation (UPE), access to education, especially forgirls, is still a problem for a number of countries.At the same time, there is another issue that mostcountries face even when the opportunity to learnis provided. For a variety of reasons, many boys andgirls leave school before completion. The reasonsfor early school leaving are complex and there aredifferent push and pull factors. However, increasedattention is being paid to the quality of schoolingas an important factor in not only retainingchildren in school, but ultimately in equippingthem with critical knowledge, skills and values.Essentially, it is quality that transforms access toeducation into opportunity.This section looks at education quality fromthe perspective of teachers and teaching andpresents new evidence on differences betweengirls and boys in terms of learning achievement.The questions addressed here are: what factorsaffect education quality for boys and girls? Whataffect do teachers have on enrolment rates?What dictates gender differences in the teachingprofession? How do different social and economiccontexts condition gender differences in learningachievement? The results of learning achievementstudies not only reflect educational opportunityand success among girls and boys but also indicatethat there is a range of factors that help to shapeeducational success, including school conditions,home environments, student engagement andothers.Gender dimensions of education qualityMeasuring the quality of learning opportunitiesacross countries presents a number of challenges.First and foremost, the concept of quality is oftencontested and takes on certain normative orcultural perspectives. This is an area where robustmeasures of quality available across a range ofcountries and development contexts are verylimited.By focusing on organized learning, one can considerthree different dimensions of quality: wherelearning takes place (the learning environment), thecontent/experience of learning (the curriculum),and those who directly guide and facilitate learning(teachers). This also provides a way to judgeeducation quality from a gender perspective.Investigating how the three dimensions impacteducation for boys and girls can help build aclearer picture of what is required to improve itsquality. First, where does learning take place?In general, the learning environment should bechild-friendly, welcoming and secure. Other needs,such as nutrition and basic health checks shouldbe accessible where relevant. From a genderperspective, the learning environment should alsobe sensitive to the specific needs of girls, whichimplies that it should be located close to girls’homes, gender-sensitive (e.g. providing separatetoilets for girls and boys) and be free of threats aswell as from physical and sexual abuse by otherstudents or teachers.56
G l o b a l e d u c a t i o n d i g e s t 2 0 1 0 C o m p a r i n g e d u c a t i o n s t a t i s t i c s a r o u n d t h e w o r l dSecond, what is taught and learned and how?To provide good quality learning opportunities,the curriculum should be relevant to the needsof pupils, families and societies and sensitive tocultural and linguistic differences. It should also begender-sensitive, meaning that girls and womenshould not be portrayed stereotypically or in ademeaning manner that misrepresents the diversityamong girls and women in society.Finally, who guides and facilitates learning?Teachers should be well-trained and motivatedto teach. In addition, they should be trained to begender sensitive in their actions.Teachers and teachingIn order to achieve good learning outcomes,countries need to ensure that sufficient schoolplaces are provided, that school systems functioneffectively, and that there are enough teachers toensure quality instruction. Some countries face thechallenge of rapid population growth, which addspressure to expand school systems and teachingforces.The UIS estimates that, globally, 10.3 millionprimary teachers need to be recruited between2007 and 2015 to ensure that all primaryschool‐age children have access to a good qualityeducation (UIS, 2009). However, this estimategroups together diverse countries with differentneeds – from Afghanistan, which must dramaticallyexpand educational provision, to France, whererecruitment is linked solely to regular attritiontrends. As such, the global estimate masks thedegree of teacher scarcity regionally. The greatestneed for primary teachers is in sub-Saharan Africa,where almost 1 million teachers are needed inaddition to the current primary teaching force of2.8 million for a total of 3.7 million to fulfil the EFAgoals by 2015. The number of teachers needed tobroaden access to lower secondary education iseven greater. Of course, education quality doesnot depend solely on increasing the numbers ofteachers, but also improving how they are trainedand deployed within education systems.Teachers’ qualifications are an important factor toensure quality in education. While the majority ofteachers in high-income countries are trained at thetertiary level, many developing countries have highproportions of untrained or poorly trained teachers.Moreover, those who are trained, are often trainedonly at the secondary level and may lack some ofthe basic competencies required, particularly inmathematics and science.How teachers are deployed across schools speaksvolumes about the efficiency and effectivenessof schooling systems. The number of studentsrelative to the size of the teaching force representsa commonly-used indicator, the pupil-teacherratio, which is also often considered a proxy formeasuring education quality. Primary level pupilteacherratios are particularly high in Central andWestern Africa, which has the lowest participationrates for girls. High pupil-teacher ratios may furtherexacerbate the challenge to educate girls andboys and more generally contribute to loweringeducation quality.Presence of women teachersIn light of the large number of teachers to berecruited, policies that successfully balance genderin teaching workforces should be considered asthey appear to have a positive impact on access toeducation and completion, especially for girls andyoung women (UNESCO, 2000b).57
s e c t i o n 4 / G e n d e r , t e a c h e r s a n d l e a r n i n g a c h i e v e m e n tF i g u r e 18Does the presence of women primary teachers promote girls’ enrolment in secondary schooling?Gross enrolment ratio for females in secondary education and the proportion of women teachers in primary education, 2008Spain New ZealandSeychellesIreland QatarFinlandFranceGER in secondary education for females (%)TogoD.R. of the CongoDjiboutiAfghanistanCentral African RepublicSomaliaMaliGhanaGambiaSierra LeoneChadBangladeshMauritaniaCambodiaEthiopiaMozambiqueBurkina FasoKenyaBrazil MongoliaGrenadaPortugalGreeceGermany ItalySouth AfricaSloveniaTunisiaUkraineMexicoKazakhstanPeruIsraelBulgariaSaudi ArabiaMauritiusAndorraKyrgyzstanFijiOmanVenezuela SurinameDominican RepublicRussian FederationChina ThailandBelizeAnguillaIndonesiaPanamaNicaraguaMalaysiaMoroccoZambiaLao People's Democratic RepublicPakistanNigeriaEritreaNigerSudanMadagascarRwandaGuatemalaEl SalvadorSwaziland Source: UNESCO Institute for Statistics, Statistical Tables 3 and 5.Primary teachers that are female (%)LesothoNauruFigure 18 shows that the percentage of femaleteachers at the primary level roughly correlates withgirls’ gross enrolment ratios (GERs) in secondaryeducation.This correlation may partly reflect the positive rolemodels that female primary teachers play in makingthe classroom a safer and more inviting space forgirls and young women thus encouraging them tocontinue their education. In fact, countries thathave the lowest secondary enrolment rates amonggirls typically have the lowest proportions of femaleteachers in primary education. This is the case inthe Central African Republic, Chad and Somaliawhere the GERs for girls in secondary educationare 10%, 12% and 5% while the percentages ofwomen among primary teachers is 14%, 28% and17%, respectively. In light of these numbers, studies58
G l o b a l e d u c a t i o n d i g e s t 2 0 1 0 C o m p a r i n g e d u c a t i o n s t a t i s t i c s a r o u n d t h e w o r l din Tunisia have suggested that the percentage offemale teachers is one of the strongest schoolcharacteristics associated with girls’ schoolperformance (Lockheed and Mete, 2007).The presence of female teachers is, however,insufficient to ensure that girls enrol in school.Research in China suggests that teachers’expectations are one of the strongest predictorsof secondary school enrolment for girls (Lewis andLockheed, 2007). There is also a growing body ofliterature on boys’ underachievement and teacherexpectations in different regions, including theCaribbean, where boys are more likely to repeatgrades and less likely to complete their educationthan girls. The majority of primary teachersin Caribbean countries are female and someobservers believe that male primary teachers areimportant to provide a positive role model for boys.However, research has argued that both femaleand male teachers have been guilty of genderstereotyping, and that their low expectationsof boys’ behaviour and academic effectivenesscontribute to boys’ underachievement (Jha andKelleher, 2006; Kutnick, 2000; Martino and Berrill,2003). Training teachers to be gender sensitive istherefore important.Low participation rates for girls in schoolingmay reinforce the low representation of womenteachers as fewer females overall will completeteacher training programmes. Moreover, structuralconstraints contribute to the problem. Forexample, there is a tendency to deploy men ratherthan women teachers to work in rural areas eventhough these may be the same areas where schoolparticipation rates are lowest for girls. Reasonsfor this are numerous and include the reticenceto post young women in remote areas, which areoften perceived as unsafe or difficult to live in. Justthe same, young female teachers may avoid ruralpostings believing that they are unlikely to finda partner of similar education whereas marriedwomen may avoid rural areas if they are unable tobring their husbands (Mulkeen, 2010).To some extent, the gender balance in teachingvaries in more and less developed countries dueto different economic contexts and culturaltraditions. In more developed countries, theeducation sector is traditionally an importantsource of employment for women looking tohave both a family and a career (Wylie, 2000).For example, in 2008, 83% of primary teachers inNorth America and Western Europe were women.Figure 19 shows that the proportion of women inprimary teaching posts remained relatively stableover the past two decades (1990-2008) in regionswith already high levels, including Central Asia,Central and Eastern Europe, Latin America andthe Caribbean, and North America and WesternEurope. However, there was also little changein sub-Saharan Africa, which has the lowestproportion of females at the primary level in 2008.Between 1990 and 2008, the global proportionof female primary teachers increased from 55%to 62%. Growth was strongest in South andWest Asia and in East Asia and the Pacific wherethe proportion of women teachers in primaryeducation increased from 30% to 46% and from48% to 60%, respectively. Particularly for Southand West Asia, where girls are less likely to beenrolled in school, this change in the gendercomposition of teachers could in certain contextsresult in changes that may facilitate progressionand completion of girls’ education.In secondary education, global and regionalproportions of female teachers were generallylower than at the primary level. Globally, thepercentage of women teachers increased from47% to 51% between 1990 and 2008. The biggestincrease in the share – by 13 percentage points– was in Central Asia and in East Asia and thePacific. Unlike at the primary level, change was59
s e c t i o n 4 / G e n d e r , t e a c h e r s a n d l e a r n i n g a c h i e v e m e n tF i g u r e 19How has the gender balance in teaching forces changed over time?Percentage of teachers by sex in primary and secondary education, 1990-2008FemaleMalePrimary educationPercentage of primary teachers (%) Arab States Central and Eastern Central AsiaSouth and West Sub-SaharanWORLDEuropeAsiaAfricaEast Asiaandthe PacificLatin Americaandthe CaribbeanNorth AmericaandWestern EuropeSecondary educationPercentage of secondary teachers (%) Arab States Central and Eastern Central AsiaSouth and West Sub-SaharanWORLDEuropeAsiaAfricaEast Asiaandthe PacificLatin Americaandthe CaribbeanNorth AmericaandWestern EuropeSource: UNESCO Institute for Statistics, Statistical Tables 3, 6 and UIS database.not apparent in South and West Asia. Sub-SaharanAfrica was the only region where the percentage offemale secondary teachers decreased from 33% in1990 to 29% in 2008.At the country level, Figure 20 shows countrieswith data on the percentage of female teachers atprimary and secondary levels. Female teachers areless common at both primary and secondary levels inmost countries in sub-Saharan Africa. At the primarylevel, less than one teacher in five is female inthree Central and Western African countries: Benin(19%), Central African Republic (14%) and Liberia(12%). In conflict-affected Somalia, approximately17% of primary teachers are women. In contrast,women represent a clear majority in SouthernAfrican countries including, Botswana (80%),Lesotho (77%), South Africa (77%) and Swaziland60
G l o b a l e d u c a t i o n d i g e s t 2 0 1 0 C o m p a r i n g e d u c a t i o n s t a t i s t i c s a r o u n d t h e w o r l dF i g u r e 20Where are women teachers?Proportion of women teachers in primary and secondary education, 2008 or most recent year% % % % % % % % % % Data not availablePercentage of female primary teachersPercentage of female secondary teachersSource: UNESCO Institute for Statistics, Statistical Tables 3 and 6.61
s e c t i o n 4 / G e n d e r , t e a c h e r s a n d l e a r n i n g a c h i e v e m e n t(70%). They also represent a majority in CapeVerde (67%), Mauritius (68%) and Seychelles(85%). Women represent only a small proportion ofteachers in Afghanistan (29%) in South and WestAsia and Djibouti (26%) in the Arab States.Women make up more than four out of five primaryteachers in most countries in Central Asia, Centraland Eastern Europe, and North America andWestern Europe. In several countries in Centraland Eastern Europe, including Belarus, the CzechRepublic, Lithuania, the Republic of Moldova, theRussian Federation, Slovenia and Ukraine, almostthe entire primary teaching force (97% or more) isfemale. The same applies to Armenia, Kazakhstanand Kyrgyzstan in Central Asia.At the secondary level, most countries have fewerwomen teaching compared to at the primary level,yet women now make up the majority of secondaryteachers in Central Asia, Central and EasternEurope, Latin America and the Caribbean, andNorth America and Western Europe. The proportionof women teachers at the secondary level is low inmost countries in sub-Saharan Africa except certaincountries in Southern Africa as well as in Mauritiusand Seychelles. Women are least represented assecondary teachers in the Central African Republic(12%), the Democratic Republic of the Congo (11%),Eritrea (10%), Guinea (6%), Liberia (4%), Mali (10%),Somalia (14%) and Togo (7%). Some countries inother regions also have low proportions of femaleteachers. For example, in South and West Asia,the percentage of female secondary teachers inNepal is 15%, while in the Arab States only 10% ofsecondary teachers in Mauritania are women.Almost universally, women face greater obstaclesthan men in holding positions of authority inthe professional arena. Among 22 middle- andhigh-income countries with data, women holdthe majority of teaching positions in 17 countriesbut when it comes to management at the schoollevel, they hold the majority of positions in slightlymore than half (12) of these countries. Womenmake up the highest proportions of teachers andschool-level management personnel in variouscountries of Central and Eastern Europe, includingBulgaria, Lithuania and Slovakia. In contrast,women constitute the minority of both teachersand school-level management personnel in middleincomecountries, such as China, Indonesia, Mexicoand Peru.The status of the teaching professionand genderIn general, as the prestige of an occupationdeclines, the proportion of female workers tendsto increase. This in turn often corresponds to lowerlevels of remuneration. Primary teachers’ salariesin Central and West African countries, where theteaching profession often carries status – and isthus predominantly male – are substantially higherthan the salaries paid in Southern and EasternAfrican countries where women dominate. Reasonsfor this are historical and cultural. Traditionally, inthe latter group of countries, education was theresponsibility of missionaries whereas in Centraland West Africa, teachers were part of a well-paidcivil service (Pôle de Dakar, 2009).Figure 21 compares primary teachers’ salaries as aratio of average GDP per capita to the proportionof women teachers in 59 countries. It shows thatwhere teachers earn more, the proportion of femaleteachers is lower. In the Central African countriesof Chad, Mali and Niger, the starting salaries forprimary teachers were more than three times theaverage national GDP per capita, while femalesmade up approximately 13%, 27% and 43%,respectively, of the primary teaching workforce. Incontrast, although women make up the majorityof primary teachers (more than 90%) in severalcountries in Central and Eastern Europe and CentralAsia, they receive slightly less than the average62
G l o b a l e d u c a t i o n d i g e s t 2 0 1 0 C o m p a r i n g e d u c a t i o n s t a t i s t i c s a r o u n d t h e w o r l dF i g u r e 21How do primary teachers’ salaries relate to the share of men or women teachers?Primary teachers’ salaries as a ratio of average GDP per capita and the proportion of women primary teachers, 2000-2007Female primary teachers as a percentage of total number of primary teachers (%)Kazakhstan SloveniaHungary ItalyEstonia Czech RepublicBrazilAustriaUSAIsraelArgentinaLebanon Sri LankaIreland GermanySweden PortugalIcelandChileColombiaFinlandRep. of KoreaLuxembourgSpainEcuadorMalaysiaMexicoJapan PeruOmanIndonesiaEgyptLao PDRCambodiaTunisiaBangladeshPhilippinesLesothoEl SalvadorGuineaSouth AfricaKenyaBurkina FasoSenegalNigerUgandaMaliChad Ratio of primary teachers' salaries to average GDP per capitaNotes: Salaries are represented as a ratio to average GDP per capita and correspond to statutory salaries for teachers with the lowest admissible qualifications at the beginning of their careers.Source: UIS 2006a; Statistical Tables 3 and 24.GDP per capita. Exceptions to this pattern includeLao PDR and Cambodia where men make up themajority of primary teachers yet earn a startingsalary that is approximately half the average GDPper capita.Stable and equitable salaries are important factorsthat contribute to positive teacher morale. Whilerelatively higher salaries exist in many sub-SaharanAfrican countries where men dominate as teachers,salaries there have been declining relative toaverage GDP per capita since 1975 – despite the factthat many teachers need to be recruited to meet thechallenges of UPE (Pôle de Dakar, 2009). Ultimately, thismay impede the recruitment of qualified candidates tothe profession.Remuneration for public teachers has also declineddrastically in many Latin American countries withinthe past 15 years. In countries where the majority ofprimary teachers are women, this not only leads toa deterioration in the quality of the teaching force63
s e c t i o n 4 / G e n d e r , t e a c h e r s a n d l e a r n i n g a c h i e v e m e n tbut also to a devaluation of women as teachingprofessionals (De Castro and Menezes, 2008).Therefore, tackling the problem of social exclusionin education must take into consideration not onlystudents from less privileged social classes andminorities but also professional educators who arewomen.Learning outcomes and genderThe patterns of gender differences in studentachievement in reading, mathematics and sciences,as measured by cross-national studies at differentstages of basic education (including 4th, 6th and 8thgrade) as well as among upper secondary studentshave been reviewed by Ma (2007), UNESCO (2008)and the OECD (2009). Research has also addressedgender differences in learning outcomes based onthe results of individual studies in both more and lessdeveloped countries (Saito, 1998; Mullis et al., 2000;OECD, 2001, 2004 and OECD/UIS, 2003).The results of these reviews, as summarized by Ma(2007), have generated key findings related to genderdifferences and the relative underperformance ofgirls or boys in reading and language, mathematicsand science literacy. First, the advantage of girlsin reading achievement compared to boys iswidespread, considerable and found across manyachievement studies. Second, in many countries,girls are narrowing the gaps in achievement whereboys have historically held an advantage – namely inmathematics and science. However, more recent datafrom the Southern and Eastern Africa Consortium forMonitoring Educational Quality (SACMEQ) suggestthat these gender differences persist in Southern andEastern Africa.The factors underlying gender differences inperformance are thought to relate to physiologicaland social causes. A growing body of researchon the differences in neural and cognitivedevelopment among girls and boys suggests thatgirls seem to have an early advantage in verbalcognitive skills (e.g. verbal fluency, grammarand complex language) and boys in non-verbalcognitive skills (e.g. spatial tasks and mathematicalreasoning) (Weiss et al., 2003).Other research examines schools as socialinstitutions and their role alongside familiesand communities in transmitting attitudes,values and behaviours regarding gender rolesthrough teachers, staff and peers and throughthe organization of schooling (Ma, 2007). Genderdifferences were found to be the result of schooIorganization and curricula (Finn, 1980) or thegeneral learning environment (OECD, 2001) andhow they promote separate roles for girls andboys.New findings on the gender gap in developingcountries based on assessments of studentachievement has recently become available,including results of early grade readingassessments (EGRA) and the assessment of skills atthe end of primary education (i.e. SACMEQ). Earlymeasurement of reading skills is critical as it allowsfor timely intervention to ensure that all childrenlearn to read and eventually, read to learn in othersubject areas. Students who do not master reading– a prerequisite for successful performance inschool – are more likely to become frustrated anddrop out, resulting in losses in human and financialresources and the perpetuation of the cycle ofpoverty (see Box 7).64
g l O b a l E d U C a T I O N d I g E S T 2 0 1 0 C O m P a r I N g E d U C a T I O N S T a T I S T I C S a r O U N d T h E w O r l db Ox early grade reading assessmentsSince 2007, early grade reading assessments have been conducted in some 40 countries and 52 languages. Theassessment is an individually administered oral diagnostic of students’ foundation skills in reading (e.g. letternaming, familiar word reading, connected text passage reading and comprehension) and is designed to capturereading skills in the early grades of primary school.Results from individually administered early reading assessments in 10 countries and 20 languages indicate nosignificant differences between the performance of girls and boys as measured by the percentage of studentsclassified as non-readers (i.e. students unable to read a single word of connected text in a simple passage) for11 of 20 language assessments (see Table 2). Where there is a significant difference, girls tend to outperformboys, with fewer girls classified as “non-readers.” More worrisome is the high proportion of non-readers,regardless of gender. In some languages, upwards of 80% to 90% of surveyed students with at least two yearsof schooling were unable to read a single word of text.Comparing results across countries should be approached with caution due to differences in how localassessors interpret individual student results as well as differences in language structure (word length andspelling). Explanations for this gender gap in favour of girls are still being explored although some local officialshypothesize that boys are more likely to work outside of the home or have other responsibilities, which can leadto lower performance in school. Additionally, research shows that boys are more likely than girls to hold negativeattitudes towards reading. To mitigate these effects, countries need to develop strategies to ensure that allchildren become successful readers, regardless of their gender, social background or origin.Ta b l E 2. who is unable to read in the early grades of primary school?Proportion of students who were unable to read a word in a simple passage of textlanguage ofassessmentPercentage of non-readersboys girls TotalNumberof casesgambia, june 2009 English 50 57 54 399guyana, Oct 200 English 2 38 45 926haiti, may 2009Start of Grade 2; regional sample of 2 districtshonduras, Oct 200Rural sample of PROHECO schoolsKenya, Oct 2009End of Grade 3; language-based sampleFrench 49 44 47 138Creole 40 47 637Spanish 25 29 615English 1 11 14 2,000Kiswahili 2 14 19 1,998Gikuyu 17 12 15 501Dholuo 2 15 20 498liberia, june 200mali, april 2009Language-based sampleEnglish 29 19 24 1,413Bamankan 84 82 83 464Nicaragua, april 200Start of Grade 2; 20+ students in gradeBomu 92 95 93 592Fulfulde 91 91 91 437Songhoi 79 9 84 472French 94 94 94 411Spanish 11 8 9 2,002Senegal, may 2009 French 18 17 18 678Uganda, Oct 2009Language-based sampleEnglish 71 70 71 962Lango 79 84 81 491Luganda 53 48 51 468Notes: Non-readers are those students who were unable to read any words on the first line of a graded reading passage and were asked to discontinue the exercise.Shaded areas represent a statistically significant difference between girls and boys. Results were based on national samples of pupils at the end of grade 2 unless otherwise noted. Forfurther <strong>document</strong>ation regarding the assessments please see www.eddataglobal.orgSource: EGRA conducted by RTI in collaboration with Ministries of Education and funded by USAID, World Bank and The William and Flora Hewlett Foundation.
S E C T I O N / g E N d E r , T E a C h E r S a N d l E a r N I N g a C h I E v E m E N TAssessments of reading and mathematics literacyat the end of primary education help measurethe level of skills imparted by the educationsystem. Concerns about indicators that reflectonly participation in schooling have led to arenewed focus on the direct measurement ofacquired skills. While most of these studies areconducted in high- and middle-income countries,the last decade has seen an increase in studentassessments undertaken in low-income countries.One example is the SACMEQ assessmentadministered among 14 countries in Southern andEastern Africa (see Box 8).The assessments of learning achievement acrosscountries can help illustrate how different social andeconomic contexts condition gender differencesin learning achievement. Both at the beginningand at the end of primary education, assessmentsconducted in developing countries point to dismaloutcomes that fall far short of the desired or evenminimum mastery of the intended reading ormathematics curriculum for both girls and boys.At the end of primary schooling, there seems tobe more significant gender gaps in terms of bothreading (favouring girls) and mathematics (favouringboys), which have been persistent during the lastdecade in countries in Southern and Eastern Africa.b Ox reading and mathematics skills at the end of primary educationFollowing its mandate to improve overall educational quality, the SACMEQ has comparededucational achievement among girls and boys at the end of primary schooling in14 sub-Saharan African countries since 1995. The most recent waves of the learningassessment took place in 2000 and 2007. The results reflect differences in theperformance of girls and boys and how they have changed over time.figure 22 shows two striking features related to gender differences in reading andmathematics achievement for 2000 and 2007. First, the set of countries in which girlsoutperformed boys in reading and mathematics in 2000 – including Seychelles, Mauritiusand Botswana – were almost exactly the same set of countries in 2007. Similarly, the setof countries where boys outperformed girls in 2000, including Tanzania, Mozambique andMalawi, were almost exactly the same set of countries in 2007. Second, not only were thedirections in gender differences consistent for countries across 2000 and 2007, but sowere the magnitudes of these differences.
G l o b a l e d u c a t i o n d i g e s t 2 0 1 0 C o m p a r i n g e d u c a t i o n s t a t i s t i c s a r o u n d t h e w o r l dF i g u r e 22How do the performance of girls and boys compare at the end of primary school?Gender differences in reading and mathematics in 15 Southern and Eastern African countries, 2000 and 2007SeychellesBotswanaSouth AfricaMauritiusSwazilandLesothoUgandaNamibiaKenyaZambiaZanzibarMozambiqueMalawiTanzaniaZimbabweBoys'achievementis higher-16-5-6Reading achievement (2000) Reading achievement (2007)-200na568-40 -20 0 20 40 60Score points9272726Girls'achievementis higher65SeychellesBotswanaSouth AfricaMauritiusSwazilandLesothoUgandaNamibiaKenyaZambiaZanzibarMozambiqueMalawiTanzaniaZimbabweBoys'achievementis higher-16-10-6-6-5-2-40 -20 0 20 40 60Score points88111413233030Girls'achievementis higher63SeychellesMauritiusBotswanaSouth AfricaLesothoUgandaSwazilandNamibiaMalawiZambiaZanzibarMozambiqueKenyaTanzaniaZimbabwe-33Boys'achievementis higher-22-18-14-10-10Mathematics achievement (2000) Mathematics achievement (2007)-4-5-53na-40 -20 0 20 40 60Score points981138Girls'achievementis higherSeychellesMauritiusBotswanaSouth AfricaLesothoUgandaSwazilandNamibiaMalawiZambiaZanzibarMozambiqueKenyaTanzaniaZimbabweBoys'achievementis higher-31-22-12-12-9-9-10-5-2-20Girls'achievementis higher-40 -20 0 20 40 60Score points671532Notes: Countries are sorted on the basis of gender differences for each subject in 2000. Bars marked in darker colour represent statistically significant differences between girls and boys.SACMEQ score points are standardised based on a SACMEQ mean of 500 and a standard deviation of 100.For further <strong>document</strong>ation regarding the assessments please see www.sacmeq.org.Source: Saito (in preparation). Southern African Consortium Monitoring Education Quality (SACMEQ). For more information, see www.sacmeq.org.67
S E C T I O N 5Gender, participation and field of studyin tertiary educationOver the past four decades, access to tertiaryeducation has expanded at an unprecedentedrate and this expansion has benefited women.Overall, the number of women enrolled in tertiaryinstitutions has grown almost twice as fast as thatof men since 1970. However, rising enrolment ratesand student numbers offer a limited view of thecomplexities shaping the educational career pathsof men and women.This section presents a range of indicators thathelp frame the diverse factors that shape genderpatterns in tertiary education. It tracks thedramatic expansion in women’s participation since1970 and the correlation with national wealth. Inaddition, this section asks the following questions:How does national wealth relate to genderparity in tertiary education? What proportionof men and women study abroad? What is thegender composition by field and levels of tertiaryeducation? What proportion of women pursues acareer in research and development?The expansion of opportunities for tertiaryeducationGlobally, there have been considerable changes intertiary education since 1970. Figure 23 illustratesthe evolution of male and female participation intertiary education by region. The adjusted genderparity index (GPI) represents the female and malegross enrolment ratios (GERs) and is used toexpress gender disparities on a comparable scale(see Box 2).In the 1970s, male participation rates in tertiaryeducation were at least one quarter higher than forfemales in all regions of the world with the notableexception of Central and Eastern Europe, wherefemale rates have been higher than male ratesfor more than four decades. Female participationgrew far more than male participation in NorthAmerica and Western Europe and in Latin Americaand the Caribbean. From the beginning of the1980s, participation rates for women caught upand then surpassed those of men in North Americaand Western Europe. The same was true from thebeginning of the 1990s in Latin America and theCaribbean and more recently in Central Asia. In2008, the GER for women was at least one quarterabove that for males in three regions: NorthAmerica and Western Europe (adjusted GPI of 1.24),Central and Eastern Europe (adjusted GPI of 1.22)and Latin America and the Caribbean (adjusted GPIof 1.20).More recently, after decades of strong growth infemale participation, two regions reached genderparity: the Arab States, and East Asia and thePacific. However, a different pattern is found inSouth and West Asia and in sub-Saharan Africa,where overall participation in tertiary education isvery low and women continue to be disadvantaged.The tertiary GER in South and West Asia for men is14%, which is 1.3 times as high as that for women(11%). The tertiary GER in sub-Saharan Africa formen is 7.3%, which is 1.5 times as high as that forwomen (4.8%).The situation in sub-Saharan Africa improved inthe 1990s. While the GER for women remainedconstantly less than half of the ratio for men (GPIbetween 0.45 and 0.5) from 1970 to 1990, by 2000,68
G l o b a l e d u c a t i o n d i g e s t 2 0 1 0 C o m p a r i n g e d u c a t i o n s t a t i s t i c s a r o u n d t h e w o r l dF i g u r e 2 3Female GER 1.66 timesas high as male GER(adjusted GPI of 1.4)What are the global trends in gender disparities for tertiary education?Adjusted gender parity index for gross enrolment ratio for tertiary education by region, 1970 to 2008Female GER 1.25 timesas high as male GER(adjusted GPI of 1.2)Parity for men and women(GPI of 0.97 - 1.03)WORLDAdjusted gender parity indexMale GER 1.25 timesas high as female GER(adjusted GPI of 0.8)Male GER 1.66 timesas high as female GER(adjusted GPI of 0.6)Male GER 2.5 timesas high as female GER(adjusted GPI of 0.4)North America and Western EuropeCentral and Eastern EuropeLatin America and the CaribbeanMale GER 5 timesas high as female GER(adjusted GPI of 0.2)Central AsiaEast Asia and the PacificArab StatesSouth and West AsiaSub-Saharan AfricaNotes: The white band denotes a GPI between 0.97 and 1.03, which represents gender parity. GPI and adjusted GPI are identical for results below 0.97, making the label “GPI”and “adjusted GPI” interchangeable for these values (see Box 2).Sources: UNESCO Institute for Statistics, UIS database and Statistical Table 8.women caught up to a GER that is two-thirds that ofmen (GPI of 0.68). Since then, the regional GPI hasstagnated for tertiary education, which may reflectthe shift in priority towards achieving the goal ofuniversal primary education (UPE).National wealth provides an important contextfor the participation of men and women in tertiaryeducation. Overall, women are more likely to pursuetertiary education in countries with relativelyhigher levels of national wealth. Figure 24 presentsthe adjusted GPI of the GER for tertiary education inrelation to gross domestic product (GDP) per capita.Only 7 out of the 130 countries with data haveachieved gender parity at the tertiary level.Women face significant barriers to tertiaryeducation in countries with the lowest levels ofnational wealth as shown in Figure 24. Out of the130 countries with data, there are 34 countrieswhere the GDP per capita is less than PPP$ 3,000.In 31 of these countries, men have higher tertiaryparticipation rates than women. Most of thesecountries (22 out of 31) are located in sub-Saharan69
s e c t i o n 5 / G e n d e r , p a r t i c i p a t i o n a n d f i e l d o f s t u d y i n t e r t i a r y e d u c a t i o nAfrica. The largest disparity is found in Chad, wherethe GPI is 0.15. A similar situation is found in Ethiopia(GPI of 0.31), Eritrea (0.32), Guinea (0.34) and Niger(0.34). Notable exceptions among the 34 low-incomecountries are Kyrgyzstan, Lesotho and the Republicof Moldova where female participation rates intertiary education is higher than those of men.The same pattern is found in other countries withrelatively low GDP per capita in other regions. In Asia,women face considerable disparities in the followingcountries: Tajikistan (GPI of 0.40), Cambodia (0.54),Bangladesh (0.55), Uzbekistan (0.68), India (0.70),Timor-Leste (0.71), Lao PDR (0.78) and Pakistan(0.85). In the Arab States, women in Yemen have thelowest participation rate compared to men (GPI of0.42). In Djibouti, the GPI is 0.69 while it reaches 0.89in Morocco.Even a slight rise in national wealth can correlateto fewer gender disparities. Sub-Saharan Africancountries with higher levels of wealth also reporthigher enrolment rates for women than men. Forexample, the adjusted GPI for tertiary enrolment is1.13, 1.15, 1.19 and 1.24 in Botswana, Mauritius,Cape Verde and Namibia, respectively.The tertiary GER for women is higher than that formen in 92 out of 131 countries with data, as indicatedby an adjusted GPI greater than 1.03 (see Figure 24).This group includes North American and the WesternEuropean countries which have higher levels of GDPper capita. Among them, Iceland has the highestadjusted GPI (1.48), indicating that females are almosttwice as likely to study at the tertiary level than males.The United States – the largest tertiary educationsystem in this region and the second largestworldwide – has an adjusted GPI of 1.29. AmongCentral and Eastern European countries, Latvia hasthe highest adjusted GPI of 1.47 followed by Estonia(adjusted GPI of 1.41). The Russian Federation – thelargest tertiary education system in this region – alsohas a high adjusted GPI of 1.26.The same pattern is found in Latin America andthe Caribbean. In Argentina, Brazil and Venezuela,which have relatively large tertiary educationsystems, the adjusted GPI is 1.34, 1.23 and 1.41,respectively, indicating that male participationrates are one-third, one-quarter and two-fifthsrespectively, below those of females. In countrieswith relatively small tertiary systems, femalesparticipate more in tertiary education than males.In the Cayman Islands, Bermuda, Jamaica and SaintLucia, the adjusted GPI exceeds 1.50.There are notable exceptions among high GDPper capita countries (i.e. above PPP$ 10,000).Men continue to outnumber women in tertiaryeducation in Cyprus, Japan, Macao (China), theRepublic of Korea and Turkey (see Figure 24).In the Republic of Korea, even though genderparity in terms of upper secondary graduateshas been reached (see Statistical Table 7), femaleparticipation in tertiary education is relatively lowwhen compared to their male counterparts (GPIof 0.69). Women account for only two out of everyfive tertiary students. In the Republic of Korea,this imbalance may be explained by the traditionalviews of women in this society (OECD, 2009).Further contextualization is needed to understandwhy not as many women pursue higher educationas men in countries with greater resources andopportunities.Empirical research highlights three reasons forthe growing participation of women in highereducation. First, higher levels of schooling arerequired to attain social mobility (Takyi-Amoako,2008). Second, higher education leads toindividual returns in the form of higher incomeseven though women must have more years ofeducation than men to secure jobs of comparablepay – a pattern found both in industrialized anddeveloping countries. Finally, there has been anongoing diffusion of ideas on the subject of genderegalitarianism across countries.70
G l o b a l e d u c a t i o n d i g e s t 2 0 1 0 C o m p a r i n g e d u c a t i o n s t a t i s t i c s a r o u n d t h e w o r l dF i g u r e 24Adjusted gender parity indexFemale GER5 times as highas male GER(adjusted GPI of 1.8)Female GER2.5 times as highas male GER(adjusted GPI of 1.6)Female GER1.66 times as highas male GER(adjusted GPI of 1.4)Female GER1.25 times as highas male GER(adjusted GPI of 1.2)Parity for menand women(adjusted GPI 0.97~1.03)Male GER1.25 times as highas female GER(adjusted GPI of 0.8)Male GER1.66 times as highas female GER(adjusted GPI of 0.6)Male GER2.5 times as highas female GER(adjusted GPI of 0.4)Male GER5 times as highas female GER(adjusted GPI of 0.2)How does national wealth relate to gender parity in tertiary education?Adjusted gender parity index for gross enrolment ratio for tertiary education and GDP per capita ($PPP), 2008Arab StatesCentral and Eastern EuropeCentral AsiaEast Asia and PacificLatin America and CaribbeanNorth America and Western EuropeSouth and West AsiaSub-Saharan AfricaTimor-LesteSt. LuciaJamaicaUnited Arab EmiratesIcelandLatviaBrunei DarussalamBelizeUruguayVenezuela Estonia Saudi ArabiaLithuaniaSlovakiaMongoliaPanamaSwedenNorwayHondurasArgentinaTunisiaNew ZealandRepublic of MoldovaKazakhstan Belarus HungarySlovenia DenmarkAlgeria SerbiaPolandKyrgyzstanGuyana ParaguayMalta ItalyRomaniaU.S.A.Grenada Bulgaria Russian Fed. Czech Rep. U.K.NamibiaUkraineMalaysiaFrancePhilippinesBrazilIsrael AustraliaLebanon CroatiaArmenia ThailandFinlandFijiGeorgiaFYR MacedoniaPortugal SpainIrelandLesothoCape VerdeMauritiusAustriaOmanJordanEcuador Iran BotswanaLuxembourgEl Salvador Costa RicaGreeceNetherlandsChinaPeruTrinidad and TobagoHong Kong SAR of ChinaGuatemalaChileColombiaSwitzerlandSwazilandMexicoCyprusIndonesiaMacao, ChinaMadagascarMoroccoJapanPakistanBoliviaAzerbaijanUgandaCameroonLaoTurkeyRwandaKenyaDjiboutiBangladeshGhana SenegalMalawi Burkina FasoCambodiaMozambiqueCôte d'IvoireBurundiMali U.R. of TanzaniaCentral African Republic+¹YemenTajikistanNigerEritreaGuineaEthiopiaChadNigeriaIndiaUzbekistanBhutanDominicaRepublic of KoreaBahrain0100 1,000 10,000 100,000GDP per capita (PPP$ on log scale)Note: For information on the adjusted GPI see Box 2.Sources: GPI of GER for tertiary education: UNESCO Institute for Statistics, Statistical Table 8. GDP per capita: World Bank.Once women gain access to higher education, theytend to exceed men in grades, evaluations anddegree completion (Jacobs, 1996; Buchmann et al.,2008). The growth in female participation shouldbe seen as a positive development, especially giventhe spillover effects that benefit the individual,households and societies.Statistics showing the over-representation ofwomen in higher education are not necessarilythe results of affirmative action in their favoursince this type of legislation is rare. They partlyreflect the changing values and attitudes relatedto the role and aspirations of women in societythat are the legacy of social change and feministmovements which emerged globally in the 1960sand 1970s. They may also signal either differentalternatives in the labour force for men or structuralbarriers that prevent men from participating in thetertiary education system.Indeed, female over-representation in highereducation has yet to translate into proportionalrepresentation in the labour market or access toleadership and decision-making positions (OECD,2010; UNDP, 2009). A striking example is the71
S E C T I O N / g E N d E r , P a r T I C I P a T I O N a N d f I E l d O f S T U d y I N T E r T I a r y E d U C a T I O NNational University of Lesotho, where more than70% of the students are women and yet men holdthe top administrative positions at the university.The pattern of male prevalence in managementpositions is found across countries, suggestingthat the growing presence of women in highereducation has less of an impact at the level of thelabour market.Overall, historical contexts help to shapeeducational opportunities and participationpatterns, both in domestic education systemsand studying abroad (see Box 9). As well, familybackground, academic ability and attitudestoward school also predict expectations regardinghigher education. For girls, the development ofpositive attitudes toward schooling increases theireducational expectations more than for boys. Crossnationalresearch on educational expectationsregarding higher education reveals that it is not thatboys are lowering their expectations (except in theUnited States). Instead, girls’ expectations are risingat a faster pace than those of boys – and so is theirenrolment in higher education (McDaniel, 2010). Itis also likely that in countries with rapidly growingtertiary education systems, girls may anticipategreater opportunities for higher education and thusraise their own expectations.b Ox 9Opportunities for women and men to study abroadIn 2008, around 3 million students were enrolled in tertiary educational institutionsoutside of their country of origin, and 49% of these students were women.UIS data on mobile students provide valuable insights on the different opportunitiesavailable to men and women. It is important to note the limited coverage of these data asthey are based on available information provided by five major host countries – Australia,Canada, France, South Africa and the United Kingdom. These five countries hosted 32% ofthe world’s mobile students in 2008.figure 2 compares the differences in the proportions of women studying abroad andthose remaining in the regional tertiary education systems. Women in South and WestAsia are the least likely to study abroad, making up only 27% of the region’s share ofmobile students. Women in the Arab States are also more likely to remain in their countriesof origin, accounting for 46% of the regional student population compared to 34% of theregion’s share of mobile students.In contrast, women in Central and Eastern Europe are the most likely to pursue theireducation abroad, accounting for 65% of the region’s mobile students and 55% of regionalstudents. A similar situation is found in East Asia and the Pacific, where the female share ofthe region’s mobile students (53%) is higher than that of domestic students (49%). Womenalso account for more than half of mobile students in Central Asia (51%), Latin America andthe Caribbean (52%) and North America and Western Europe (54%).figure 2 presents the female proportions of mobile students from selected countries.Overall, women are more likely to study abroad in countries with high rates of femaleparticipation in tertiary education. In Namibia, for example, women account for six out often mobile students and more than half (57%) of domestic tertiary students (see StatisticalTable 8 for females as a percentage of local tertiary enrolment). Yet, in Pakistan, womenaccount for only 45% of the regional tertiary students and 16% of mobile students. InIndia – which sends the largest number of students abroad after China – women accountfor 39% and 27% of the regional and mobile student populations, respectively.2
G l o b a l e d u c a t i o n d i g e s t 2 0 1 0 C o m p a r i n g e d u c a t i o n s t a t i s t i c s a r o u n d t h e w o r l dF i g u r e 2 5How many women study abroad compared to those that study locally?Percentage of female mobile students in Australia, Canada, France, South Africa and the United Kingdomcompared to female enrolment by region, 2008Women as a percentage of total mobile students* from a given regionWomen as a percentage of local tertiary enrolment in a given regionFemale (%) South and WestAsiaArab StatesSub-SaharanAfricaCentral AsiaLatin Americaand the CaribbeanEast Asiaand the PacificNorth America andWestern EuropeCentral andEastern EuropeNotes: Data from Canada are for 2006.* Based on total number of mobile students who studied in Australia, Canada, France, South Africa and the United Kingdom.Sources: UNESCO Institute for Statistics, UIS database; Australia: Department of Education, Employment and Workplace Relations, Canada: Statistics Canada, France: Ministère de l’Education nationale,South Africa: Department of Education, United Kingdom: Higher Education Statistics Agency.F i g u r e 26What is the share of female mobile students?Percentage of female mobile students in Australia, Canada, France, South Africa and the United Kingdomby country of origin, 2008Women as a percentage of total mobile students*Female (%) PakistanSaudi ArabiaBangladeshIndiaSri LankaLebanonIranAlgeriaNigeriaSenegalMoroccoTunisiaCameroonBotswanaFranceHong Kong SAR of ChinaGreeceZimbabweIndonesiaKenyaMauritiusViet NamBelgiumMalaysiaSingaporeSpainGermanyPortugalChinaItalyThailandU.S.A.NamibiaIrelandPolandRomaniaNotes: Countries selected have more than 5,000 mobile students and, mostly, more than one-third of their total outbound mobile students based in those five host countries.* Based on total number of mobile students who studied in Australia, Canada, France, South Africa and the United Kingdom.Sources: See Figure 25.73
s e c t i o n 5 / G e n d e r , p a r t i c i p a t i o n a n d f i e l d o f s t u d y i n t e r t i a r y e d u c a t i o nGender differences among tertiary graduatesby field of studyThe preferences of women and men for specific fieldsof study in higher education are shaped by theirindividual histories and everyday realities as well astheir material conditions. Schooling and career choicesare best understood as the product of the interactionbetween macro-level variables (international andnational contexts), meso-level factors (linked toinstitutions and disciplinary fields) and micro-levelforces (individual and familial influences), which affectboth what disciplines are seen as “suitable” for menand women, and subsequently, what employment isdesired and pursued.The extent to which the gender composition by fieldof study differs from the entire graduate populationis shown in Figure 27. It displays graduate data forfour broad fields of education compared to thegender composition of the total number of graduates(see Statistical Table 11).Overall, women outnumber men as tertiarygraduates in 76 of 97 countries with data (seeFigure 27). In the following countries, there are atleast two female graduates for every male graduate:Latvia, where women account for 72% of tertiarygraduates in 2008, Anguilla (91%), Bahrain (68%),Barbados (74%), Estonia (69%), Guyana (70%),Hungary (67%), Lithuania (67%), Myanmar (70%),Qatar (67%) and Uruguay (69%).The opposite pattern is found in Ethiopia where only19% of tertiary graduates are female. This is alsothe case for Burkina Faso (20%), Cambodia (27%),Mauritania (26%) and Morocco (32%).Among the four broad fields presented in Figure 27,the field of Education is most popular with womenand appears to be dominated by them in mostcountries. In contrast, women are least likely tograduate in the field of Engineering, manufacturingand construction.In all 80 countries with data, there were farmore men graduating in the field of Engineering,manufacturing and construction than women in2008. In countries, such as Bahrain, Hungary, Latvia,Lithuania and Guyana, two-thirds of all tertiarygraduates are women. Yet, they account for onethirdor less of graduates in the field of Engineering,manufacturing and construction.The prevalence of male graduates in the Engineering,manufacturing and construction field is found inmost countries (60), as illustrated in Figure 27.Uruguay and Mongolia are the closest to achievinggender balance in the engineering-relateddisciplines. Yet, even in developed countries, suchas Germany, Japan, the United States, the UnitedKingdom and Switzerland, women account for justone-tenth to one-fifth of graduates, respectively,in this field. This pattern also applies to countrieswith low levels of female participation in tertiaryeducation. In Ethiopia, for example, women accountfor just 19% of tertiary graduates in general and14% of those gained a degree in the engineeringrelateddisciplines.The field of Education is clearly the most popularfield of study for women. In 62 out of 80 countrieswith data, women are more likely to graduate inthe field of Education. In 2008, at least nine out ofevery ten tertiary Education graduates were womenin Bermuda (100%), Estonia (94%), Armenia (94%),Croatia (94%), Lebanon (92%), Romania (92%),Serbia (90%) and the United Arab Emirates (92%).There are, of course, exceptions to these patterns.In these cases, the gender composition in the fieldof Education more closely reflects general patternsof tertiary participation. In Morocco, for example,women make up 32% of the tertiary graduatepopulation and 38% of those students graduatingin the field of Education. A similar situation is foundin Brunei Darussalam, Cambodia, Ethiopia, Namibiaand Swaziland.74
G l o b a l e d u c a t i o n d i g e s t 2 0 1 0 C o m p a r i n g e d u c a t i o n s t a t i s t i c s a r o u n d t h e w o r l dF i g u r e 27How does the gender composition of tertiary graduates differ by field of education?Women as a percentage of the total number of tertiary graduates in selected fields of education by country, 2008.More female than male graduates in this fieldbut fewer female than male graduates in all fieldsFewer female than male graduates in this fieldand in all fieldsMore female than male graduates in this fieldand in all fieldsFewer female than male graduates in this fieldbut more female than male graduates in all fieldsEngineering, manufacturing and constructionEducationBermudaPercentage of female graduates in this field (%)Uruguay -1MongoliaSerbia Panama -1Denmark -1EstoniaMalaysiaRomaniaSwedenIran +1 BrazilLatviaColombiaLiechtensteinNorway Bahrain -2Korea, Rep.HungaryViet NamU.K. -1Chile U.S.A.MadagascarUnited Arab Emirates -1AzerbaijanNamibiaGermanyEthiopiaMoroccoSwitzerlandGuyanaUzbekistan +1ArubaJapanMalawi -1CambodiaSaudi Arabia -2 Percentage of female graduates in all fields (%)Percentage of female graduates in this field (%)JapanU. K. -1Iran +1 Mexico Brunei DarussalamCubaSaudi Arabia -2Macao, ChinaGuatemala -1TurkeyColombiaNamibiaUzbekistan +1 Swaziland -2Viet NamLao -2 Armenia -1EstoniaLebanon Croatia -1Romania United Arab EmiratesAzerbaijan -1SerbiaLatviaJordan -1 Qatar Uruguay -1BarbadosLithuania GuyanaChile U.S.A.HungaryKorea, Rep.Poland -1Morocco MadagascarMalawi -1CambodiaEthiopia Percentage of female graduates in all fields (%)ScienceSocial sciences, business and lawPercentage of female graduates in this field (%)Bahrain -2Saudi Arabia -2Brunei DarussalamAlgeria NamibiaRomaniaUzbekistan +1ArgentinaGeorgiaItaly-1 Barbados-1 Lebanon-1Azerbaijan Jordan Uruguay -1CubaFinland EstoniaLao -2GermanyGuyanaTurkeySlovakiaU.S.A.ColombiaU.K. -1 LithuaniaFrance BrazilKorea, Rep.LatviaAustraliaNorwayMauritania -2BelgiumSwitzerland ChileHungaryMalawi -1 JapanEthiopiaMoroccoIran +1OmanQatarMyanmar -1Percentage of female graduates in this field (%)EthiopiaCayman IslandsLatviaBarbadosBermuda Guyana-1Slovenia Bahrain -2Malaysia QatarCuba-1 Myanmar -1Lao -2 PalestinianUruguaySpain-1FranceBrunei DarussalamSerbia ArgentinaMexico-1IcelandIran +1 BelgiumU.S.A.ChileBrazilViet NamGermanyMadagascarArmenia -1Switzerland OmanLiechtensteinJordan -1JapanMoroccoMalawi -1CambodiaAzerbaijanUzbekistan +1CambodiaMacao, ChinaAndorra Percentage of female graduates in all fields (%) Percentage of female graduates in all fields (%)Source: UNESCO Institute for Statistics, Statistical Table 11.75
s e c t i o n 5 / G e n d e r , p a r t i c i p a t i o n a n d f i e l d o f s t u d y i n t e r t i a r y e d u c a t i o nWhile gender preferences are strong in Educationand in Engineering, manufacturing and construction,a mix of patterns is found in the fields of Scienceand Social sciences, business and law. Table 3presents the percentage of women graduatesin the broad fields of Science and Social sciences,business and law and their associated subfields.Within the broad field of Science, women in allregions were more likely to graduate in the Lifesciences than men. In the Arab States, nearlythree-quarters of all graduates in this subfield arewomen.Far more men than women graduate from theComputing subfield in all regions. North Americaand Western Europe had the lowest percentage(21%) of women graduating in Computing.Furthermore, this region also had the lowestpercentage of women graduating in the Physicalsciences (43%) and Mathematics and statistics(48%). Women outnumbered men in both of thesesubfields in other regions, with the exception ofCentral Asia, where women account for 44% ofgraduates in the Physical sciences.In the broad field of Social Sciences, Journalismand information is more popular among womenthan men, who account for more than three-fifthsof graduates in this subfield. A similar pattern isfound in Social and behaviour science, with womenrepresenting almost two out of three graduates inthis subfield.Overall, Business and administration is the mostpopular programme in most countries (seeStatistical Table 11). In the Arab States and CentralAsia, men outnumber women in this subfield, whilethe opposite is true in the other regions. Womenare also more likely to graduate than men in thefield of Law in all regions, with the exception ofCentral Asia.From tertiary education to a career in researchIt is now almost universally accepted thatinnovation is one of the main engines of economicgrowth and poverty alleviation. Since research anddevelopment (R&D) is one of the key componentsof innovation, it is important to take a criticallook at the gender composition of the work forceengaged in research.To analyse gender composition in academicaccomplishments at the highest levels ofeducation, UIS education data as well as keyscience and technology indicators (also producedby the UIS) are used. Researchers are definedas professionals engaged in the conception orTa b l e 3. How does the gender composition of tertiary graduates differ by subfield?Percentage of women graduates in the fields of Science and Social sciences, business and law by region, 2008RegionBroad and subfield Science Social sciences, business and lawLife sciencesPhysicalsciencesMathematicsand statisticsComputingSocial andbehaviourscienceJournalismandinformationBusinessandadministrationArab States 51 73 61 59 33 53 69 58 42 55Central and Eastern Europe 47 70 54 53 29 61 62 69 61 58Central Asia 53 68 44 60 39 41 46 60 43 34East Asia and the Pacific 48 60 58 62 29 53 56 64 52 51Latin America and the Caribbean 41 67 51 53 31 57 70 61 56 52North America and Western Europe 40 60 43 48 21 57 64 63 53 59LawNotes: Regional averages for South and West Asia and sub-Saharan Africa are not available due to low response rates.Shaded areas in the table indicate that more women graduate in the field than men.Source: UNESCO Institute for Statistics database.76
G l o b a l e d u c a t i o n d i g e s t 2 0 1 0 C o m p a r i n g e d u c a t i o n s t a t i s t i c s a r o u n d t h e w o r l dcreation of new knowledge, products, processes,methods and systems. They are also involved in themanagement of these projects.Despite improved access to tertiary education,women face considerable barriers as they moveup the educational ladder to research careers.Figure 28 presents the gender compositionof graduates at different stages in tertiaryeducation and those employed as researchers.Globally, there is gender balance at the level ofthe Bachelor’s degree (ISCED 5A first degree)with men at 51% and women at 49% in most ofthe 101 countries with available data. Women arethen more likely than men to pursue their seconddegree, representing 56% of those graduatingfrom Master’s programmes (ISCED 5A seconddegree). However, beyond this level, the oppositeis true – men account for 56% of those graduatingfrom Ph.D. programmes (ISCED 6), and 71% of allresearchers.A more nuanced perspective can be gained byexamining regional data presented in Figure 29. Intwo regions – North America and Western Europeas well as Central and Eastern Europe – womenoutnumber men significantly among both theBachelor’s and Master’s degree graduates but thepattern does not persist at the Ph.D. level.A different pattern is found in the two regionswhich show gender balance at the Bachelor degreelevel: Central Asia (49% of female graduates), andEast Asia and the Pacific (48%). In both cases,however, there is a decline in the proportions offemale graduates at the Master’s degree and Ph.D.levels.A unique situation is found in Latin America and theCaribbean. About 60% of all university graduates(Bachelor’s degree) are women. This percentagefalls to 47% for a Master’s degree. Then, thereis a small rise in their participation, with womenaccounting for 49% of all Ph.D. graduates.F i g u r e 28To what extent do women pursue the highest levels of education and a research career?Proportion of women and men graduates in tertiary education by programme level and those employed as researchers, 2008WomenMenShare of graduates (%)Bachelor's degree Master's degree Ph.D. degree ResearchersSource: Graduates: UNESCO Institute for Statistics database; Researchers: for OECD, EU and Latin American and Caribbean countries OECD, Eurostat and RICYT questionnaires, respectively. All othercountries: UIS biennial science and technology (S&T) data collection.77
s e c t i o n 5 / G e n d e r , p a r t i c i p a t i o n a n d f i e l d o f s t u d y i n t e r t i a r y e d u c a t i o nF i g u r e 29To what extent do women pursue the highest levels of tertiary education?Proportion of women graduates in tertiary education by programme level and by region, 2008Share of graduates (%)Central and Eastern EuropeNorth America and Western EuropeLatin America and the CaribbeanCentral AsiaEast Asia and the PacificBachelor's degree Master's degree Ph.D. degreeNote: Regional averages for Arab States, South and West Asia, and sub-Saharan Africa are not available due to low response rates.Source: UNESCO Institute for Statistics database.The gender gap in research and development(R&D)Women account for 29% of the world’s researchers.Figure 30 presents a map of the world thathighlights gender gaps in 121 countries with data.In 37% of these countries, women represent lessthan one-third of the total number of researchers.Only about 15% of countries have achieved genderparity. Women outnumber male researchers injust ten countries (8% of all countries with data):Argentina, Azerbaijan, Cape Verde, Georgia,Kazakhstan, Latvia, Lesotho, Myanmar, Philippinesand Venezuela (UIS, 2010).According to data presented in Figure 30, LatinAmerica and the Caribbean has the highest share(46%) of female researchers, which exceeds theworld average of 29%. The Commonwealth ofIndependent States also has a relatively highshare of women researchers at 43%, followed byEurope and Africa (33%) (UIS, 2010). Asia has thelowest level of female participation, with womenaccounting for just 18% of researchers.Factors that may explain the lower number offemale researchers, especially in senior positions,include the work-life balance, sex stereotyping,performance measurement and promotion criteria,governance, and the role of researchers in society(UNESCO, 2007; UIS, 2006b).Apart from being under-represented, women inresearch are also often paid less than equallyqualifiedmen, are less likely to be promoted, and areconsistently clustered at the lower ranking levelsof the science system (UNESCO, 2007). This meansthat countries are not tapping into this potentialhuman capital, which probably has a negativeimpact on innovation and therefore on economicgrowth and poverty reduction. Increasing women’sinvolvement, input and access to science andtechnology is essential to reducing poverty, creatingjob opportunities and increasing agricultural andindustrial productivity (UNESCO, 2007).78
G l o b a l e d u c a t i o n d i g e s t 2 0 1 0 C o m p a r i n g e d u c a t i o n s t a t i s t i c s a r o u n d t h e w o r l dF i g u r e 30What is the share of women among researchers?Women as a share of total researchers, 2007 or latest year availablePercentage of female researchers% % .% % .% % .% % .% % Data not availableNote: Data are based on headcounts, except for India and the Congo, where the number of researchers is based on full-time equivalents.Source: UNESCO Institute for Statistics database.79
S E C T I O N 6National education policies and genderThe right to education is increasingly acceptedas a core human right. Looking at the trendsin gender parity in school participation acrossregions provides some confirmation that globalmobilization in support of girls’ basic educationhas had an impact in terms of relative change.The 1990 World Conference on Education heldin Jomtien, Thailand, marked the beginningof intensified international support for girls’education. These actions as well as the globalspread of human rights norms support progresstowards gender parity in primary schoolparticipation.While there are visible and widely endorsedglobal policies, such as Education for All (EFA) andMillennium Development Goals (MDGs), aimedat improving the condition of women and girls’education, national or local educational policiesseldom tackle structural barriers to gender equityin education access and outcomes (Teese et al.,2007). Failure to consider the political contextand macro-economic realities that constraineducational policy choices reduces policies tomere statements of intentions instead of solidpossibilities.For example, Dollar and Gatti (1999) have found– based on a study of 127 countries and coveringfour five-year periods – that policies promotinggrowth in per capita income significantly leadto more gender equality than gender-sensitivepolicies alone. Consequently, multisectoralpolicies are needed, particularly those affectingeconomic aspects. Dollar and Gatti’s findingssuggest that if parents perceive that thecompletion of schooling leads to employmentopportunities, they will view education more asan investment than an expense for both their sonsand daughters.A major educational policy challenge is addressinggender ideologies in both schooling and society.Issues of knowledge content and the schoolingexperience receive less attention, and thus, thegendered nature of schooling is not addressed.Schools are far from providing a gender-sensitiveeducation, either through formal curricula or inthe day-to-day experiences in classrooms. Thepower of the hidden curriculum has been widelyrecognized as an influence on student behavioursand values, and hence, over shaping genderidentities. Peers convey persistent messages –often in terms of maintaining gender boundaries –making schools powerful sites of socialization. Theenduring influences of the schooling experiencewill not be modified by simply expanding schoolaccess.Gender and education policyAlthough gender is increasingly visible in officialdiscourse and public policy, “many initiatives forwomen and girls’ education and gender equalityremain inadequately resourced, both financiallyand in terms of capacity, ideas and time”(Unterhalter et al., 2010). Further, the tendencyto view gender issues in education as merely aquestion of access, may lead some to concludethat achieving gender parity in enrolments means80
G l o b a l e d u c a t i o n d i g e s t 2 0 1 0 C o m p a r i n g e d u c a t i o n s t a t i s t i c s a r o u n d t h e w o r l dthat gender inequalities have been eliminated. Thegrowing presence of girls and women in educationis sometimes perceived as a sign that the boys arenow “at risk,” but this view doesn’t always reflectthe broader inequalities in the distribution ofbenefits and status in society.Some progress, nonetheless, is taking place.A large number of countries have removedgender stereotypes from their textbooks, eventhough the presence of masculine examplescontinues to prevail (Muñoz, 2006). Genderissues are now in place in curriculum guidelines– for example, in Brazil, a nuanced treatment ofgender includes references to welcoming diversityin the behaviours of men and women (Viannaand Unbehaum, 2006). Several countries aredeveloping gender-sensitive national educationplans. Yet, a study of 44 EFA national plans – whichare understood as statements of policy intentrather than representing actual accomplishments– found that girls were targeted in about a third ofsuch plans (IIEP, 2009).Some countries are using conditional cashtransfers and stipends to promote schoolparticipation among girls. Cash transfersprovide modest financial support to familiesthat send their children to school. Most of theseprogrammes are aimed at all children but a fewgive priority to girls. In Mexico, the Oportunidadesprogramme offers a greater stipend for girls thanboys and a greater stipend for primary than forsecondary education. Oportunidades currentlyreaches one-third of all rural families in Mexicoand also provides health and nutritional services.In the case of education, the largest impacts werereported for children who enter secondary school– the percentage increase in enrolments was over20% for girls and 10% for boys (Skoufias, 2005).Continued efforts in Bangladesh, through theSecondary School Stipend for Girls Programme, arealso enabling rural families to invest more in theirdaughters’ schooling. This nationwide programme,operating since 1994 and covering grades 6 to 12,has been successful in increasing girls’ enrolment,reducing early-age marriage and increasing thenumber of women employed in higher incomepositions (Khandker et al., 2003).In Rwanda, women parliamentarians are revisingthe financing for gender in education while in theUnited Republic of Tanzania, for over ten years,a gender network has been actively monitoringgovernment spending and mobilizing civilsociety to engage in gender monitoring activities(Unterhalter et al., 2010).Some conceptual advances in the treatment ofgender are taking place also with governmentalsupport. In Pakistan, an advocacy toolkit – GenderMainstreaming in Literacy Programs – has beendeveloped and disseminated to provide specificrecommendations for gender-responsive planning,implementation, management and budgeting ofsuch programs (Unterhalter et al, 2010). Severalgovernments in West Africa are participatingin training efforts to encourage their ministryofficials to gain a greater understanding ofapproaches to gender education and to apply themto literacy programmes.Following the Sixth International Conference onAdult Education (CONFINTEA VI) in December2009, many countries have adopted therecommendations on women’s adult educationexpressed in the Belem Framework for Action(UNESCO, 2010a). While governments seek to putin place a number of literacy programs for adultwomen, substantial obstacles to their participationremain. Most programmes do not take into account81
S E C T I O N / N a T I O N a l E d U C a T I O N P O l I C I E S a N d g E N d E rb Ox 1 0Forum for African Women educationalists (FAWe)Established in 1992 by five African women ministers of education, FAWE operatestoday in 35 countries. It seeks to expand girls’ access to formal schooling andchange the nature of their educational experience by fostering the creation ofschool-friendly environments free from discrimination and sexual harassment bypeers and teachers.FAWE provides a comprehensive set of services, including gender-sensitiveteacher training, workshops with community leaders and parents, and textbookspromoting knowledge among girls in mathematics, science and technology.These measures have proven successful in increasing girls’ primary schoolcompletion and academic performance, and decreasing teenage pregnancy rates(Jonker, 2010).FAWE also addresses the socialization of girls described as submissive – a traitthat in the African context has been linked to girls’ poor performance in nationalexams (a result of low self-esteem) and acceptance of sexual harassment. Througha program called Tuseme (Kiswahili for “speak out”), girls engage in theatricaland role-playing exercises to make their experience visible. Subsequently, thegirls discuss common problems and devise solutions. Tuseme programs are beingpiloted in both schools and NGO settings. So far, 14 African governments haveadopted them. More than 12 million girls and women who might not otherwisehave been able to attend school have been reached through FAWE.the lack of childcare provision, concurrent familyresponsibilities, poor health and unsuitable classschedules.In all, there is consensus that most nations stilllack a coherent strategy for empowering women(Lopez-Claros and Zahidi, 2005) and that there areweak regional initiatives focusing on educationand gender. The initiative that comes closestto a regional coordinated effort to promotegirls’ education is the Forum for African WomenEducationalists (see Box 10).The general public, academics, national andinternational NGOs participated in a recentonline discussion organized by UNESCO on theeducational accomplishments after 15 years ofthe Beijing Platform for Action, producing somenoteworthy observations (for more on UNESCO’sactivities in the area of gender and education,see Box 11). Although not directly linked to nationalpolicies, the views expressed highlight some“hidden challenges” and “silences” in educationalresponses. Among the former, the issues ofphysical violence, bullying and sexual harassmentwere identified as critical schooling experiencesaffecting girls primarily but boys as well. Amongthe latter challenge, the issues of teen pregnancyand early marriage were brought up. The persistentexpression of these problems highlights areas thatpublic policy has yet to address in appropriatelevels and forms (UNESCO, 2010d).Policies on gender have not been aided by limitedresearch findings <strong>document</strong>ing the nature of theeducational content and experience of girls andboys. So far, research on these critical aspects hasoccurred mostly through independent, microlevelinvestigations, rather than cross-nationalcomparisons that could detect more systematicallyhow contextual factors, such as structuraland social forces, combine to produce genderimbalances.2
g l O b a l E d U C a T I O N d I g E S T 2 0 1 0 C O m P a r I N g E d U C a T I O N S T a T I S T I C S a r O U N d T h E w O r l db Ox 11uNeSCO, gender inequalities and educationUNESCO stands out in the UN system – along with the newly established United Nations Entity onGender Equality and the Empowerment of Women (UN WOMEN) – as having made gender a globalpriority. UNESCO aims to address gender inequalities in education as well as in other areas of itsmandate, such as the sciences, culture, communication and information. In education, UNESCO assistscountries in developing gender-sensitive teaching and learning materials that promote the equalparticipation of women and men in society and at work. Where appropriate, UNESCO also undertakesactivities that explicitly target women and girls or men and boys. Gender is mainstreamed across all itsinitiatives in education from policy advice to capacity development in order to ensure that:• National capacities are strengthened in designing and managing literacy policies and programmestargeting women and girls;• Gender-sensitive teacher policies are developed in Member States;• Teachers are better trained in gender-sensitive teaching and learning approaches;• Quality of secondary education is enhanced to expand equal access and ensure retention of girls andboys;• National technical and vocational education and training (TVET) policies are reviewed to ensureadequate skills acquisition for employment for girls and boys alike;• National capacities are strengthened to prepare and manage inclusive, rights-based educationsector plans and policies that are gender-sensitive and assure equitable access to education; and• Education systems’ responses to HIV and AIDS are gender-sensitive.Challenges to monitoring progress of girls’and women’s educationComparative indicators produced by the UIS thataim to describe current disparities in educationalaccess, participation, progression and completionfocus on the level of the national education system.However, they are not meant to reflect genderdisparities at the school or classroom levels, suchas how schools deal with violence against girls andwomen or measure policy progress, such as genderempowerment in the curriculum or gender equalityinitiatives.Cross-nationally comparable sex-disaggregateddata provide an important starting point that leadsto more detailed policy analysis and the crafting ofpolicy responses. In particular, the gender parityindex (GPI) is a useful indicator of the relationshipbetween males and females in educational accessand participation at a given moment in time. Theanalysis of trends in gender parity over time canserve as an important signal that wider changes aretaking place.However, gender parity indicators are only thefirst step towards better understanding theprocesses of change underlying education equality.More focused data are necessary to investigatethe reasons for inequalities in order to identifyappropriate policy measures to reduce disparities.Data are needed to identify the reasons behinddrop-out rates, for example, or low schoolattendance and low participation by sex in certainsubjects or fields of study.Assessing steps towards gender equality requiresmeasuring meaningful progress towards thefulfilment of the right to education and in turnassessing both quantitative and qualitativeinformation on a wide range of phenomena thatunderpin the rights of men and women, to, within,and through education (UNESCO, 2006).
s e c t i o n 6 / N a t i o n a l e d u c a t i o n p o l i c i e s a n d g e n d e rIn addition, statistics are needed to illustrate howmen and women differ in terms of other socialgroupings or individual characteristics. Nationaleducation indicators reveal prevailing patterns inschooling participation but don’t reflect a widerange of social forces, such as the condition of girlsin poor households, the situation of minoritiesin rural areas, and norms and practices relatedto marriage, access to land, and inheritance thatconstruct gender relations in particular nationalcontexts. Other forms of discrimination thatinfluence social opportunity – such as poverty,ethnicity, language or place of residence – canalso be considered in conjunction with gender toilluminate the ways multiple forms of disadvantageintersect to affect the education of girls and women(UNESCO, 2010c). As Arnot (2007) observes,“National statistics mask social structural effectswhich divide social classes and ethnic/racialgroups.”More in-depth information is needed tocontextualize and interpret educational statistics.Policy-makers and researchers alike must creativelycombine the descriptive information providedat the global level (by the UIS and others) withmore detailed information on a specific countryor region’s history and culture. This is essentialin producing a comprehensive understanding ofgender equality in education.84
G l o b a l e d u c a t i o n d i g e s t 2 0 1 0 C o m p a r i n g e d u c a t i o n s t a t i s t i c s a r o u n d t h e w o r l d<strong>Reference</strong>sAbrahams, N., S. Mathews and P. Ramela (2006). “Intersections of sanitation, sexual coercion and girls’safety in schools”. Tropical Medicine and International Health. Vol. 11, No. 5, pp. 751–756.Agesa, R. (2004). “One family, two households: Rural to urban migration in Kenya”. Review of Economics ofthe Household. Vol. 2, No. 2, pp. 161-178.Alfonso, M. (2008). “Private resources in educational finance and equality implications: Evidence fromPeru”. J. Zajda, K. Biraimah, and W. Gaudelli (eds.), Education and Social Inequality in the GlobalCulture. Dordrecht: Springer, pp. 103-122.Amin, S. (2003). “Menstrual regulation in Bangladesh”. A.M. Basu (ed.), The Sociocultural and PoliticalAspects of Abortion: Global Perspectives. London: Praeger, pp. 153-166.Arnot, M. (2007). “Education, feminism, gender equality and school reform in late twentieth centuryEngland.”, R. Teese, S. Lamb and M. Duru-Bellat, M. (eds.). International Studies in EducationalInequality, Theory and Policy. Volume 2: Inequality in Education Systems. Springer.Bell, S. and F. Huebler (2010). The quantitative impact of conflict on education. Background paper for EFAGlobal Monitoring Report 2011. Montreal: UNESCO Institute for Statistics.Bledsoe, C. and G. Pison (eds.). (1994). Nuptiality in sub-Saharan Africa: Contemporary Anthropological andDemographic Perspectives. Oxford: Clarendon Press.Buchmann, C., T. DiPrete and A. McDaniel (2008). “Gender inequalities in education”. Annual Review ofSociology, Vol. 34, pp. 319-337.Chiappari, C. L. (2001). “Conceptual dichotomies and cultural realities: Gender, work, and religion inhighland Guatemala”. Anthropology of Work Review. Vol. 22, No. 3, pp.14-21.De Castro, M. L. and J. Menezes (2008). “The process of inclusion/exclusion in Brazilian schools: Data fromreality”. J. Zajda, K. Biraimah and W. Gaudelli (eds.), Education and Social Inequality in the GlobalCulture. Dordrecht: Springer, pp. 85-102.Dollar, D. and R. Gatti (1999). Gender Inequality, Income and Growth: Are Good Times Good for Women?Washington, D.C.: The World Bank. May.Finn, J. (1980). “Sex differences in educational outcomes: A cross-national study”. Sex Roles, Vol. 6, No. 1,pp. 9-26.Fratkin, E. (1994). “Pastoral land tenure in Kenya: Maasai, Samburu and Rendille experiences, 1950-1990”.Nomadic Peoples. Nos. 34-35, pp. 55-68.Geiser, A. (2005). Social Exclusion and Conflict Transformation in Nepal: Women, Dalit and Ethnic Groups.Bern: Swiss Peace Foundation.Gilligan, C., N. Lyons and T. Hanmer (1990). Making Connections: The Relational Worlds of Adolescent Girls atEmma Willard School. Cambridge: Harvard University Press.Glick, P. (2008). “What policies will reduce gender schooling gaps in developing countries?: Evidence andinterpretation”. World Development. Vol. 36, No. 9, pp. 1623-1646.Hakansson, N. T. (1994). “The detachability of women: Gender and kinship in processes of socioeconomicchange among the Gusii of Kenya”. American Ethnologist. Vol. 21, No. 3, pp. 516-538.Hall, G. and H. A. Patrinos (eds). (2006). Indigenous Peoples, Poverty and Human Development in LatinAmerica: 1994-2004. New York: Palgrave Macmillan.Hallman, K., S. Peracca, with J. Catino and M. J. Ruiz (2007). “Indigenous girls in Guatemala: Poverty andlocation”. M. Lewis and M. Lockheed (eds.), Exclusion, Gender and Education: Case Studies fromthe Developing World. Washington: Center for Global Development, pp. 145-75.85
e f e r e n c e sHamilton, S., L. Asturias de Barrios and B. Tevalan (2001). “Gender and commercial agriculture in Ecuadorand Guatemala”. Culture and Agriculture. Vol. 23, No. 3, pp. 1-12.Holtzman, J. (2001). “The food of elders, the ‘ration’ of women: Brewing, gender, and domesticprocesses among the Samburu of Northern Kenya”. American Anthropologist. Vol. 103, No. 4,pp. 1041‐1058.Huisman, J. and J. Smits (2009). “Effects of household- and district-level factors on primary schoolenrollment in 30 developing countries”. World Development. Vol. 37, No. 1, pp. 179-93.ILO (2004). Child Labour and Responses: Overview note on Bangladesh. International Programme on theElimination of Child Labour. Geneva: International Labour Organization, November.Jacobs, J. (1996). “Gender inequality and higher education”. Annual Review of Sociology, Vol. 22,pp. 153‐185.Jha, J. and F. Kelleher (2006). Boys’ Underachievement in Education: An exploration in Selected Commonwealthcountries. Vancouver: Commonwealth of Learning.Jonker, K. (2010). Strength Through Flexibility. Stanford Social Innovation Review. Winter.Kenway, J. and P. Kelly (2000). “Local/global labor markets and the restructuring of gender, schooling,and work. N. Stromquist and K. Monkman (ed.), Integration and Contestation Across Cultures.Boulder: Rowman & Littlefield, pp. 333-352.Khan, S. H. (1999). United They survive: Redistribution, Leadership and Human Services Delivery in RuralBangladesh. Lanham: Lexington Books.Khandker, S., M. Pitt and N. Fuwa. (2003). Subsidy to Promote Girls’ Secondary Education: The FemaleStipend Program in Bangladesh. MPRA Paper No. 23688. http://mpra.ub.uni-muenchen.de/23688 (Accessed 3 June 2010).Kutnick, P. (2000). “Girls, boys and school achievement: Critical comments on who achieves in schoolsand under what economic and social conditions achievement takes place—a Caribbeanperspective”. International Journal of Educational Development, Vol.20: 65–84.Lewin, K. M. (2009). “Access to education in sub-Saharan Africa: Patterns, problems and possibilities”.Comparative Education. Vol. 45, No. 2, pp. 151-74.Lewis, M. and M. Lockheed (2007). Inexcusable Absence: Why 60 Million Girls Still Aren’t in School and Whatto Do About it. Washington: Center for Global Development.Lloyd, C. B., S. El-Kogali, J. Perlman Robinson, J. Rankin, and A. Rashed (2010). Schooling and Conflict inDarfur: A snapshot of basic education services for displaced children. New York: PopulationCouncil and Women’s Refugee Commission.Lockheed, M. and C. Mete (2007). “Tunisia: Strong central policies for gender equity”. M. Lewis and M.Lockheed (eds.), Exclusion, Gender and Education. Case studies from the developing world (pp.205-225). Washington, D.C.: Center for Global Development.López-Claros, A. and S. Zahidi (2005). Women’s Empowerment: Measuring the Global Gender Gap. Geneva:World Economic Forum. www.weforum.org. (Accessed 11 June 2008).Luke, N. and K. Munshi (2006). “New roles for marriage in urban Africa: Kinship networks and the labormarket in Kenya”. The Review of Economics and Statistics. Vol. 88, No. 2, pp. 264-82.Lyon, S. (2008). “We want to be equal to them: Fair-trade coffee certification and gender equity withinorganizations”. Human Organization. Vol. 67, No. 3, pp. 258-69.Ma, X. (2007). Gender differences in learning outcomes. Background paper for the EFA Global MonitoringReport 2008: Education for All: Will we make it. efareport@unesco.org.Martino, W. and Berrill, D. (2003). “Boys, schooling and masculinities: Interrogating the ‘right’ way toeducate boys”. Educational Review. Vol. 55 No. 2, pp. 99-117.86
G l o b a l e d u c a t i o n d i g e s t 2 0 1 0 C o m p a r i n g e d u c a t i o n s t a t i s t i c s a r o u n d t h e w o r l dMcAdoo, H. and M. Were (1987). “Extended family involvement of urban Kenyan professional women”.R. Terborg-Penn, S. Harley, and A. Benton Rushing (eds.), Women in Africa and the AfricanDiaspora. Washington: Howard University Press.McDaniel, A. (2010). “Cross-National gender gaps in educational expectations: The influence of nationallevelgender ideology and educational systems”. Comparative Education Review. Vol. 54, No. 1,pp. 27-50.Ministry of Planning and Investment [Lao PDR], Ministry of Health [Lao PDR] and UNICEF. (2008). MultipleIndicator Cluster Survey 2006: Final report. Vientiane: Ministry of Planning and Investment,Ministry of Health, and UNICEF, September.Mugisha, F. (2006). “School enrollment among urban non-slum, slum and rural children in Kenya: Is theurban advantage eroding?”. International Journal of Educational Development. Vol. 26, No. 5, pp.471-82.Mulkeen A. (2010). Teachers in Anglophone Africa. Issues in Teacher Supply, Training, and Management.Washington, D.C.: The World Bank.Mullis, I., M. Martin, E. Fierros, A. Goldberg and S. Stemler (2000). Gender Differences in Achievement: IEA’sThird International Mathematics and Science Study (TIMSS). Chestnut Hill, MA: Boston College.Muñoz, F. (2006). “¿De qué politicas educativas hablamos en el Perú? La incorporación del género enla educación”. N. Stromquist (ed.), La construcción del género en las políticas públicas. Lima:Instituto de Estudios Peruanos, pp. 63-113.Nath, S. R. (2009). Educational Marginalization in Bangladesh. Background paper for the Education for AllGlobal Monitoring Report 2010: Reaching the Marginalized. UNESCO <strong>document</strong> 2010/ED/EFA/MRT/PI/15. Paris: UNESCO.National Statistical Office [Thailand] and UNICEF. (2006). Thailand Multiple Indicator Cluster Survey,December 2005 - February 2006: Final report. Bangkok: National Statistical Office and UNICEF.Nelson, L. (2009). Reckoning: The Ends of War in Guatemala. Durham and London: Duke University Press.Newcomb, R. (2006). “Gendering the city, gendering the nation: Contesting urban space in Fes, Morocco”.City and Society. Vol. 18, No. 2, pp. 288-311.Nishimura, M., T. Yamano and Y. Sasaoka (2008). “Impacts of the universal primary education policy oneducational attainment and private costs in rural Uganda”. International Journal of EducationalDevelopment, Vol. 28, No. 2, pp. 161-75.Nosaka, A. (2000). “Effects of child gender preference on contraceptive use in rural Bangladesh”. Journal ofComparative Family Studies. Vol. 31, No. 4, pp. 485-501.Obasi, E.. (1997). “Structural adjustment and gender access to education in Nigeria”. Gender & Education,Vol. 9, No. 2, pp. 161-78.Odaga, A. and W. Heneveld (1995). Girls and Schools in Sub-Saharan Africa: From analysis to action.Washington, DC: World Bank.OECD. (2001). Knowledge and Skills for Life: First results from PISA 2000. Paris: OECD.OECD. (2004). Learning for Tomorrow’s World: First results from PISA 2003. Paris: OECD.OECD. (2009). Equally Prepared for Life: How 15-Year-Old Boys and Girls Perform in School. Paris:Organisation for Economic Co-operation and Development.OECD. (2010). Atlas of Gender and Development: How Social Norms Affect Gender Equality in Non-OECDCcountries. Paris: Organisation for Economic Co-operation and Development.OECD/UNESCO-UIS. (2003). Literacy Skills for the World of Tomorrow: Further Results from PISA 2000.Montreal: UNESCO Institute for Statistics.87
e f e r e n c e sParker, C. (2008). “Measuring inequities in secondary school attendance: The probability of attendingsecondary school for primary school graduates in Nicaragua”. J. Zajda, K. Biraimah and W.Gaudelli (eds.), Education and Social Inequality in the Global Culture. Dordrecht: Springer,pp. 17-39.Parkin, D. and D. Nyamwaya (eds.). (1987). Transformations of African Marriage. Manchester: ManchesterUniversity Press.Pôle de Dakar. (2009). Universal Primary Education in Africa: The Teacher Challenge. Dakar: UNESCO/BREDA.Rhaman, A. (1999). Women and Microcredit in Rural Bangladesh: An anthropological study of Grameen Bank.Boulder: Westview Press.Richardson, C. R. (2001). The lives of Kenyan women teachers, 1963-1992: Perspectives on the role andmeaning of education and teaching. Doctoral dissertation, Stanford University.Rueda, B. de and A. Pascal (2007). Educating Street Girls: A contribution to the debate on aims and methods:The experience of the Solo Para Mujeres education centre, Guatemala. Paris: UNESCO.Saito, M. (1998). “Gender versus socioeconomic status and school location differences in grade 6 readingliteracy in five African countries”. Studies in Educational Evaluation, Vol. 24, No. 3, pp. 249-261.Saito, M. (In preparation.). “Trends in the magnitude and direction of gender differences in pupil readingand mathematics achievement”. In K. N. Ross, D. Makuwa, and N. Hungi (Eds.), SACMEQ IIIProject International Report: The Conditions of Schooling and the Quality of Education in Southernand Eastern Africa (2000-2007). Paris: IIEP (UNESCO) / SACMEQ.Shafiq, M. N. (2007). Household rates of return to education in rural Bangladesh: Accounting for directcosts, child labour, and option value. Education Economics. Vol. 15, No. 3, pp. 343–58.Shemyakina, O. (2006). The Effect of Armed Conflict on Accumulation of Schooling: Results from Tajikistan.HiCN Working Paper 12. Falmer: University of Sussex, November.Shipton, P. (2010). Credit Between Cultures: Farmers, Financiers, and Misunderstanding in Africa. New Haven:Yale University Press.Skoufias, E. (2005). PROGRESA and Its Impacts on the Welfare of Rural Households in Mexico. Washington,DC.: IFPRI. (Research report 139.)Smith, J. H. (2004). “Of spirit possession and structural adjustment programs: Government downsizing,education, and their enchantments in neoliberal Kenya”. B. Weiss (ed.), Producing Africanfutures: Ritual and reproduction in a neoliberal age. London and Boston: Brill, pp. 57-98.State Statistical Office [Macedonia]. (2007). Multiple Indicator Cluster Survey 2005-2006. Skopje: StateStatistical Office, September.Sudan, F. K. (2010). Social and Economic Costs of Armed Conflicts on Children: Evidence from DisplacedCamps in Jammu and Kashmir, India. Paper presented at Fifth Households in Conflict NetworkWorkshop, German Institute for Economic Research, 1-2 February.Takyi-Amoako, E. (2008). “Poverty reduction and gender parity in education. An alternative approach”.S. Fennell and M. Arnot (eds.), Gender Education and Equality in a Global Context conceptualframeworks and policy perspectives. London: Routledge, pp. 196-210.Teese, R. (2007). “Time and space in the reproduction of educational inequality”. R. Teese, S. Lamb andM. Duru-Bellat (eds.), International Studies in Educational Inequality, Theory and Policy. Vol. I.Dordrecht: Springer, pp. 1-21.Telles, E. E. (2007). “Race and ethnicity and Latin America’s United Nations Millennium DevelopmentGoals”. Latin American and Caribbean Ethnic Studies. Vol. 2, No. 2, pp. 185-200.Tsujita, Y. (2009). Deprivation of education: A study of slum children in Delhi, India. Background paperprepared for the Education for All Global Monitoring Report 2010: Reaching the marginalized.UNESCO <strong>document</strong> 2010/ED/EFA/MRT/PI/12.88
G l o b a l e d u c a t i o n d i g e s t 2 0 1 0 C o m p a r i n g e d u c a t i o n s t a t i s t i c s a r o u n d t h e w o r l dUNDP. (2009). Human Development Report. Overcoming barriers: Human mobility and development. NewYork: United Nations Development Programme.UNESCO. (2000). The Dakar Framework for Action: Education for All – Meeting our Collective Commitments:Dakar: World Education Forum.UNESCO. (2000b). Women as Educators, and Women’s Education in E-9 Countries, Paris: UNESCO.UNESCO. (2003). EFA Global Monitoring Report 2003/4. Gender and Education for All: The leap to equality.Paris: United Nations Educational, Scientific and Cultural Organization.UNESCO. (2006). EFA Global Monitoring Report 2007. Strong Foundations. Paris: United Nations Educational,Scientific and Cultural Organization.UNESCO (2007). Science, Technology and Gender. An International Report. Paris: United Nations Educational,Scientific and Cultural Organization.UNESCO. (2008). EFA Global Monitoring Report 2008. Education for All by 2015 Will we make it? Paris: UnitedNations Educational, Scientific and Cultural Organization.UNESCO. (2010a). Belém Framework for Action – Harnessing the Power and Potential of Adult Learningand Education for a Viable Future. Paris: UNESCO.UNESCO. (2010b). EFA Global Monitoring Report 2010. Reaching the Marginalized. Paris: United NationsEducational, Scientific and Cultural Organization.UNESCO. (2010c). Education Under Attack 2010. Paris: United Nations Educational, Scientific and CulturalOrganization.UNESCO. (2010d). Report on UNESCO’s Online Discussion on the Beijing Platform for Action’s StrategicObjective B. Education and Training of Women. Paris: United Nations Educational, Scientificand Cultural Organization. January 10-February 7.UNESCO-IIEP. (2009). Educational Marginalization in National Education Plans. Paris: International Institutefor Educational Planning.UNESCO-UIS. (2005). Children Out of School: Measuring exclusion from primary education. Montreal:UNESCO Institute for Statistics.UNESCO-UIS. (2006a). Teachers and Educational Quality: Monitoring global needs for 2015. Montreal:UNESCO Institute for Statistics.UNESCO-UIS. (2006b). Women in Science: Under-Represented and Under-Measured. Montreal: UNESCOInstitute for Statistics. (UIS S&T Bulletin No.3.)UNESCO-UIS. (2009). Projecting the Global Demand for Teachers: Meeting the Goal for Universal PrimaryEducation by 2015. Montreal: UNESCO Institute for Statistics.UNESCO-UIS. (2010). The Gender Gap in Education and Science. Montreal: UNESCO Institute for Statistics.(Information Sheet No. 4.)Unterhalter, E., A. North and J. Parkes (2010). Gender Equality and Women and Girls’ Education, 1995-2010: How much is there a space for hope?. Paper for UNESCO 15-Year Review of the BeijingPlatform for Action.Vianna, C. and S. Unbehaum. (2006). “La inclusión de la perspectiva de género en las políticas públicas dela educación en Brasil”. N. Stromquist (ed.), La construcción del género en las políticas públicas.Lima: Instituto de Estudios Peruanos, pp. 115-65.Weiss, E., G. Kemmlera, E. Deisenhammer, W. Fleischhacker and M. Delazer. (2003). “Sex differences incognitive functions”. Personality and Individual Differences. Vol. 35, No. 4, pp. 863-875.89
Reader’s guideThe following symbols are used in the Statistical Tables:Symbol…InterpretationNo data available* National estimation**#For country data: UIS estimationFor regional averages: Partial imputation due to incomplete country coverage(between 25% to 75% of population)For regional averages: substantial imputation due to incomplete countrycoverage (less than 25% of population)- Magnitude nil or negligible. Not applicablex(y)Data are included in another column (y) of the table+n Data refer to the school or financial year n years after the reference year-n Data refer to the school or financial year n years prior to the reference year<strong>Reference</strong> periodThe reference period for education and finance data presented in the statistical tables is the academicor financial year ending in 2008 or the most recent year available within the period 2006-2009.Literacy indicators refer to the most recent data available within the period 2005-2008. Whenobserved data are older than 2005, the UIS Global Age-Specific Literacy Projections Model (GALP)estimates for 2008 are used.Data on educational attainment are the latest available, except when earlier data provide moreinformation (e.g. a wider range of educational levels).Where a given reference period is spread across two calendar years, the later year is cited. For example,the school year 2007/08 is presented as 2008.Countries that completed the joint UNESCO/OECD/Eurostat (UOE) questionnaire were requested toprovide educational finance and expenditure data corresponding to the financial year 2007. Othercountries were requested to submit data corresponding to the financial year 2008 or for the mostrecent year available.Data presented in the analytical chapter are complemented by the data for other reference periodsor additional indicators not included in the statistical tables. Data for other reference periods areavailable online at the UIS Data Centre at http://stats.uis.unesco.org.90
G l o b a l e d u c a t i o n d i g e s t 2 0 1 0 C o m p a r i n g e d u c a t i o n s t a t i s t i c s a r o u n d t h e w o r l dData sourcesAEducationThe UIS collects education statistics in aggregate form from official administrativesources at the national level. Collected information encompasses data on educationalprogrammes, access, participation, progression, completion, internal efficiency andhuman and financial resources. These statistics cover:• regular education in pre-primary, primary, basic and secondary schools, and incolleges, universities and other tertiary education institutions;• education in public (or state) and private schools, colleges or universities; and• special needs education (both in regular and special schools).These data are collected annually by the UIS and its partner agencies through thefollowing three major surveys that can be downloaded from the UIS website atwww.uis.unesco.org/surveys/education:1 UIS surveyThe UIS education questionnaires are sent to UNESCO Member States annually. Thequestionnaires are based on international standards, classifications and measuresthat are regularly reviewed and modified by the UIS in order to address emergingstatistical issues and improve the quality of data.The countries that participate in the UIS survey are presented in Annex D.2 UOE surveyUNESCO-UIS, the OECD and Eurostat (UOE) have jointly administered this annualdata collection since 1993. The UOE questionnaire compiles data from high- andmiddle-income countries that are generally members or partner countries of theOECD or Eurostat. The UOE survey gathers more detailed education statistics andallows for production of a wider set of indicators, as presented in Statistical Tables7, 17-19 and 21-26.The countries that participate in the UOE data collection are presented in Annex D.3 WEI programmeThe World Education Indicators (WEI) programme provides a platform for middleincomecountries to develop a critical mass of policy-relevant education indicatorsbeyond the global core set of education statistics. This also allows for directcomparisons to countries participating in the UOE survey as the collection of datafrom WEI countries is based on a common set of definitions, instructions andmethods derived from the OECD Indicators of National Education Systems (INES)programme.Participating countries in the WEI data collection are Argentina, Brazil, China,Egypt, India, Indonesia, Jamaica, Jordan, Malaysia, Paraguay, Peru, the Philippines,Sri Lanka, Thailand, Tunisia and Uruguay. The UIS maintains the secretariat for theWEI programme.91
e a d e r ’ s g u i d eBCDELiteracyLiteracy statistics for adults aged 15 years and older and for youth aged 15 to 24 yearsare obtained from national population censuses, household surveys and estimatesusing the UIS Global Age-Specific Literacy Projections Model (GALP).The questionnaire can be downloaded at http://www.uis.unesco.org/surveys/literacyData sources, reference years and national definitions are available online at the UISData Centre, under the headings Predefined Tables d Literacy d General metadataon national literacy data. For more information regarding literacy estimates andprojections, please refer to the report Global Age-Specific Literacy Projections Model(GALP): Rationale, Methodology and Software, available at http://www.uis.unesco.org/ev.php?ID=6963_201&ID2=DO_TOPICEducational attainmentStatistics on educational attainment for the population aged 25 years and older arebased on national population censuses or surveys.Population estimatesPopulation data are based on the 2008 revision of the World Population Prospectsby the United Nations Population Division (UNPD). The UNPD does not providedata by single year of age for countries with a total population of less than 100,000inhabitants. Where UNPD estimates are not available, national data or UIS estimatesare used. National population data refers to population data obtained by the UISdirectly from national sources, such as the national statistical office in a country.Where only national population totals are available, UIS estimates are used toapproximate the age distribution whenever possible. These estimates are based onnational population age distributions from previous years. For more information onUNPD estimates, please visit http://www.un.org/esa/population/unpop.htmEconomic statisticsData on economic indicators such as gross domestic product (GDP) and purchasingpower parity (PPP) are World Bank estimates as of September 2009. For countries whereWorld Bank data are not available, data are obtained from the United Nations StatisticsDivision (UNSD). This group of countries consists of Andorra, Anguilla, Aruba, Bahrain,Barbados, Bermuda, British Virgin Islands, Cayman Islands, Cook Islands, Cuba, Kuwait,Montserrat, Myanmar, Nauru, Oman, Qatar, Saudi Arabia, Turks and Caicos Islands,Tuvalu and the United Arab Emirates.Technical notesAEducation data and indicatorsWhere the publishable data represent less than 75% of the relevant population, theregional average is regarded as a UIS estimate and is marked with the symbol **.92
G l o b a l e d u c a t i o n d i g e s t 2 0 1 0 C o m p a r i n g e d u c a t i o n s t a t i s t i c s a r o u n d t h e w o r l dWhere the publishable data represent less than 25% of the regional population, theaverage is marked as #.There are cases where an indicator theoretically should not exceed 100% (for examplethe net enrolment rate), but data inconsistencies may have resulted in the indicatorexceeding the theoretical limit. In these cases, “capping” has been applied, whilemaintaining the same gender ratio (see Annex A).Due to rounding, Gender Parity Indices (GPI) may differ from those based directly onreported values.The percentage of females (% F) is included to provide information on the proportionof girls enrolled with respect to the total enrolment. For gender parity, a more relevantmeasure is the GPI.Two Special Administrative Regions – Hong Kong and Macao – are reported separatelyfrom data for China.Education data and indicators presented exclude adult education programmes.However, data on these programmes are included in the raw data collected using theWEI/UOE surveys. Therefore, data obtained from these surveys are adjusted in coverageby excluding adult education programmes.BCDEducation financeExpenditure on pre-primary education or from international sources – both of which areoften comparatively small – have been treated as negligible in cases where data were infact missing. In these cases, the totals may be underestimated.Educational attainmentEducational attainment data are presented by ISCED level. In addition to the categoriesrelated to completed education levels, three other columns are presented:• “No schooling” refers to the proportion of the population without any formalschooling;• “Incomplete primary” denotes the percentage of the population that has attendedprimary education but has not completed the level; and• “Unknown” is the share of the population for which the educational level could notbe determined.Population issuesPopulation-based indicators are listed as missing (…) where population data are notavailable.Cyprus: Enrolment data for Cyprus do not include schools that are not undergovernment control. The population data used for the calculation of indicators wereprovided by the government of Cyprus and only cover the population living in thegovernment-controlled area.93
e a d e r ’ s g u i d eRepublic of Moldova: Enrolment data do not cover the region of Transnistria andpopulation data for this region were excluded when calculating population-basedindicators.Palestinian Autonomous Territories: Enrolment data do not include data for EastJerusalem, whereas the population data do. Indicators are not internationallycomparable and should be interpreted with caution.EStudent mobilityMobile students are students who have crossed a national border and moved to anothercountry with the objective to study. Three operational definitions are widely used toidentify mobile students – (1) by students’ country of permanent or usual residence, (2)country of prior education, or (3) country of citizenship. The UIS uses the former twoto define mobile students. Though those two are preferred, the UIS accepts country ofcitizenship as a proxy in countries/territories where residence or prior education couldnot yield the country of origin of mobile students. As the UIS is aware, the followingcountries use citizenship to define mobile students: Austria, Cameroon, Chile, CzechRepublic, Finland, France, Greece, Hungary, India, Indonesia, Italy, Japan, Jordan, Kuwait,Madagascar, Malaysia, Malta, Oman, Philippines, Poland, Qatar, Republic of Korea,Romania, Russian Federation, Saudi Arabia, the former Yugoslav Republic of Macedoniaand Turkey.In order to improve the coverage of mobile students, the UIS includes partial datafor some major host countries. For statistics on outbound mobility, it is especiallypreferable to represent a host country partially rather than completely excluding it. TheUIS includes partial data for the following host countries: Canada and India (universitiesonly); Costa Rica, Kuwait, and South Africa (public institutions only); Ireland (full-timestudents only); and Germany (ISCED 5 only).Data on students who are studying abroad are reported by host countries. However,many countries do not regularly report data on mobile students. In order to estimatethe number of students from a given country who are studying abroad, the outboundmobility ratio (Statistical Table 10) as well as regional totals (Statistical Table 9), data forthe most recent year since 1999 are used to impute for missing data.Within the same context, it is worth noting that in many small countries, a significantnumber of students enter tertiary programmes outside of their country of origin. Thegross outbound enrolment ratio (Statistical Table 10) shows the magnitude of thisphenomenon.Outbound mobile students are counted in the gross enrolment ratio of the respectivehost country, even if they are funded by the government in their country of origin, suchas in the cases of Caribbean and Oceania countries or territories.F UOE/WEI data (Statistical Tables 7 and 17-26)Statistical Tables 7 and 17-26 provide an additional set of indicators based on UOE andWEI surveys and are presented for participating countries only.94
G l o b a l e d u c a t i o n d i g e s t 2 0 1 0 C o m p a r i n g e d u c a t i o n s t a t i s t i c s a r o u n d t h e w o r l dFor all UOE/WEI participating countries, indicators are calculated by the UIS based onnational data submissions. For additional selected countries, data on upper secondarygraduates presented in Table 7 are based on a pilot questionnaire administered in LatinAmerica and the Caribbean, Central and Eastern Europe, Central Asia, and East Asia andthe Pacific in 2007.For OECD countries and OECD partner countries (Brazil, Estonia, Israel and theRussian Federation), indicators and data used in Tables 21 and 23 are a subset of thosepresented in the 2009 edition of Education at a Glance (EAG) published by the OECD.Chile’s status as an OECD partner country changed to that of a full member state in2010. For further details on this publication, please visit www.oecd.org/edu/eag200995
Statistical tables1. Pre-primary education / ISCED 0 / Enrolment and teaching staff 982. Primary education / ISCED 1/ New entrants 1083. Primary education / ISCED 1/ Enrolment and teaching staff 1184. Primary education / ISCED 1/ Measures of progression and completion 1285. Secondary education / ISCED 2 and 3 / Enrolment and repeaters / 2008 1386. Secondary and post-secondary non-tertiary education / ISCED 2, 3 and 4 / 148Teaching staff and post-secondary non-tertiary enrolment / 20087. Graduation and entry to upper secondary education (ISCED 3) and entry to tertiary 158education (ISCED 5) / 2008 (selected countries)8. Tertiary education / (ISCED 5 and 6) / Enrolment, graduation ratio and teaching staff 1629. Tertiary education / (ISCED 5 and 6) / Internationally mobile students by host country 172and region of origin / 2008 (countries with more than 1,000 mobile students)10. Tertiary education / (ISCED 5 and 6) / International flows of mobile students / 2008 17611. Tertiary education / (ISCED 5 and 6) / Graduates by broad fields of education / 2008 18212. School life expectancy 19213. Public expenditure on education and expenditure on education by nature of spending / 202Financial year ending in 200814. Expenditure on education as a percentage of GDP, by sources of funds / 212Financial year ending in 200815. Adult and youth literacy 22216. Educational attainment of the population aged 25 years and older 22896
G l o b a l e d u c a t i o n d i g e s t 2 0 1 0 C o m p a r i n g e d u c a t i o n s t a t i s t i c s a r o u n d t h e w o r l dWEI and UOE countries17. Primary and secondary education / ISCED 1, 2 and 3 / Distribution of students 238by type of institution / 200818. Tertiary education / ISCED 5 and 6 / Distribution of students by type of institution / 2008 24019. Primary and lower secondary education / ISCED 1 and 2 / Average class size 242by type of institution / 200820. Intended instruction time (hours per year) for students (9 to 14 years) in public 244institutions / 200821. Primary and secondary education / ISCED 1, 2 and 3 / Organization of teachers’ 245instructional time / 200822. Primary and secondary education / ISCED 1, 2 and 3 / Distribution of teachers by age / 2008 24623. Primary and secondary education / ISCED 1, 2 and 3 / Teachers’ annual salaries in public 250institutions (in U.S. dollars PPP) / 200824. Primary and secondary education / ISCED 1, 2 and 3 / Teachers’ annual salaries in public 252institutions as a percentage of GDP per capita / 200825. Relative proportions of public and private expenditure on educational institutions / 2008 25426. Distribution of total public expenditure on education by destination of funds / 2008 25897
T a b l e1Pre-primary education / isced 0 / Enrolment and teaching staffRegionEducationsystemEnrolmentGross enrolment ratioCountry or territoryArab States2008 1999 2008Entrance%age Duration MF (000) % F Private MF M F GPI MF M F GPI1 2 3 4 5 6 7 8 9 10 11 12 13Algeria 5 1 138 49 3 3 3 3 1.01 23 23 23 1.00Bahrain 3 3 22 49 100 37 37 36 0.96 54 54 53 0.98Djibouti 4 2 1.3 47 89 - - 1 1.50 3 3 3 0.91Egypt 4 2 580 -1 47 -1 30 -1 10 10 10 0.95 16 -1 17 -1 16 -1 0.94 -1Iraq 4 2 ... ... ... 5 5 5 1.00 ... ... ... ...Jordan 4 2 105 47 90 29 31 28 0.91 36 38 35 0.93Kuwait 4 2 71 49 42 78 78 79 1.02 76 77 76 0.98Lebanon 3 3 153 +1 49 +1 79 +1 61 ** 62 ** 60 ** 0.97 ** 77 +1 77 +1 76 +1 0.98 +1Libyan Arab Jamahiriya 4 2 22 -2 48 -2 17 -2 5 5 ** 5 ** 0.97 ** 9 -2 9 -2 9 -2 0.97 -2Mauritania 3 3 ... ... ... ... ... ... ... ... ... ... ...Morocco 4 2 669 42 95 62 82 43 0.52 57 65 48 0.74Oman 4 2 40 53 30 ... ... ... ... 34 31 36 1.17Palestinian Autonomous Territories 4 2 84 48 100 39 40 39 0.96 32 32 31 0.97Qatar 3 3 22 49 91 25 25 25 0.98 51 50 52 1.04Saudi Arabia 3 3 182 48 ** 51 ... ... ... ... 11 11 ** 10 ** 0.94 **Sudan 4 2 632 +1 50 +1 23 +1 18 ... ... ... 28 +1 28 +1 29 +1 1.03 +1Syrian Arab Republic 3 3 150 47 72 8 9 8 0.90 10 10 9 0.93Tunisia 3 3 ... ... ... 14 14 13 0.95 ... ... ... ...United Arab Emirates 4 2 100 -1 48 -1 78 -1 64 65 63 0.97 87 -1 88 -1 87 -1 0.98 -1Yemen 3 3 ... ... ... 1 1 1 0.86 ... ... ... ...Central and Eastern EuropeAlbania 3 3 ... ... ... 42 41 44 1.08 ... ... ... ...Belarus 3 3 271 -1 48 -1 4 -1 75 77 * 73 * 0.95 * 102 -1 103 -1 101 -1 0.98 -1Bosnia and Herzegovina 3 3 15 48 ... ... ... ... ... 12 13 12 0.96Bulgaria 3 4 208 48 1 67 67 66 0.99 81 81 80 0.99Croatia 3 4 91 -1 48 -1 11 -1 40 40 40 0.98 51 -1 52 -1 50 -1 0.97 -1Czech Republic 3 3 293 48 1 90 87 93 1.07 111 113 110 0.97Estonia 3 4 49 49 3 87 88 87 0.99 95 95 95 1.00Hungary 3 4 324 48 6 79 80 79 0.98 87 88 87 0.99Latvia 3 4 69 48 3 53 54 51 0.95 89 90 88 0.98Lithuania 3 4 87 49 - 50 50 49 0.98 72 72 72 0.99Montenegro 3 4 ... ... ... ... ... ... ... ... ... ... ...Poland 3 4 863 -1 49 -1 9 -1 50 50 50 1.01 60 -1 60 -1 61 -1 1.01 -1Republic of Moldova 3 4 107 48 - 48 * 49 * 48 * 0.96 * 73 * 73 * 72 * 0.98 *Romania 3 4 650 49 2 62 61 63 1.02 73 73 74 1.01Russian Federation 3 4 4,906 48 2 68 ... ... ... 90 91 89 0.99Serbia 3 4 178 49 - 54 ** 57 ** 51 ** 0.90 ** 59 * 59 * 58 * 0.99 *Slovakia 3 3 143 48 3 81 ... ... ... 94 95 93 0.97Slovenia 3 3 45 48 2 74 78 71 0.91 83 84 81 0.97The former Yugoslav Rep. of Macedonia 3 4 37 -1 49 -1 . -1 27 27 28 1.01 38 -1 38 -1 39 -1 1.02 -1Turkey 3 3 702 48 10 6 7 6 0.93 18 18 17 0.95Ukraine 3 3 1,137 48 2 50 50 49 0.98 98 100 96 0.97Central AsiaArmenia 3 4 48 -1 51 -1 1 -1 26 ... ... ... 33 -1 30 -1 36 -1 1.23 -1Azerbaijan 3 3 89 47 - 18 * 19 * 17 * 0.89 * 26 * 26 * 27 * 1.04 *98
G l o b a l e d u c a t i o n d i g e s t 2 0 1 0 C o m p a r i n g e d u c a t i o n s t a t i s t i c s a r o u n d t h e w o r l dNet enrolment rateTeachingstaffTrained teachers(%)Pupil/teacherratio1999 2008 2008 20082008MF M F GPI MF M F GPI MF (000) % F MF M F14 15 16 17 18 19 20 21 22 23 24 25 26 27RegionCountry or territoryArab States3 3 3 1.01 23 23 23 1.00 5.5 81 ... ... ... 25 Algeria36 37 36 0.96 53 53 53 0.98 1.4 100 47 - 47 16 Bahrain- - - 1.59 2 2 2 0.87 0.08 87 87 60 91 17 Djibouti9 9 9 0.95 15 -1 16 -1 15 -1 0.94 -1 23 -1 99 -1 ... ... ... 25 -1 Egypt5 5 5 1.00 ... ... ... ... ... ... ... ... ... ... Iraq26 28 25 0.90 33 35 32 0.94 5.1 100 ... ... ... 21 Jordan63 63 64 1.02 63 64 62 0.97 6.2 100 100 100 100 11 Kuwait58 ** 58 ** 57 ** 0.97 ** 74 +1 74 +1 74 +1 0.99 +1 9.5 +1 99 +1 10 +1 8 +1 10 +1 16 +1 Lebanon... ... ... ... 8 -2 8 -2 7 -2 0.96 -2 2.5 -2 96 -2 ... ... ... 9 -2 Libyan Arab Jamahiriya... ... ... ... ... ... ... ... ... ... ... ... ... ... Mauritania45 58 32 0.56 52 60 44 0.74 37 65 100 100 100 18 Morocco... ... ... ... 25 23 26 1.15 2.0 100 100 100 100 20 Oman34 35 34 0.96 26 26 26 0.98 4.3 100 100 - 100 20 Palestinian Autonomous Territories24 25 24 0.98 46 45 47 1.06 1.3 100 36 -2 67 -2 35 -2 17 Qatar... ... ... ... 10 *, -1 10 *, -1 10 *, -1 0.93 *, -1 18 * 100 * ... ... ... 10 * Saudi Arabia... ... ... ... ... ... ... ... 21 +1 100 +1 71 +1 - 71 +1 30 +1 Sudan8 9 8 0.90 9 10 9 0.93 8.0 96 25 17 25 19 Syrian Arab Republic14 14 13 0.95 ... ... ... ... ... ... ... ... ... ... Tunisia49 50 48 0.98 62 -1 63 -1 61 -1 0.98 -1 4.8 -1 100 -1 100 -1 100 -1 100 -1 21 -1 United Arab Emirates1 ** 1 ** 1 ** 0.86 ** ... ... ... ... ... ... ... ... ... ... YemenCentral and Eastern Europe43 +1 41 +1 45 +1 1.11 +1 ... ... ... ... ... ... ... ... ... ... Albania70 72 * 68 * 0.95 * 90 -1 90 -1 89 -1 0.99 -1 44 -1 99 -1 63 -1 63 -1 63 -1 6 -1 Belarus... ... ... ... ... ... ... ... 1.1 98 ... ... ... 14 Bosnia and Herzegovina64 64 63 0.99 77 78 76 0.99 18 100 ... ... ... 11 Bulgaria40 40 40 0.98 51 -1 52 -1 50 -1 0.97 -1 6.4 -1 99 -1 ... ... ... 14 -1 Croatia86 ** 84 ** 89 ** 1.07 ** ... ... ... ... 21 100 ... ... ... 14 Czech Republic71 71 70 0.99 90 90 91 1.01 6.8 ... ... ... ... 7 Estonia77 77 77 0.99 86 87 86 0.99 30 100 ... ... ... 11 Hungary51 52 50 0.96 87 87 86 0.99 6.8 99 ... ... ... 10 Latvia47 48 47 0.99 71 72 71 1.00 13 100 ... ... ... 7 Lithuania... ... ... ... ... ... ... ... ... ... ... ... ... ... Montenegro49 49 49 1.01 59 -1 58 -1 59 -1 1.01 -1 49 -1 98 -1 ... ... ... 18 -1 Poland37 ** ... ... ... 71 * 72 * 71 * 0.99 * 11 100 90 . 90 10 Republic of Moldova62 61 63 1.02 72 72 72 1.01 37 100 ... ... ... 17 Romania... ... ... ... 73 73 73 1.00 635 99 ... ... ... 8 Russian Federation... ... ... ... 50 * 50 * 50 * 1.00 * 10 98 100 -1 100 -1 100 -1 17 Serbia... ... ... ... ... ... ... ... 11 100 ... ... ... 13 Slovakia74 78 71 0.91 81 82 80 0.98 2.5 99 ... ... ... 18 Slovenia27 27 28 1.02 37 -1 37 -1 37 -1 1.03 -1 3.3 -1 98 -1 ... ... ... 11 -1 The former Yugoslav Rep. of Macedonia... ... ... ... 18 18 17 0.95 26 95 ... ... ... 27 Turkey... ... ... ... ... ... ... ... 132 99 ... ... ... 9 UkraineCentral Asia... ... ... ... ... ... ... ... 5.1 -1 100 -1 ... ... ... 9 -1 Armenia14 * 14 * 13 * 0.89 * 22 * 22 * 23 * 1.05 * 10 100 89 77 89 9 Azerbaijan99
T a b l e1Pre-primary education / isced 0 / Enrolment and teaching staffRegionEducationsystemEnrolmentGross enrolment ratioCountry or territory2008 1999 2008Entrance%age Duration MF (000) % F Private MF M F GPI MF M F GPI1 2 3 4 5 6 7 8 9 10 11 12 13Georgia 3 3 79 51 ** - 35 35 34 0.98 63 56 ** 70 ** 1.26 **Kazakhstan 3 4 375 +1 48 +1 5 +1 14 15 14 0.96 52 +1 52 +1 51 +1 0.98 +1Kyrgyzstan 3 4 67 49 1 10 11 9 0.80 17 16 17 1.02Mongolia 3 4 100 51 4 26 24 28 1.19 57 55 60 1.08Tajikistan 3 4 61 45 . 8 9 7 0.76 9 10 8 0.86Turkmenistan 3 4 ... ... ... ... ... ... ... ... ... ... ...Uzbekistan 3 4 554 49 - 24 24 23 0.94 27 27 27 1.02East Asia and the PacificAustralia 4 1 216 48 76 ... ... ... ... 82 83 81 0.98Brunei Darussalam 4 2 12 49 68 76 74 77 1.04 83 81 85 1.04Cambodia 3 3 119 51 33 5 ** 5 ** 5 ** 1.03 ** 13 13 13 1.07China 4 3 23,488 45 37 36 36 36 1.00 44 44 44 0.99Cook Islands 4 1 0.48 -1 46 -1 29 -1 86 * 87 * 85 * 0.98 * ... ... ... ...Democratic People’s Republic of Korea 4 2 ... ... ... ... ... ... ... ... ... ... ...Fiji 3 3 8.6 -2 49 -2 100 -2 16 16 16 1.02 16 -2 16 -2 16 -2 1.01 -2Hong Kong SAR of China 3 3 138 48 100 77 78 75 0.96 ... ... ... ...Indonesia 5 2 3,584 50 99 24 ** 24 ** 24 ** 1.01 ** 43 42 44 1.04Japan 3 3 3,032 ... 68 83 82 ** 84 ** 1.02 ** 89 ... ... ...Kiribati 3 3 ... ... ... ... ... ... ... ... ... ... ...Lao People’s Democratic Republic 3 3 70 50 29 8 7 8 1.11 15 15 15 1.06Macao, China 3 3 9.1 +1 48 +1 97 +1 ... ... ... ... ... ... ... ...Malaysia 4 2 654 -1 50 -1 43 -1 54 53 55 1.04 61 -1 58 -1 63 -1 1.08 -1Marshall Islands 4 2 1.4 -1 48 -1 ... 59 ** 57 ** 60 ** 1.04 ** 45 *, -1 45 *, -1 45 *, -1 *, -11.00Micronesia (Federated States of) 3 3 ... ... ... 37 ... ... ... ... ... ... ...Myanmar 3 2 112 50 58 2 ... ... ... 6 6 6 1.02Nauru 3 3 0.66 50 ... … … … … 92 ** 91 ** 93 ** 1.02 **New Zealand 3 2 106 49 98 85 85 85 1.00 94 93 96 1.03Niue 4 1 ... ... ... 154 * 159 * 147 * 0.93 * ... ... ... ...Palau 3 3 ... ... ... 63 * 56 * 69 * 1.23 * ... ... ... ...Papua New Guinea 6 1 ... ... ... ... ... ... ... ... ... ... ...Philippines 5 1 1,002 49 41 30 29 31 1.05 49 48 49 1.02Republic of Korea 5 1 539 48 78 76 78 75 0.96 111 112 111 0.99Samoa 3 2 4.1 +1 51 +1 100 +1 53 ** 48 ** 58 ** 1.21 ** 45 +1 43 +1 48 +1 1.13 +1Singapore 3 3 ... ... ... ... ... ... ... ... ... ... ...Solomon Islands 3 3 ... ... ... 35 ** 35 ** 35 ** 1.02 ** ... ... ... ...Thailand 3 3 2,660 +1 49 +1 20 +1 87 87 87 1.00 92 +1 92 +1 93 +1 1.01 +1Timor-Leste 4 2 ... ... ... ... ... ... ... ... ... ... ...Tokelau 3 2 ... ... ... 104 **, +1 109 **, +1 97 **, +1 0.89 **, +1 ... ... ... ...Tonga 3 2 ... ... ... 29 26 32 1.24 ... ... ... ...Tuvalu 3 3 0.71 -2 52 -2 ... ... ... ... ... 107 *, -2 98 *, -2 116 *, -2 *, -21.18Vanuatu 3 3 1.3 -2 47 -2 94 -2 ... ... ... ... 7 -2 7 -2 7 -2 0.95 -2Viet Nam 3 3 3,196 49 56 40 41 39 0.94 ... ... ... ...Latin America and the CaribbeanAnguilla 3 2 0.45 51 100 117 **, +1 130 **, +1 105 **, +1 0.81 **, +1 95 ** 99 ** 91 ** 0.92 **Antigua and Barbuda 3 2 2.4 49 100 ... ... ... ... 72 * 71 * 72 * 1.01 *Argentina 3 3 1,374 -1 50 -1 31 -1 57 56 58 1.02 69 -1 68 -1 69 -1 1.02 -1100
G l o b a l e d u c a t i o n d i g e s t 2 0 1 0 C o m p a r i n g e d u c a t i o n s t a t i s t i c s a r o u n d t h e w o r l dNet enrolment rateTeachingstaffTrained teachers(%)Pupil/teacherratio1999 2008 2008 20082008MF M F GPI MF M F GPI MF (000) % F MF M F14 15 16 17 18 19 20 21 22 23 24 25 26 2720 20 20 0.99 45 -1 41 -1 50 -1 1.21 -1 7.3 -1 100 -1 ... ... ... 11 -1 GeorgiaRegionCountry or territory... ... ... ... 39 +1 39 +1 39 +1 0.99 +1 37 +1 98 +1 ... ... ... 10 +1 Kazakhstan7 7 * 6 * 0.80 * 14 14 14 1.02 2.5 100 42 50 42 27 Kyrgyzstan24 22 26 1.19 47 45 49 1.09 4.0 99 93 ... ... 25 Mongolia7 ... ... ... 7 7 6 0.87 4.7 100 83 . 83 13 Tajikistan... ... ... ... ... ... ... ... ... ... ... ... ... ... Turkmenistan... ... ... ... 18 17 18 1.04 60 95 100 100 100 9 Uzbekistan... ... ... ... 52 52 51 0.98 ... ... ... ... ... ... AustraliaEast Asia and the Pacific... ... ... ... 65 63 66 1.04 0.61 97 67 94 66 20 Brunei Darussalam5 ** 4 ** 5 ** 1.03 ** 12 12 13 1.07 5.2 94 88 -2 ... ... 23 Cambodia... ... ... ... ... ... ... ... 1,049 98 ... ... ... 22 China90 *, -1 97 *, -1 83 *, -1 0.85 *, -1 ... ... ... ... 0.03 -1 100 -1 41 -1 . -1 41 -1 15 -1 Cook Islands... ... ... ... ... ... ... ... ... ... ... ... ... ... Democratic People’s Republic of Korea... ... ... ... 15 -2 15 -2 15 -2 1.01 -2 0.45 -2 ... ... ... ... 19 -2 Fiji... ... ... ... ... ... ... ... 10 99 96 65 97 13 Hong Kong SAR of China... ... ... ... 31 30 32 1.05 280 -1 96 -1 ... ... ... 13 -1 Indonesia83 82 ** 84 ** 1.02 ** 89 ... ... ... 109 ... ... ... ... 28 Japan... ... ... ... ... ... ... ... ... ... ... ... ... ... Kiribati7 7 8 1.12 14 13 14 1.06 3.7 97 81 -1 67 -1 81 -1 19 Lao People’s Democratic Republic... ... ... ... ... ... ... ... 0.52 +1 99 +1 96 +1 100 +1 96 +1 18 +1 Macao, China50 49 51 1.04 61 -1 58 -1 63 -1 1.08 -1 27 -1 96 -1 ... ... ... 24 -1 Malaysia... ... ... ... ... ... ... ... ... ... ... ... ... ... Marshall Islands... ... ... ... ... ... ... ... ... ... ... ... ... ... Micronesia (Federated States of)... ... ... ... 6 6 6 1.02 6.4 99 52 ... ... 18 Myanmar... ... ... ... 57 **, -1 58 **, -1 57 **, -1 0.99 **, -1 0.04 98 82 -1 . -1 84 -1 16 Nauru84 83 84 1.01 93 92 95 1.03 9.0 99 ... ... ... 12 New Zealand... ... ... ... ... ... ... ... ... ... ... ... ... ... Niue... ... ... ... ... ... ... ... ... ... ... ... ... ... Palau... ... ... ... ... ... ... ... ... ... ... ... ... ... Papua New Guinea24 ** 24 ** 24 ** 0.99 ** 39 39 38 0.96 28 -1 97 -1 ... ... ... 35 -1 Philippines43 44 43 0.97 51 51 51 0.98 30 99 ... ... ... 18 Republic of Korea40 ** 38 ** 42 ** 1.09 ** ... ... ... ... 0.30 +1 98 +1 ... ... ... 14 +1 Samoa... ... ... ... ... ... ... ... ... ... ... ... ... ... Singapore... ... ... ... ... ... ... ... ... ... ... ... ... ... Solomon Islands... ... ... ... 80 80 80 1.01 104 78 ... ... ... 24 Thailand... ... ... ... ... ... ... ... ... ... ... ... ... ... Timor-Leste... ... ... ... ... ... ... ... ... ... ... ... ... ... Tokelau21 14 30 2.13 ... ... ... ... ... ... ... ... ... ... Tonga... ... ... ... 92 *, -2 84 *, -2 100 *, -2 1.19 *, -2 ... ... ... ... ... ... Tuvalu... ... ... ... 5 -2 5 -2 5 -2 0.98 -2 0.11 -2 91 -2 ... ... ... 12 -2 Vanuatu39 ... ... ... ... ... ... ... 173 99 91 43 92 18 Viet Nam90 **, +1 ... ... ... 95 ** 99 ** 91 ** 0.92 ** 0.04 100 23 . 23 10 AnguillaLatin America and the Caribbean... ... ... ... 66 * 66 * 66 * 1.01 * 0.21 100 12 . 12 11 Antigua and Barbuda57 56 57 1.03 68 -1 68 -1 69 -1 1.02 -1 78 -1 96 -1 ... ... ... 18 -1 Argentina101
T a b l e1Pre-primary education / isced 0 / Enrolment and teaching staffRegionEducationsystemEnrolmentGross enrolment ratioCountry or territory2008 1999 2008Entrance%age Duration MF (000) % F Private MF M F GPI MF M F GPI1 2 3 4 5 6 7 8 9 10 11 12 13Aruba 4 2 2.7 49 73 97 99 95 0.96 104 103 104 1.01Bahamas 3 2 ... ... ... 12 11 12 1.09 ... ... ... ...Barbados 3 2 5.9 * 50 * 15 * ... ... ... ... ... ... ... ...Belize 3 2 5.8 50 82 26 25 26 1.02 40 39 41 1.04Bermuda 4 1 ... ... ... ... ... ... ... ... ... ... ...Bolivia 4 2 238 -1 49 -1 10 -1 45 44 45 1.01 49 -1 49 -1 49 -1 1.00 -1Brazil 4 3 6,785 49 26 58 58 58 1.00 65 65 65 0.99British Virgin Islands 3 2 0.65 -2 52 -2 100 -2 62 * 57 * 66 * 1.16 * 93 *, -2 88 *, -2 97 *, -2 *, -21.11Cayman Islands 3 2 1.3 54 97 54 *, +1 56 *, +1 52 *, +1 0.94 *, +1 103 * 103 * 103 * 1.00 *Chile 3 3 407 -1 50 -1 56 -1 77 77 76 0.99 56 -1 55 -1 57 -1 1.04 -1Colombia 3 3 1,312 49 34 39 38 39 1.02 49 50 49 0.99Costa Rica 4 2 108 49 13 84 84 85 1.01 69 69 69 0.99Cuba 3 3 408 +1 48 +1 . +1 109 107 111 1.04 105 +1 105 +1 105 +1 1.00 +1Dominica 3 2 2.0 49 100 80 * 76 * 85 * 1.11 * 77 * 79 * 75 * 0.96 *Dominican Republic 3 3 222 49 51 31 31 31 1.01 35 35 35 1.00Ecuador 5 1 291 ** 49 ** ... 64 63 66 1.04 101 ** 101 ** 102 ** 1.01 **El Salvador 4 3 224 50 18 41 41 42 1.03 60 59 61 1.03Grenada 3 2 3.8 50 58 84 83 85 1.02 103 101 105 1.04Guatemala 3 4 478 50 19 46 46 45 0.97 29 29 30 1.01Guyana 4 2 27 49 3 121 122 120 0.99 85 85 85 1.00Haiti 3 3 ... ... ... ... ... ... ... ... ... ... ...Honduras 3 3 227 50 13 22 +1 21 +1 22 +1 1.05 +1 40 40 41 1.03Jamaica 3 3 134 50 90 80 77 83 1.08 86 85 88 1.03Mexico 4 2 4,757 49 15 74 73 75 1.02 114 113 115 1.01Montserrat 3 2 0.12 -1 47 -1 - -1 ... ... ... ... 91 *, -1 102 *, -1 81 *, -1 *, -10.80Netherlands Antilles 4 2 ... ... ... 111 110 113 1.02 ... ... ... ...Nicaragua 3 3 221 49 15 28 27 28 1.04 56 55 56 1.01Panama 4 2 95 49 16 39 39 40 1.01 69 69 69 1.01Paraguay 3 3 152 -1 49 -1 30 -1 29 29 30 1.03 35 -1 35 -1 35 -1 1.01 -1Peru 3 3 1,276 49 24 56 56 57 1.02 72 72 72 1.01Saint Kitts and Nevis 3 2 1.6 50 64 132 *, +1 118 **, +1 146 **, +1 1.24 **, +1 ... ... ... ...Saint Lucia 3 2 3.9 50 100 65 ** 64 ** 65 ** 1.02 ** 68 68 68 1.00Saint Vincent and the Grenadines 3 2 ... ... ... ... ... ... ... ... ... ... ...Suriname 4 2 17 50 44 ... ... ... ... 81 81 81 1.00Trinidad and Tobago 3 2 30 * 49 * 90 * 58 ** 58 ** 59 ** 1.01 ** 82 * 82 * 81 * 1.00 *Turks and Caicos Islands 4 2 ... ... ... ... ... ... ... ... ... ... ...Uruguay 3 3 122 -1 49 -1 33 -1 60 59 60 1.02 81 -1 80 -1 81 -1 1.01 -1Venezuela 3 3 1,184 49 18 45 44 45 1.03 69 69 69 1.01North America and Western EuropeAndorra 3 3 2.5 48 2 ... ... ... ... 98 * 98 * 99 * 1.00 *Austria 3 3 225 49 28 82 83 82 0.99 95 95 95 0.99Belgium 3 3 417 49 53 111 112 110 0.99 122 122 121 0.99Canada 4 2 486 -2 49 -2 6 -2 64 64 64 0.99 70 -2 71 -2 70 -2 1.00 -2Cyprus 3 3 20 48 52 60 * 59 * 60 * 1.02 * 83 * 83 * 82 * 0.98 *Denmark 3 4 252 -1 49 -1 ... 90 90 90 1.00 96 -1 96 -1 96 -1 1.00 -1Finland 3 4 147 49 9 48 49 48 0.99 65 66 65 0.99102
G l o b a l e d u c a t i o n d i g e s t 2 0 1 0 C o m p a r i n g e d u c a t i o n s t a t i s t i c s a r o u n d t h e w o r l dNet enrolment rateTeachingstaffTrained teachers(%)Pupil/teacherratio1999 2008 2008 20082008MF M F GPI MF M F GPI MF (000) % F MF M F14 15 16 17 18 19 20 21 22 23 24 25 26 2795 97 93 0.96 99 98 100 1.02 0.14 99 100 100 100 19 ArubaRegion12 11 12 1.09 ... ... ... ... ... ... ... ... ... ... Bahamas... ... ... ... ... ... ... ... 0.36 * 98 * 48 * 33 * 49 * 16 * Barbados24 24 25 1.02 38 37 39 1.04 0.35 99 9 -1 . -1 9 -1 17 Belize... ... ... ... ... ... ... ... ... ... ... ... ... ... Bermuda33 33 33 1.02 40 -1 40 -1 40 -1 1.01 -1 6.1 -1 ... ... ... ... 39 -1 Bolivia44 44 44 1.00 50 50 50 1.00 361 97 ... ... ... 19 BrazilCountry or territory47 * 43 * 51 * 1.18 * 84 *, -2 80 *, -2 88 *, -2 1.10 *, -2 0.05 -2 100 -2 ... ... ... 15 -2 British Virgin Islands54 *, +1 56 *, +1 52 *, +1 0.94 *, +1 93 * 91 * 95 * 1.05 * 0.15 97 100 -2 . -2 100 -2 9 Cayman Islands... ... ... ... 53 -1 52 -1 54 -1 1.05 -1 22 -1 98 -1 ... ... ... 19 -1 Chile35 34 ** 35 ** 1.02 ** 44 43 44 1.01 49 96 100 100 100 27 Colombia... ... ... ... ... ... ... ... 7.4 94 77 58 78 15 Costa Rica97 95 100 1.05 97 +1 97 +1 97 +1 1.00 +1 29 +1 100 +1 100 +1 . +1 100 +1 14 +1 Cuba76 ** 72 ** 81 ** 1.12 ** ... ... ... ... 0.14 100 ... ... ... 15 Dominica27 27 28 1.03 31 30 31 1.02 9.2 94 78 49 80 24 Dominican Republic53 52 54 1.04 48 ** ... ... ... 17 ** 87 ** 100 ** 100 ** 100 ** 17 ** Ecuador36 ** 36 ** 37 ** 1.03 ** 51 50 52 1.04 9.2 89 88 67 90 24 El Salvador84 83 85 1.02 95 93 97 1.04 0.26 100 46 . 46 15 Grenada33 33 32 0.97 28 28 28 1.01 21 92 ... ... ... 23 Guatemala99 ** 100 ** 98 ** 0.99 ** 71 71 71 1.00 1.8 100 55 25 55 15 Guyana... ... ... ... ... ... ... ... ... ... ... ... ... ... Haiti22 +1 21 **, +1 22 **, +1 1.05 **, +1 27 27 27 1.03 7.7 94 ... ... ... 29 Honduras80 77 83 1.08 81 79 82 1.04 6.0 -1 98 -1 ... ... ... 24 -1 Jamaica67 66 67 1.02 97 96 97 1.01 176 95 85 ... ... 27 Mexico... ... ... ... 73 *, -1 83 *, -1 63 *, -1 0.76 *, -1 0.01 -1 100 -1 100 -1 . -1 100 -1 11 -1 Montserrat99 ... ... ... ... ... ... ... ... ... ... ... ... ... Netherlands Antilles28 27 28 1.04 56 55 56 1.01 11 95 33 34 33 20 Nicaragua37 37 37 1.01 61 61 61 1.00 5.3 95 42 6 45 18 Panama26 25 26 1.04 31 -1 31 -1 32 -1 1.02 -1 ... ... ... ... ... ... Paraguay56 55 57 1.02 69 69 70 1.01 65 95 ... ... ... 20 Peru... ... ... ... ... ... ... ... 0.12 100 ... ... ... 14 Saint Kitts and Nevis49 **, +1 48 **, +1 50 **, +1 1.05 **, +1 51 51 51 1.00 0.36 100 ... ... ... 11 Saint Lucia... ... ... ... ... ... ... ... ... ... ... ... ... ... Saint Vincent and the Grenadines... ... ... ... 80 80 80 0.99 0.81 100 100 100 100 21 Suriname49 ** 48 ** 49 ** 1.04 ** 66 * 66 * 66 * 1.00 * 2.2 * ... ... ... ... 14 * Trinidad and Tobago... ... ... ... ... ... ... ... ... ... ... ... ... ... Turks and Caicos Islands53 ** 52 ** 54 ** 1.02 ** 72 -1 72 -1 73 -1 1.01 -1 5.2 -1 ... ... ... ... 23 -1 Uruguay40 40 41 1.03 65 65 65 1.01 79 94 87 71 88 15 Venezuela... ... ... ... 84 * 84 * 83 * 0.99 * 0.19 94 100 100 100 13 Andorra79 ** 79 ** 78 ** 0.99 ** ... ... ... ... 17 99 ... ... ... 13 Austria97 97 96 0.99 100 100 100 1.00 30 98 ... ... ... 14 Belgium64 64 64 0.99 ... ... ... ... ... ... ... ... ... ... Canada54 * 53 * 54 * 1.03 * 73 * 73 * 73 * 0.99 * 1.2 99 ... ... ... 17 Cyprus88 87 89 1.02 92 -1 91 -1 93 -1 1.03 -1 ... ... ... ... ... ... Denmark48 49 48 0.99 65 65 65 1.00 13 97 ... ... ... 11 FinlandNorth America and Western Europe103
T a b l e1Pre-primary education / isced 0 / Enrolment and teaching staffRegionEducationsystemEnrolmentGross enrolment ratioCountry or territory2008 1999 2008Entrance%age Duration MF (000) % F Private MF M F GPI MF M F GPI1 2 3 4 5 6 7 8 9 10 11 12 13France 3 3 2,570 49 13 111 111 111 1.00 110 111 110 0.99Germany 3 3 2,410 48 64 94 95 93 0.98 109 110 108 0.99Gibraltar 4 1 ... ... ... ... ... ... ... ... ... ... ...Greece 4 2 143 -1 49 -1 3 -1 68 67 68 1.01 69 -1 68 -1 69 -1 1.02 -1Holy See . . . . . . . . . . . . .Iceland 3 3 12 49 11 88 88 87 0.99 98 98 98 1.01Ireland 3 1 ... ... ... ... ... ... ... ... ... ... ...Israel 3 3 397 49 7 105 106 105 0.98 97 97 97 1.01Italy 3 3 1,653 -1 48 -1 32 -1 97 97 96 0.98 101 -1 102 -1 100 -1 0.98 -1Liechtenstein 4 2 0.74 48 3 ... ... ... ... 101 * 101 * 101 * 1.00 *Luxembourg 3 3 15 48 8 73 73 73 1.00 88 89 87 0.98Malta 3 2 8.4 -1 49 -1 33 -1 103 103 102 0.99 101 -1 100 -1 102 -1 1.02 -1Monaco 3 3 0.89 +1 49 +1 20 +1 ... ... ... ... 112 *, +1 116 *, +1 107 *, +1 *, +10.92Netherlands 4 2 398 49 ... 98 99 98 0.99 100 100 100 1.00Norway 3 3 166 49 45 75 73 77 1.06 95 94 95 1.01Portugal 3 3 264 -1 49 -1 48 -1 70 70 70 0.99 80 -1 80 -1 81 -1 1.01 -1San Marino 3 3 1.0 46 . ... ... ... ... ... ... ... ...Spain 3 3 1,645 49 36 100 100 100 1.00 126 125 126 1.00Sweden 3 4 373 49 15 76 76 76 1.01 102 102 101 1.00Switzerland 5 2 152 49 10 92 93 92 0.99 102 102 102 1.00United Kingdom 3 2 1,108 49 29 77 77 77 1.00 81 80 81 1.02United States of America 3 3 7,191 49 35 58 59 57 0.97 58 58 58 0.99South and West AsiaAfghanistan 3 4 ... ... ... ... ... ... ... ... ... ... ...Bangladesh 3 3 ... ... ... 18 17 18 1.03 ... ... ... ...Bhutan 4 2 0.29 51 100 1 1 1 0.93 1 1 1 1.09India 3 3 35,440 -1 49 -1 ... 18 18 19 1.02 47 -1 47 -1 48 -1 1.03 -1Iran (Islamic Republic of) 5 1 560 48 ... 15 15 16 1.04 52 53 51 0.96Maldives 3 3 16 50 92 55 55 54 0.97 101 101 102 1.01Nepal 3 2 947 +2 48 +2 ... 10 * 12 * 9 * 0.77 * ... ... ... ...Pakistan 3 2 ... ... ... 62 *, +1 72 *, +1 51 *, +1 0.70 *, +1 ... ... ... ...Sri Lanka 4 1 ... ... ... ... ... ... ... ... ... ... ...Sub-Saharan AfricaAngola 3 3 716 44 1 27 ** 32 ** 21 ** 0.65 ** 40 45 35 0.79Benin 4 2 68 49 32 4 5 4 0.97 13 13 13 1.00Botswana 3 3 21 -2 51 -2 81 -2 ... ... ... ... 16 -2 16 -2 17 -2 1.04 -2Burkina Faso 4 3 42 +1 49 +1 71 +1 2 2 2 1.03 3 +1 3 +1 3 +1 1.01 +1Burundi 4 3 16 -1 52 **, -1 46 -1 1 1 1 1.01 3 -1 3 **, -1 3 **, -1 **, -11.09Cameroon 4 2 264 50 66 11 11 11 0.95 25 25 25 1.02Cape Verde 3 3 22 50 ... 51 **, +1 51 **, +1 52 **, +1 1.02 **, +1 60 60 60 1.01Central African Republic 3 3 17 +1 51 +1 54 +1 ... ... ... ... 5 +1 4 +1 5 +1 1.02 +1Chad 3 3 ... ... ... ... ... ... ... ... ... ... ...Comoros 3 3 14 48 100 3 3 3 1.07 27 27 26 0.96Congo 3 3 38 50 80 2 2 3 1.61 12 12 13 1.02Côte d’Ivoire 3 3 53 49 37 2 2 2 0.96 3 3 3 0.98Democratic Republic of the Congo 3 3 201 51 62 1 **, +1 1 **, +1 1 **, +1 0.98 **, +1 3 3 3 1.05104
G l o b a l e d u c a t i o n d i g e s t 2 0 1 0 C o m p a r i n g e d u c a t i o n s t a t i s t i c s a r o u n d t h e w o r l dNet enrolment rateTeachingstaffTrained teachers(%)Pupil/teacherratio1999 2008 2008 20082008MF M F GPI MF M F GPI MF (000) % F MF M F14 15 16 17 18 19 20 21 22 23 24 25 26 2799 99 99 1.00 100 100 100 1.00 142 82 ... ... ... 18 FranceRegion... ... ... ... ... ... ... ... 216 98 ... ... ... 11 Germany... ... ... ... ... ... ... ... ... ... ... ... ... ... Gibraltar68 67 68 1.01 68 -1 67 -1 69 -1 1.02 -1 12 -1 99 -1 ... ... ... 12 -1 Greece. . . . . . . . . . . . . . Holy See88 88 87 0.99 98 98 98 1.01 2.0 96 ... ... ... 6 Iceland... ... ... ... ... ... ... ... ... ... ... ... ... ... Ireland83 83 84 1.00 92 91 93 1.02 ... ... ... ... ... ... Israel97 97 96 0.98 96 -1 97 -1 95 -1 0.98 -1 142 -1 99 -1 ... ... ... 12 -1 ItalyCountry or territory... ... ... ... 76 * 75 * 77 * 1.03 * 0.10 99 ... ... ... 8 Liechtenstein71 71 72 1.01 86 87 85 0.98 1.3 98 ... ... ... 12 Luxembourg88 89 87 0.98 86 -1 85 -1 86 -1 1.01 -1 ... ... ... ... ... ... Malta... ... ... ... ... ... ... ... ... ... ... ... ... ... Monaco98 99 98 0.99 100 100 100 1.00 ... ... ... ... ... ... Netherlands75 72 77 1.06 94 94 95 1.01 ... ... ... ... ... ... Norway69 69 68 0.99 79 -1 78 -1 80 -1 1.02 -1 17 -1 97 -1 ... ... ... 16 -1 Portugal... ... ... ... ... ... ... ... 0.14 97 ... ... ... 8 San Marino93 93 93 1.00 99 99 100 1.01 133 91 ... ... ... 12 Spain76 76 76 1.01 100 100 100 1.00 36 -1 96 -1 ... ... ... 10 -1 Sweden73 73 73 0.99 75 75 74 0.99 ... ... ... ... ... ... Switzerland73 73 73 1.00 75 75 76 1.02 52 95 ... ... ... 21 United Kingdom54 54 53 0.98 53 53 54 1.02 445 97 ... ... ... 16 United States of AmericaSouth and West Asia... ... ... ... ... ... ... ... ... ... ... ... ... ... Afghanistan... ... ... ... ... ... ... ... ... ... ... ... ... ... Bangladesh1 1 1 0.92 ... ... ... ... 0.02 **, -2 ... ... ... ... 23 **, -2 Bhutan... ... ... ... ... ... ... ... 738 -2 100 -2 ... ... ... 40 -2 India... ... ... ... ... ... ... ... ... ... ... ... ... ... Iran (Islamic Republic of)50 51 49 0.98 84 84 84 1.01 0.74 97 45 -2 46 -2 45 -2 21 Maldives... ... ... ... ... ... ... ... 20 93 73 75 72 41 Nepal... ... ... ... ... ... ... ... ... ... ... ... ... ... Pakistan... ... ... ... ... ... ... ... ... ... ... ... ... ... Sri Lanka... ... ... ... ... ... ... ... ... ... ... ... ... ... Angola3 3 3 0.96 ... ... ... ... 1.8 73 ... ... ... 38 Benin... ... ... ... 13 -2 12 -2 13 -2 1.05 -2 1.5 -2 97 -2 51 -2 43 -2 51 -2 14 -2 BotswanaSub-Saharan Africa... ... ... ... 2 +1 2 +1 2 +1 1.00 +1 1.8 ** ... ... ... ... 24 ** Burkina Faso... ... ... ... ... ... ... ... 0.44 *, -1 87 *, -1 ... ... ... 37 *, -1 Burundi... ... ... ... 18 17 18 1.02 12 97 43 -1 38 -1 43 -1 22 Cameroon... ... ... ... 57 56 57 1.01 1.0 100 26 . 26 22 Cape Verde... ... ... ... 4 +1 4 +1 4 +1 1.01 +1 0.32 +1 88 +1 ... ... ... 54 +1 Central African Republic... ... ... ... ... ... ... ... ... ... ... ... ... ... Chad2 3 2 0.98 ... ... ... ... ... ... ... ... ... ... Comoros2 2 3 1.61 12 12 13 1.02 1.7 99 ... ... ... 23 Congo3 +1 3 +1 3 +1 0.96 +1 ... ... ... ... 3.4 91 100 100 100 15 Côte d’Ivoire... ... ... ... ... ... ... ... 7.2 94 ... ... ... 28 Democratic Republic of the Congo105
T a b l e1Pre-primary education / isced 0 / Enrolment and teaching staffRegionEducationsystemEnrolmentGross enrolment ratioCountry or territory2008 1999 2008Entrance%age Duration MF (000) % F Private MF M F GPI MF M F GPI1 2 3 4 5 6 7 8 9 10 11 12 13Equatorial Guinea 3 4 40 -1 57 -1 ... 26 25 26 1.04 54 -1 47 -1 62 -1 1.33 -1Eritrea 5 2 36 49 48 5 6 5 0.89 13 14 13 0.96Ethiopia 4 3 263 49 96 1 1 1 0.97 4 4 4 0.96Gabon 3 3 ... ... ... 14 **, +1 ... ... ... ... ... ... ...Gambia 3 4 42 -1 50 -1 100 -1 19 20 18 0.90 22 -1 22 -1 22 -1 1.01 -1Ghana 3 3 1,263 50 19 ** 40 ** 40 ** 41 ** 1.02 ** 68 67 69 1.04Guinea 4 3 99 * 50 * 82 * ... ... ... ... 11 * 11 * 12 * 1.03 *Guinea-Bissau 4 3 ... ... ... 4 ** 4 ** 4 ** 1.06 ** ... ... ... ...Kenya 3 3 1,720 49 35 42 42 42 1.00 48 49 46 0.96Lesotho 3 3 ... ... ... 21 ** 20 ** 22 ** 1.08 ** ... ... ... ...Liberia 3 3 285 49 24 47 54 40 0.74 84 86 83 0.96Madagascar 3 3 160 51 94 3 ** 3 ** 3 ** 1.02 ** 9 9 9 1.03Malawi 3 3 ... ... ... ... ... ... ... ... ... ... ...Mali 3 4 62 +1 51 +1 72 +1 2 2 2 1.07 4 +1 4 +1 4 +1 1.05 +1Mauritius 3 2 36 +1 50 +1 82 +1 94 93 94 1.02 98 +1 97 +1 99 +1 1.02 +1Mozambique 3 3 ... ... ... ... ... ... ... ... ... ... ...Namibia 5 2 33 -2 50 -2 ... 34 31 36 1.14 31 -2 31 -2 32 -2 1.00 -2Niger 4 3 48 +1 47 +1 27 +1 1 1 1 1.04 3 +1 3 +1 3 +1 0.94 +1Nigeria 3 3 2,135 -1 49 -1 29 -1 ... ... ... ... 16 -1 16 -1 16 -1 0.99 -1Rwanda 4 3 ... ... ... 3 **, +1 3 **, +1 3 **, +1 0.98 **, +1 ... ... ... ...Sao Tome and Principe 3 4 7.0 +1 52 +1 4 +1 25 24 26 1.12 39 +1 37 +1 40 +1 1.08 +1Senegal 4 3 115 53 50 3 3 3 1.00 11 10 11 1.13Seychelles 4 2 2.9 +1 50 +1 8 +1 109 * 107 * 111 * 1.04 * 100 * 101 * 99 * 0.99 *Sierra Leone 3 3 25 -1 52 -1 50 -1 5 +1 ... ... ... 5 -1 5 -1 5 -1 1.06 -1Somalia 3 3 ... ... ... ... ... ... ... ... ... ... ...South Africa 6 1 522 -1 50 -1 6 -1 21 21 21 1.01 51 -1 51 -1 51 -1 1.00 -1Swaziland 3 3 ... ... ... ... ... ... ... ... ... ... ...Togo 3 3 41 +1 51 +1 47 +1 2 2 2 0.99 7 +1 7 +1 8 +1 1.04 +1Uganda 4 2 417 51 100 ... ... ... ... 19 18 19 1.05United Republic of Tanzania 5 2 896 50 10 ... ... ... ... 34 34 35 1.02Zambia 3 4 ... ... ... 2 *, -1 2 *, -1 3 *, -1 1.20 *, -1 ... ... ... ...Zimbabwe 3 3 ... ... ... 41 ** 40 ** 42 ** 1.03 ** ... ... ... ...REGIONAL AVERAGESWorld 148,252 ** 48 ** ... 33 33 32 0.97 44 ** 44 ** 43 ** 0.99 **Arab States 3,158 ** 47 ** ... 15 17 13 0.77 19 ** 19 ** 18 ** 0.92 **Central and Eastern Europe 10,252 48 ... 50 51 ** 49 ** 0.96 ** 66 67 66 0.98Central Asia 1,494 49 ... 20 21 20 0.96 29 29 29 1.02East Asia and the Pacific 39,285 47 # ... 38 38 38 1.00 49 48 # 49 # 1.01 #Latin America and the Caribbean 20,654 49 ... 56 55 56 1.01 68 68 69 1.00North America and Western Europe 20,154 49 ... 75 76 75 0.98 80 80 80 1.00South and West Asia 42,353 # 48 # ... 21 22 20 0.93 42 # 42 # 42 # 1.00 #Sub-Saharan Africa 10,902 ** 49 ** ... 12 ** 12 ** 11 ** 0.96 ** 17 ** 17 ** 17 ** 0.99 **Please refer to the Reader’s Guide for more information on the data and symbols used in each table.106
G l o b a l e d u c a t i o n d i g e s t 2 0 1 0 C o m p a r i n g e d u c a t i o n s t a t i s t i c s a r o u n d t h e w o r l dNet enrolment rateTeachingstaffTrained teachers(%)Pupil/teacherratio1999 2008 2008 20082008MF M F GPI MF M F GPI MF (000) % F MF M F14 15 16 17 18 19 20 21 22 23 24 25 26 27RegionCountry or territory25 25 26 1.04 ... ... ... ... 1.7 -1 87 -1 ... ... ... 24 -1 Equatorial Guinea4 5 4 0.90 9 9 9 0.96 1.1 97 60 59 60 34 Eritrea... ... ... ... 3 3 3 0.97 9.8 67 71 11 100 27 Ethiopia... ... ... ... ... ... ... ... ... ... ... ... ... ... Gabon... ... ... ... 19 -1 19 -1 20 -1 1.04 -1 ... ... ... ... ... ... Gambia27 **, +1 27 **, +1 28 **, +1 1.04 **, +1 49 48 50 1.05 36 84 25 22 26 35 Ghana... ... ... ... 9 * 9 * 9 * 1.03 * 2.9 * 46 * 45 * 41 * 50 * 34 * Guinea3 +1 3 +1 3 +1 1.02 +1 ... ... ... ... ... ... ... ... ... ... Guinea-Bissau... ... ... ... 26 26 26 0.99 78 87 74 73 74 22 Kenya... ... ... ... ... ... ... ... ... ... ... ... ... ... Lesotho44 +1 46 +1 41 +1 0.90 +1 20 21 20 0.96 3.5 52 100 100 100 82 Liberia3 +1 3 +1 3 +1 1.07 +1 9 9 9 1.03 6.1 97 51 35 52 26 Madagascar... ... ... ... ... ... ... ... ... ... ... ... ... ... Malawi... ... ... ... 4 +1 4 +1 4 +1 1.05 +1 1.7 +1 93 +1 58 +1 ... ... 37 +1 Mali67 ** 66 ** 67 ** 1.02 ** 91 +1 89 +1 92 +1 1.03 +1 2.5 +1 99 +1 98 +1 100 +1 98 +1 14 +1 Mauritius... ... ... ... ... ... ... ... ... ... ... ... ... ... Mozambique... ... ... ... ... ... ... ... ... ... ... ... ... ... Namibia1 1 1 1.04 2 +1 2 +1 2 +1 0.90 +1 1.6 +1 94 +1 97 +1 91 +1 97 +1 31 +1 Niger... ... ... ... ... ... ... ... 267 -1 64 -1 46 -1 39 -1 50 -1 8 -1 Nigeria... ... ... ... ... ... ... ... ... ... ... ... ... ... Rwanda25 24 26 1.12 37 +1 36 +1 39 +1 1.09 +1 0.31 +1 96 +1 47 +1 77 +1 45 +1 23 +1 Sao Tome and Principe3 +1 3 +1 3 +1 1.04 +1 7 7 8 1.12 4.6 77 ... ... ... 25 Senegal89 * 88 * 90 * 1.02 * 87 * 85 * 88 * 1.03 * 0.19 +1 100 +1 99 +1 ... ... 15 +1 Seychelles... ... ... ... 4 -1 4 -1 4 -1 1.07 -1 1.2 -1 79 -1 52 -1 53 -1 52 -1 20 -1 Sierra Leone... ... ... ... ... ... ... ... ... ... ... ... ... ... Somalia6 6 6 0.98 ... ... ... ... ... ... ... ... ... ... South Africa... ... ... ... ... ... ... ... ... ... ... ... ... ... Swaziland2 2 2 0.99 7 +1 7 +1 8 +1 1.04 +1 1.6 +1 96 +1 29 -1 24 -1 30 -1 25 +1 Togo... ... ... ... 10 10 10 1.04 11 80 ... ... ... 40 Uganda... ... ... ... 34 34 35 1.02 18 -1 56 -1 14 -1 8 -1 19 -1 43 -1 United Republic of Tanzania... ... ... ... ... ... ... ... ... ... ... ... ... ... Zambia... ... ... ... ... ... ... ... ... ... ... ... ... ... ZimbabweREGIONAL AVERAGES… … … … … … … … 7,254 ** 94 ** … … … 20 ** WORLD… … … … … … … … 165 ** 91 ** … … … 19 ** Arab States… … … … … … … … 1,067 99 … … … 10 Central and Eastern Europe… … … … … … … … 153 98 … … … 10 Central Asia… … … … … … … … 1,842 # 96 # … … … 21 # East Asia and the Pacific… … … … … … … … 988 96 … … … 21 Latin America and the Caribbean… … … … … … … … 1,418 94 … … … 14 North America and Western Europe… … … … … … … … 1,059 # 95 # … … … 40 # South and West Asia… … … … … … … … 564 ** 75 ** … … … 19 ** Sub-Saharan Africa107
T a b l e2 PRIMARY EDUCATION / ISCED 1 / New entrantsRegion Education system New entrants Gross intake ratio Net intake rateCountry or territoryArab StatesPrimary education 2008 2008 1999Compulsoryeducation(age range)Entranceage Duration MF (000) % F MF M F GPI MF M F1 2 3 4 5 6 7 8 9 10 11 12Algeria 6-16 6 6 601 48 103 104 102 0.98 77 79 76Bahrain 6-14 6 6 14 48 107 108 105 0.97 89 86 92Djibouti 6-15 6 6 13 47 63 65 60 0.92 21 24 18Egypt 6-14 6 6 1,702 -1 48 -1 97 -1 98 -1 96 -1 0.98 -1 79 **, +1 81 **, +1 **, +178Iraq 6-11 6 6 ... ... ... ... ... ... 81 ** 85 ** 78 **Jordan 6-16 6 6 141 49 99 99 99 1.00 68 ** 67 ** 69 **Kuwait 6-14 6 5 43 49 94 95 93 0.97 62 63 61Lebanon 6-15 6 6 72 +1 50 +1 103 +1 100 +1 105 +1 1.06 +1 72 ** 74 ** 71 **Libyan Arab Jamahiriya 6-15 6 6 ... ... ... ... ... ... ... ... ...Mauritania 6-16 6 6 100 +1 50 +1 115 +1 112 +1 119 +1 1.06 +1 ... ... ...Morocco 6-15 6 6 625 49 106 107 105 0.98 51 53 48Oman … 6 6 44 49 73 73 73 1.00 71 70 71Palestinian Autonomous Territories 6-15 6 4 98 49 77 77 77 1.00 83 **, +1 84 **, +1 **, +183Qatar 6-17 6 6 15 49 106 106 107 1.01 ... ... ...Saudi Arabia 6-11 6 6 555 50 101 100 101 1.01 ... ... ...Sudan 6-13 6 6 915 +1 ... 83 +1 ... ... ... ... ... ...Syrian Arab Republic 6-14 6 4 575 49 117 118 116 0.98 60 60 59Tunisia 6-16 6 6 162 49 107 106 107 1.01 ... ... ...United Arab Emirates 6-11 6 5 61 -1 48 -1 110 -1 110 -1 109 -1 0.99 -1 48 49 48Yemen 6-14 6 6 688 46 104 110 98 0.89 25 30 20Central and Eastern EuropeAlbania 6-13 6 4 ... ... ... ... ... ... ... ... ...Belarus 6-14 6 4 88 50 99 97 102 1.05 76 77 76Bosnia and Herzegovina … 6 4 ... ... ... ... ... ... ... ... ...Bulgaria 7-16 7 4 68 49 107 107 108 1.01 ... ... ...Croatia 7-15 7 4 44 -1 49 -1 94 -1 94 -1 94 -1 0.99 -1 68 69 67Czech Republic 6-15 6 5 91 48 108 109 107 0.99 ... ... ...Estonia 7-15 7 6 12 48 102 102 102 1.00 ... ... ...Hungary 7-16 7 4 98 49 103 103 103 1.00 ... ... ...Latvia 7-15 7 6 20 49 105 104 105 1.01 ... ... ...Lithuania 7-16 7 4 31 48 96 97 94 0.97 ... ... ...Montenegro 7-14 7 4 ... ... ... ... ... ... ... ... ...Poland 7-15 7 6 373 -1 ... 97 -1 ... ... ... ... ... ...Republic of Moldova 7-15 7 4 36 48 96 * 98 * 93 * 0.96 * ... ... ...Romania 7-14 7 4 220 48 100 101 99 0.99 ... ... ...Russian Federation 6-15 7 4 1,274 ... 99 ... ... ... ... ... ...Serbia 7-14 7 4 72 49 103 * 102 * 103 * 1.01 * ... ... ...Slovakia 6-16 6 4 52 49 99 100 99 0.99 ... ... ...Slovenia 6-15 6 6 18 49 97 97 97 1.00 ... ... ...The former Yugoslav Rep. of Macedonia 6-15 7 4 24 -1 48 -1 93 -1 92 -1 93 -1 1.01 -1 ... ... ...Turkey 6-14 6 5 1,332 48 99 101 98 0.97 ... ... ...Ukraine 6-17 6 4 384 49 * 100 100 * 100 * 1.00 * 69 ... ...Central AsiaArmenia 7-15 7 3 47 -1 47 -1 128 -1 126 -1 129 -1 1.02 -1 ... ... ...Azerbaijan 6-16 6 4 118 47 114 * 115 * 114 * 0.99 * ... ... ...108
G l o b a l e d u c a t i o n d i g e s t 2 0 1 0 C o m p a r i n g e d u c a t i o n s t a t i s t i c s a r o u n d t h e w o r l dNet intake rateNet intake rate (adjusted)New entrantsto primary educationwith ECCE experience (%)2008 1999 2008 2008MF M F MF M F MF M F MF M F13 14 15 16 17 18 19 20 21 22 23 24RegionCountry or territoryArab States89 90 88 97 98 95 99 100 98 30 -1 19 -1 43 -1 Algeria91 92 90 97 94 100 99 100 97 83 83 84 Bahrain41 ** 43 ** 39 ** 22 25 19 46 48 43 8 -1 8 -1 8 -1 Djibouti... ... ... 85 **, +1 87 **, +1 83 **, +1 89 **, -1 91 **, -1 88 **, -1 ... ... ... Egypt... ... ... 88 90 86 ... ... ... ... ... ... Iraq65 65 65 96 96 96 93 92 93 72 74 69 Jordan64 67 62 89 88 91 94 95 93 82 -1 81 -1 83 -1 Kuwait72 +1 70 +1 73 +1 87 ** 87 ** 88 ** 96 +1 94 +1 98 +1 96 +1 95 +1 96 +1 Lebanon... ... ... ... ... ... ... ... ... ... ... ... Libyan Arab Jamahiriya37 +1 36 +1 38 +1 30 29 31 41 +1 40 +1 42 +1 100 -1 100 -1 100 -1 Mauritania79 ** 80 ** 78 ** 52 54 50 87 88 85 47 47 47 Morocco50 ** 50 ** 50 ** 81 81 81 67 67 67 ... ... ... Oman64 65 64 99 +1 98 +1 100 +1 74 74 74 ... ... ... Palestinian Autonomous Territories67 ** 66 ** 68 ** 88 87 89 94 92 97 ... ... ... Qatar60 60 61 ... ... ... 61 61 61 ... ... ... Saudi Arabia... ... ... 25 **, +1 27 **, +1 24 **, +1 ... ... ... 65 +1 ... ... Sudan56 57 55 95 ** 98 ** 93 ** 99 100 97 ... ... ... Syrian Arab Republic97 96 97 99 99 99 99 99 100 ... ... ... Tunisia43 -1 44 -1 43 -1 83 83 83 99 -1 99 -1 99 -1 82 -1 82 -1 81 -1 United Arab Emirates… … … 30 35 24 50 54 46 ... ... ... YemenCentral and Eastern Europe... ... ... 87 ** 85 ** 89 ** ... ... ... ... ... ... Albania82 79 84 ... ... ... 83 80 85 ... ... ... Belarus... ... ... ... ... ... ... ... ... ... ... ... Bosnia and Herzegovina... ... ... 95 96 94 99 99 100 ... ... ... Bulgaria... ... ... 93 93 93 95 -1 95 -1 95 -1 ... ... ... Croatia... ... ... 78 ** 76 ** 80 ** ... ... ... ... ... ... Czech Republic81 -1 83 -1 79 -1 92 ** 91 ** 93 ** 95 -1 94 -1 96 -1 ... ... ... Estonia... ... ... 91 90 92 96 95 97 ... ... ... Hungary... ... ... 98 ** 99 ** 97 ** ... ... ... ... ... ... Latvia... ... ... 94 92 95 95 96 95 ... ... ... Lithuania... ... ... ... ... ... ... ... ... ... ... ... Montenegro... ... ... 99 98 99 96 -1 95 -1 96 -1 ... ... ... Poland76 * 78 * 74 * 93 ** 91 ** 94 ** 88 * 89 * 87 * ... ... ... Republic of Moldova... ... ... 86 86 86 91 91 92 ... ... ... Romania... ... ... ... ... ... ... ... ... ... ... ... Russian Federation... ... ... ... ... ... 98 * 97 * 98 * ... ... ... Serbia... ... ... ... ... ... ... ... ... ... ... ... Slovakia... ... ... 93 93 93 94 93 95 ... ... ... Slovenia... ... ... 99 100 97 91 -1 90 -1 91 -1 ... ... ... The former Yugoslav Rep. of Macedonia... ... ... 83 +1 86 +1 80 +1 86 86 85 ... ... ... Turkey78 78 * 78 * ... ... ... ... ... ... 64 ... ... UkraineCentral Asia54 -1 53 -1 55 -1 ... ... ... 88 -1 88 -1 89 -1 ... ... ... Armenia85 * 86 * 84 * 86 * 85 * 87 * 87 * 88 * 87 * 5 5 5 Azerbaijan109
T a b l e2 PRIMARY EDUCATION / ISCED 1 / New entrantsRegion Education system New entrants Gross intake ratio Net intake rateCountry or territoryPrimary education 2008 2008 1999Compulsoryeducation(age range)Entranceage Duration MF (000) % F MF M F GPI MF M F1 2 3 4 5 6 7 8 9 10 11 12Georgia 6-12 6 6 49 47 116 114 118 1.04 66 67 66Kazakhstan 7-17 7 4 236 +1 49 +1 106 +1 105 +1 106 +1 1.00 +1 66 **, +1 66 **, +1 **, +165Kyrgyzstan 7-15 7 4 99 49 96 97 96 0.99 58 * 59 * 58 *Mongolia 7-15 7 5 60 49 134 134 133 0.99 86 86 85Tajikistan 7-15 7 4 175 48 104 106 101 0.96 93 95 90Turkmenistan 7-15 7 3 ... ... ... ... ... ... ... ... ...Uzbekistan 7-17 7 4 494 48 93 94 91 0.97 ... ... ...East Asia and the PacificAustralia 5-15 5 7 ... ... ... ... ... ... ... ... ...Brunei Darussalam 6-14 6 6 7.3 49 103 102 105 1.03 ... ... ...Cambodia . 6 6 394 48 125 129 122 0.95 61 ** 62 ** 60 **China 6-14 7 5 17,411 46 96 94 98 1.03 ... ... ...Cook Islands 5-15 5 6 0.34 -1 49 -1 ... ... ... ... ... ... ...Democratic People’s Republic of Korea 6-16 6 4 ... ... ... ... ... ... ... ... ...Fiji 6-15 6 6 17 48 94 95 93 0.98 79 **, -1 80 **, -1 **, -179Hong Kong SAR of China 6-14 6 6 54 48 ... ... ... ... ... ... ...Indonesia 7-15 7 6 5,184 49 125 125 125 1.00 42 **, +1 43 **, +1 **, +141Japan 6-15 6 6 1,187 -1 49 -1 101 -1 102 -1 101 -1 1.00 -1 ... ... ...Kiribati 6-15 6 6 ... ... ... ... ... ... ... ... ...Lao People’s Democratic Republic 6-14 6 5 191 47 120 124 115 0.93 53 54 52Macao, China 5-14 6 6 ... ... ... ... ... ... 62 60 65Malaysia 6-11 6 6 525 -1 49 -1 98 -1 98 -1 98 -1 1.00 -1 ... ... ...Marshall Islands 6-14 6 6 1.6 -1 46 -1 100 *, -1 105 *, -1 96 *, -1 0.91 *, -1 ... ... ...Micronesia (Federated States of) 6-14 6 6 ... ... ... ... ... ... ... ... ...Myanmar 5-9 5 5 1,228 49 139 142 137 0.96 ... ... ...Nauru 6-16 6 6 0.18 *, -1 53 *, -1 71 **, -1 65 **, -1 77 **, -1 1.19 **, -1 ... ... ...New Zealand 5-16 5 6 ... ... ... ... ... ... ... ... ...Niue 5-16 5 6 ... ... ... ... ... ... 85 *, -1 ... ...Palau 6-17 6 5 ... ... ... ... ... ... ... ... ...Papua New Guinea 6-14 7 6 53 -2 45 -2 31 -2 33 -2 29 -2 0.87 -2 ... ... ...Philippines 6-12 6 6 2,759 47 135 139 130 0.94 45 ** 46 ** 44 **Republic of Korea 6-15 6 6 536 48 105 106 104 0.98 97 97 96Samoa 5-12 5 6 5.1 +1 48 +1 109 +1 110 +1 108 +1 0.98 +1 77 77 77Singapore 6-14 6 6 47 48 ... ... ... ... ... ... ...Solomon Islands … 6 6 ... ... ... ... ... ... ... ... ...Thailand 6-16 6 6 684 -1 52 -1 … … … … ... ... ...Timor-Leste 6-11 6 6 46 47 139 144 134 0.93 ... ... ...Tokelau . 5 6 ... ... ... ... ... ... ... ... ...Tonga 6-14 5 6 2.8 -2 48 -2 108 -2 108 -2 107 -2 0.99 -2 48 50 47Tuvalu 7-14 6 6 0.26 **, -2 45 **, -2 112 **, -2 120 **, -2 104 **, -2 0.86 **, -2 ... ... ...Vanuatu 6-12 6 6 6.6 -1 47 -1 110 -1 113 -1 107 -1 0.95 -1 ... ... ...Viet Nam 6-14 6 5 1,355 **, -2 ... ... ... ... ... 80 ... ...Latin America and the CaribbeanAnguilla 5-17 5 7 0.22 47 101 ** 90 ** 117 ** 1.30 ** 79 **, +1 ... ...Antigua and Barbuda 5-16 5 7 1.6 48 88 * 91 * 85 * 0.93 * ... ... ...Argentina 5-15 6 6 742 -1 49 -1 111 -1 111 -1 111 -1 1.00 -1 ... ... ...110
G l o b a l e d u c a t i o n d i g e s t 2 0 1 0 C o m p a r i n g e d u c a t i o n s t a t i s t i c s a r o u n d t h e w o r l dNet intake rateNet intake rate (adjusted)New entrantsto primary educationwith ECCE experience (%)2008 1999 2008 2008RegionMF M F MF M F MF M F MF M F13 14 15 16 17 18 19 20 21 22 23 2497 94 100 ... ... ... 97 95 100 ... ... ... GeorgiaCountry or territory55 57 53 91 **, +1 90 **, +1 93 **, +1 99 99 100 ... ... ... Kazakhstan57 58 56 91 * 90 * 91 * 89 89 89 15 14 15 Kyrgyzstan75 78 72 99 97 100 99 99 100 53 51 55 Mongolia98 100 96 96 100 93 98 100 96 1 -1 1 -1 1 -1 Tajikistan... ... ... ... ... ... ... ... ... ... ... ... Turkmenistan76 -2 ... ... ... ... ... 88 -1 90 -1 87 -1 ... ... ... Uzbekistan... ... ... 68 66 70 83 81 86 ... ... ... AustraliaEast Asia and the Pacific68 68 69 ... ... ... 85 83 87 ... ... ... Brunei Darussalam79 80 78 61 ** 62 ** 60 ** 79 80 78 20 19 21 Cambodia... ... ... ... ... ... ... ... ... 85 -1 ... ... China... ... ... 82 * 81 * 84 * ... ... ... ... ... ... Cook Islands... ... ... ... ... ... ... ... ... ... ... ... Democratic People’s Republic of Korea68 69 ** 67 ** 95 93 97 84 84 83 ... ... ... Fiji... ... ... ... ... ... ... ... ... ... ... ... Hong Kong SAR of China47 45 49 97 **, +1 100 **, +1 94 **, +1 99 100 97 47 46 47 Indonesia... ... ... 100 100 100 100 -1 100 -1 100 -1 ... ... ... Japan... ... ... 93 ** 93 ** 93 ** ... ... ... ... ... ... Kiribati69 70 69 65 67 64 79 80 79 15 14 15 Lao People’s Democratic Republic... ... ... 67 65 69 73 +1 72 +1 74 +1 ... ... ... Macao, China... ... ... 98 100 96 98 -1 98 -1 98 -1 ... ... ... Malaysia... ... ... ... ... ... 11 *, -1 11 *, -1 11 *, -1 ... ... ... Marshall Islands... ... ... ... ... ... ... ... ... ... ... ... Micronesia (Federated States of)... ... ... ... ... ... ... ... ... 13 11 15 Myanmar51 **, -1 50 **, -1 52 **, -1 ... ... ... 51 **, -1 50 **, -1 52 **, -1 ... ... ... Nauru... ... ... 93 93 93 98 98 98 ... ... ... New Zealand... ... ... 76 * 58 * 100 * ... ... ... ... ... ... Niue... ... ... 97 ** 100 ** 94 ** ... ... ... ... ... ... Palau... ... ... ... ... ... ... ... ... ... ... ... Papua New Guinea50 47 53 75 64 85 53 51 56 70 69 70 Philippines91 ** 91 ** 91 ** 98 99 98 92 92 92 ... ... ... Republic of Korea... ... ... 88 86 89 77 +1 76 +1 78 +1 ... ... ... Samoa... ... ... ... ... ... ... ... ... ... ... ... Singapore... ... ... ... ... ... 7 -1 7 -1 8 -1 ... ... ... Solomon Islands... ... ... ... ... ... 89 -1 90 -1 89 -1 ... ... ... Thailand50 52 49 ... ... ... 66 67 66 ... ... ... Timor-Leste... ... ... ... ... ... ... ... ... ... ... ... Tokelau... ... ... 49 51 47 46 -2 46 -2 46 -2 ... ... ... Tonga... ... ... ... ... ... ... ... ... ... ... ... Tuvalu38 -1 ... ... 63 63 63 ... ... ... 60 -1 63 -1 57 -1 Vanuatu... ... ... 87 ** ... ... ... ... ... ... ... ... Viet Nam89 ** 81 ** 100 ** 84 **, +1 73 **, +1 100 **, +1 89 ** 81 ** 100 ** 100 100 100 AnguillaLatin America and the Caribbean... ... ... ... ... ... ... ... ... ... ... ... Antigua and Barbuda99 -1 100 -1 97 -1 98 100 97 99 -1 100 -1 97 -1 ... ... ... Argentina111
T a b l e2 PRIMARY EDUCATION / ISCED 1 / New entrantsRegion Education system New entrants Gross intake ratio Net intake rateCountry or territoryPrimary education 2008 2008 1999Compulsoryeducation(age range)Entranceage Duration MF (000) % F MF M F GPI MF M F1 2 3 4 5 6 7 8 9 10 11 12Aruba 6-16 6 6 1.5 49 107 108 107 0.99 88 91 85Bahamas 5-16 5 6 6.4 48 112 114 109 0.96 84 85 82Barbados 5-16 5 6 3.8 * 48 * ... ... ... ... ... ... ...Belize 5-14 5 6 8.2 48 114 116 111 0.96 74 ** 76 ** 72 **Bermuda 5-16 5 6 0.79 -2 ... 103 *, -2 ... ... ... ... ... ...Bolivia 6-13 6 6 287 -1 49 -1 121 -1 121 -1 120 -1 1.00 -1 69 ** 68 ** 69 **Brazil 7-14 7 4 ... ... ... ... ... ... ... ... ...British Virgin Islands 5-16 5 7 0.46 -1 51 -1 105 **, -1 105 **, -1 105 **, -1 1.00 **, -1 73 ** 70 ** 76 **Cayman Islands 5-16 5 6 0.62 50 96 * 101 * 91 * 0.90 * 62 *, +1 56 *, +1 *, +168Chile 6-11 6 6 256 -1 49 -1 103 -1 103 -1 102 -1 0.98 -1 ... ... ...Colombia 5-15 6 5 1,106 48 125 127 124 0.98 62 ** 64 ** 61 **Costa Rica 6-15 6 6 76 49 95 95 95 1.00 ... ... ...Cuba 6-14 6 6 136 +1 49 +1 101 +1 100 +1 102 +1 1.02 +1 97 97 97Dominica 5-16 5 7 1.2 52 85 * 79 * 90 * 1.14 * 80 * 83 * 78 *Dominican Republic 5-14 6 6 220 46 105 110 98 0.89 56 56 56Ecuador 5-14 6 6 405 -1 49 -1 140 -1 141 -1 139 -1 0.99 -1 84 83 84El Salvador 7-15 7 6 161 48 121 123 119 0.97 34 **, -1 14 **, -1 **, -154Grenada 5-16 5 7 1.8 48 99 99 98 0.99 ... ... ...Guatemala 6-15 7 6 471 49 122 123 121 0.98 56 58 54Guyana 6-15 6 6 16 49 100 99 100 1.01 89 ** 87 ** 90 **Haiti 6-11 6 6 ... ... ... ... ... ... ... ... ...Honduras 6-13 6 6 230 48 124 126 122 0.96 49 +1 49 +1 49 +1Jamaica 6-12 6 6 48 **, -1 49 **, -1 88 **, -1 90 **, -1 86 **, -1 0.96 **, -1 79 **, +1 77 **, +1 **, +181Mexico 6-15 6 6 2,568 49 122 122 122 1.00 89 89 90Montserrat 5-16 5 7 0.07 -1 57 -1 99 *, -1 77 *, -1 125 *, -1 1.63 *, -1 ... ... ...Netherlands Antilles 6-15 6 6 ... ... ... ... ... ... 77 ** 72 ** 82 **Nicaragua 6-11 6 6 202 47 153 158 148 0.94 39 40 38Panama 6-14 6 6 73 48 107 109 106 0.98 84 ** 84 ** 84 **Paraguay 6-14 6 6 144 -1 48 -1 100 -1 102 -1 99 -1 0.97 -1 ... ... ...Peru 6-18 6 6 591 49 100 100 100 1.00 81 81 81Saint Kitts and Nevis 5-16 5 7 0.74 50 ... ... ... ... 82 *, +1 79 *, +1 *, +184Saint Lucia 5-15 5 7 2.6 48 91 94 88 0.94 71 ** 72 ** 70 **Saint Vincent and the Grenadines 5-15 5 7 2.0 50 102 102 102 1.00 ... ... ...Suriname 7-12 6 6 10 49 98 98 97 0.99 ... ... ...Trinidad and Tobago 6-12 5 7 17 49 96 97 96 1.00 67 67 68Turks and Caicos Islands 4-16 6 6 ... ... ... ... ... ... ... ... ...Uruguay 6-15 6 6 53 -1 49 -1 104 -1 104 -1 103 -1 0.99 -1 ... ... ...Venezuela 5-14 6 6 575 48 102 103 101 0.97 60 ** 60 ** 60 **North America and Western EuropeAndorra 6-16 6 6 0.76 48 87 * 88 * 87 * 0.98 * ... ... ...Austria 6-15 6 4 83 48 102 104 100 0.97 ... ... ...Belgium 6-18 6 6 112 49 98 97 98 1.02 ... ... ...Canada 6-16 6 6 351 -2 49 -2 98 -2 98 -2 98 -2 0.99 -2 ... ... ...Cyprus 6-15 6 6 9.1 48 106 * 109 * 103 * 0.95 * ... ... ...Denmark 7-16 7 6 67 -1 49 -1 99 -1 98 -1 99 -1 1.01 -1 86 +1 85 +1 88 +1Finland 7-16 7 6 57 48 99 100 98 0.98 ... ... ...112
G l o b a l e d u c a t i o n d i g e s t 2 0 1 0 C o m p a r i n g e d u c a t i o n s t a t i s t i c s a r o u n d t h e w o r l dNet intake rateNet intake rate (adjusted)New entrantsto primary educationwith ECCE experience (%)2008 1999 2008 2008RegionMF M F MF M F MF M F MF M F13 14 15 16 17 18 19 20 21 22 23 24... ... ... 96 100 92 100 99 100 ... ... ... Aruba68 66 69 87 87 86 71 70 73 56 55 57 Bahamas... ... ... ... ... ... ... ... ... 100 * 100 * 100 * Barbados65 67 64 100 ** 99 ** 100 ** 99 99 100 ... ... ... Belize... ... ... ... ... ... 93 **, -2 ... ... ... ... ... Bermuda66 -1 66 -1 66 -1 73 72 74 73 -1 73 -1 74 -1 66 -2 66 -2 66 -2 Bolivia... ... ... 79 ** ... ... 82 82 83 ... ... ... BrazilCountry or territory... ... ... 90 ** 81 ** 100 ** 97 **, -1 95 **, -1 98 **, -1 99 -2 ... ... British Virgin Islands84 **, -1 82 **, -1 87 **, -1 92 *, +1 83 *, +1 100 *, +1 91 **, -1 89 **, -1 93 **, -1 95 94 95 Cayman Islands... ... ... ... ... ... 89 -1 89 -1 90 -1 ... ... ... Chile64 64 63 79 ** 78 ** 80 ** 80 79 80 ... ... ... Colombia64 -1 63 -1 65 -1 ... ... ... ... ... ... 82 81 82 Costa Rica99 +1 99 +1 100 +1 99 99 99 100 +1 99 +1 100 +1 100 +1 100 +1 100 +1 Cuba54 * 48 * 60 * 97 * 100 * 93 * 72 * 64 * 80 * 82 81 82 Dominica56 57 55 65 64 67 72 71 72 55 54 55 Dominican Republic90 -1 90 -1 90 -1 96 95 97 100 -1 99 -1 100 -1 64 -1 63 -1 65 -1 Ecuador65 64 65 42 -1 18 -1 67 -1 73 72 75 74 66 84 El Salvador79 ** 81 ** 77 ** 53 **, +1 45 **, +1 62 **, +1 92 92 93 100 100 100 Grenada72 72 71 76 78 73 91 91 91 ... ... ... Guatemala62 -1 62 -1 62 -1 ... ... ... 95 95 96 100 -1 100 -1 100 -1 Guyana... ... ... ... ... ... ... ... ... ... ... ... Haiti63 61 64 88 +1 88 +1 88 +1 66 64 68 ... ... ... Honduras... ... ... 87 +1 83 +1 91 +1 79 -1 78 -1 79 -1 ... ... ... Jamaica95 95 95 99 98 100 100 99 100 ... ... ... Mexico48 *, -1 41 *, -1 56 *, -1 ... ... ... 76 *, -1 69 *, -1 84 *, -1 100 -1 100 -1 100 -1 Montserrat... ... ... 97 95 100 ... ... ... ... ... ... Netherlands Antilles67 66 67 81 80 82 77 75 78 45 45 46 Nicaragua... ... ... 87 87 88 84 84 84 77 77 78 Panama65 -1 64 -1 65 -1 77 76 78 70 -1 69 -1 71 -1 84 -1 83 -1 85 -1 Paraguay76 75 76 100 ** 100 ** 100 ** 88 87 88 63 63 63 Peru... ... ... 96 *, +1 92 *, +1 100 *, +1 ... ... ... 100 100 100 Saint Kitts and Nevis69 **, -2 68 **, -2 69 **, -2 93 ** 92 ** 95 ** 94 -2 93 -2 95 -2 49 -1 49 -1 50 -1 Saint Lucia... ... ... 96 **, +1 100 **, +1 93 **, +1 97 96 98 ... ... ... Saint Vincent and the Grenadines86 86 86 ... ... ... 87 87 87 100 100 100 Suriname67 67 67 91 90 92 85 85 85 79 78 80 Trinidad and Tobago... ... ... ... ... ... ... ... ... ... ... ... Turks and Caicos Islands... ... ... ... ... ... 66 -1 66 -1 66 -1 96 -2 96 -2 96 -2 Uruguay63 63 64 74 73 75 77 76 79 75 74 76 Venezuela44 ** 45 ** 42 ** ... ... ... 44 * 46 * 43 * 100 -1 100 -1 100 -1 Andorra... ... ... 94 ** 91 ** 97 ** ... ... ... ... ... ... Austria... ... ... 98 97 99 96 94 97 ... ... ... Belgium... ... ... 99 100 99 ... ... ... ... ... ... Canada... ... ... 97 * 97 * 97 * 98 * 98 * 97 * ... ... ... Cyprus... ... ... 90 +1 88 +1 93 +1 78 -1 72 -1 84 -1 ... ... ... Denmark... ... ... 100 100 99 95 95 95 ... ... ... FinlandNorth America and Western Europe113
T a b l e2 PRIMARY EDUCATION / ISCED 1 / New entrantsRegion Education system New entrants Gross intake ratio Net intake rateCountry or territoryPrimary education 2008 2008 1999Compulsoryeducation(age range)Entranceage Duration MF (000) % F MF M F GPI MF M F1 2 3 4 5 6 7 8 9 10 11 12France 6-16 6 5 ... ... ... ... ... ... ... ... ...Germany 6-18 6 4 753 48 99 100 99 0.99 ... ... ...Gibraltar 4-15 5 6 ... ... ... ... ... ... ... ... ...Greece 6-15 6 6 107 -1 49 -1 102 -1 102 -1 103 -1 1.00 -1 97 97 96Holy See . . . . . . . . . . . .Iceland 6-16 6 7 4.1 49 99 100 98 0.99 98 100 96Ireland 6-15 4 8 62 49 100 99 101 1.02 ... ... ...Israel 5-15 6 6 129 49 97 96 98 1.03 ... ... ...Italy 6-18 6 5 567 -1 48 -1 106 -1 106 -1 105 -1 0.99 -1 ... ... ...Liechtenstein 6-14 6 5 0.47 44 124 * 126 * 120 * 0.95 * ... ... ...Luxembourg 6-15 6 6 5.7 50 98 96 101 1.05 ... ... ...Malta 5-16 5 6 ... ... ... ... ... ... ... ... ...Monaco 6-16 6 5 ... ... ... ... ... ... ... ... ...Netherlands 5-17 6 6 202 49 101 101 101 1.00 99 +1 99 +1 98 +1Norway 6-16 6 7 58 49 98 97 99 1.01 ... ... ...Portugal 6-15 6 6 122 -1 48 -1 111 -1 113 -1 110 -1 0.98 -1 ... ... ...San Marino 6-16 6 5 0.33 48 ... ... ... ... ... ... ...Spain 6-16 6 6 440 49 105 105 106 1.01 ... ... ...Sweden 7-16 7 6 96 48 103 104 103 0.99 ... ... ...Switzerland 7-15 7 6 73 49 94 93 96 1.03 ... ... ...United Kingdom 5-16 5 6 ... ... ... ... ... ... ... ... ...United States of America 6-17 6 6 4,354 50 106 103 109 1.05 ... ... ...South and West AsiaAfghanistan 7-15 7 6 811 -1 39 -1 101 -1 119 -1 82 -1 0.69 -1 ... ... ...Bangladesh 6-10 6 5 3,468 * 50 * 100 * 99 * 100 * 1.02 * ... ... ...Bhutan . 6 7 16 +1 50 +1 113 +1 112 +1 114 +1 1.02 +1 20 ** 21 ** 19 **India 6-14 6 5 31,971 -1 46 -1 128 -1 132 -1 124 -1 0.94 -1 ... ... ...Iran (Islamic Republic of) 6-10 6 5 1,400 **, -2 56 **, -2 138 **, -2 118 **, -2 159 **, -2 1.35 **, -2 ... ... ...Maldives 6-12 6 7 5.6 49 106 106 106 1.00 87 ** 88 ** 86 **Nepal 5-10 5 5 1,078 +2 50 +2 ... ... ... ... ... ... ...Pakistan 5-9 5 5 4,671 45 106 114 98 0.86 ... ... ...Sri Lanka 5-14 5 5 330 49 98 97 98 1.01 90 **, -1 90 **, -1 **, -191Sub-Saharan AfricaAngola 6-14 6 6 ... ... ... ... ... ... 22 **, -1 24 **, -1 **, -119Benin 6-11 6 6 291 -2 46 -2 125 -2 132 -2 117 -2 0.89 -2 ... ... ...Botswana 6-15 6 7 49 -2 49 -2 115 -2 116 -2 113 -2 0.98 -2 23 21 25Burkina Faso 6-16 7 6 378 +1 47 +1 87 +1 90 +1 83 +1 0.93 +1 20 23 16Burundi … 7 6 289 49 144 148 140 0.95 28 +1 29 +1 26 +1Cameroon 6-11 6 6 603 46 119 127 110 0.87 ... ... ...Cape Verde 6-16 6 6 10 49 84 84 83 0.99 66 ** 65 ** 67 **Central African Republic 6-15 6 6 118 +1 44 +1 97 +1 110 +1 86 +1 0.78 +1 ... ... ...Chad 6-14 6 6 316 **, -1 43 **, -1 99 **, -1 114 **, -1 84 **, -1 0.74 **, -1 22 25 18Comoros 6-14 6 6 16 48 96 99 92 0.93 21 25 ** 17 **Congo 6-16 6 6 99 48 103 107 98 0.92 45 **, +1 47 **, +1 **, +143Côte d’Ivoire 6-15 6 6 419 46 75 81 69 0.85 27 30 24Democratic Republic of the Congo 6-15 6 6 2,328 55 116 105 128 1.21 22 21 23114
G l o b a l e d u c a t i o n d i g e s t 2 0 1 0 C o m p a r i n g e d u c a t i o n s t a t i s t i c s a r o u n d t h e w o r l dNet intake rateNet intake rate (adjusted)New entrantsto primary educationwith ECCE experience (%)2008 1999 2008 2008RegionMF M F MF M F MF M F MF M F13 14 15 16 17 18 19 20 21 22 23 24... ... ... 100 99 100 99 99 100 ... ... ... France... ... ... 94 ** 92 ** 95 ** 98 ** 97 ** 99 ** ... ... ... Germany... ... ... ... ... ... ... ... ... ... ... ... Gibraltar... ... ... 100 100 99 99 -1 99 -1 100 -1 ... ... ... Greece. . . . . . . . . . . . Holy See... ... ... 98 100 97 99 100 98 ... ... ... Iceland... ... ... 49 47 52 44 41 47 ... ... ... Ireland... ... ... 89 87 90 84 82 86 ... ... ... Israel... ... ... 100 100 100 100 -1 100 -1 99 -1 ... ... ... ItalyCountry or territory49 * 47 * 51 * ... ... ... 49 * 47 * 51 * ... ... ... Liechtenstein... ... ... 94 92 96 93 89 98 ... ... ... Luxembourg... ... ... 77 78 76 66 -1 65 -1 67 -1 ... ... ... Malta... ... ... ... ... ... 100 *, +1 100 *, +1 100 *, +1 ... ... ... Monaco... ... ... 99 +1 99 +1 98 +1 100 100 100 ... ... ... Netherlands... ... ... 99 100 99 98 97 99 ... ... ... Norway... ... ... ... ... ... 99 -1 98 -1 100 -1 ... ... ... Portugal... ... ... ... ... ... ... ... ... ... ... ... San Marino100 99 100 100 99 100 100 99 100 ... ... ... Spain99 100 99 98 99 96 99 100 99 ... ... ... Sweden... ... ... 100 99 100 100 100 100 ... ... ... Switzerland... ... ... 99 99 99 97 97 97 ... ... ... United Kingdom78 74 81 83 82 85 86 83 89 ... ... ... United States of AmericaSouth and West Asia57 -1 67 -1 46 -1 ... ... ... ... ... ... ... ... ... Afghanistan87 * 88 * 87 * ... ... ... 89 89 88 ... ... ... Bangladesh41 **, -2 42 **, -2 40 **, -2 23 24 22 51 -2 52 -2 49 -2 ... ... ... Bhutan... ... ... 93 *, +1 100 *, +1 85 *, +1 99 -1 100 -1 97 -1 ... ... ... India... ... ... 48 ** 49 ** 48 ** 94 **, -2 87 **, -2 100 **, -2 ... ... ... Iran (Islamic Republic of)78 ** 79 ** 77 ** 98 99 97 90 92 89 99 99 99 Maldives... ... ... 58 * 64 * 52 * ... ... ... 35 36 34 Nepal... ... ... ... ... ... 70 * 76 * 64 * ... ... ... Pakistan100 **, -1 100 **, -1 100 **, -1 ... ... ... 100 **, -1 100 **, -1 100 **, -1 ... ... ... Sri Lanka... ... ... 35 **, -1 37 **, -1 33 **, -1 ... ... ... ... ... ... Angola... ... ... ... ... ... 81 -2 84 -2 77 -2 ... ... ... Benin... ... ... 25 23 27 40 -2 38 -2 42 -2 ... ... ... BotswanaSub-Saharan Africa35 +1 36 +1 34 +1 29 33 25 68 +1 70 +1 65 +1 5 -1 5 -1 5 -1 Burkina Faso59 -1 60 -1 58 -1 39 +1 42 +1 35 +1 93 -1 93 -1 93 -1 1 -2 1 -2 1 -2 Burundi... ... ... ... ... ... 88 93 83 ... ... ... Cameroon73 72 73 71 ** 70 ** 72 ** 74 73 74 87 85 88 Cape Verde... ... ... ... ... ... 52 +1 58 +1 47 +1 ... ... ... Central African Republic... ... ... 33 38 27 ... ... ... ... ... ... Chad... ... ... 30 31 29 ... ... ... ... ... ... Comoros58 -2 59 -2 58 -2 ... ... ... 65 -2 65 -2 64 -2 ... ... ... Congo... ... ... 51 56 45 ... ... ... ... ... ... Côte d’Ivoire42 -1 45 -1 38 -1 27 28 26 ... ... ... ... ... ... Democratic Republic of the Congo115
T a b l e2 PRIMARY EDUCATION / ISCED 1 / New entrantsRegion Education system New entrants Gross intake ratio Net intake rateCountry or territoryPrimary education 2008 2008 1999Compulsoryeducation(age range)Entranceage Duration MF (000) % F MF M F GPI MF M F1 2 3 4 5 6 7 8 9 10 11 12Equatorial Guinea 7-11 7 5 15 -1 49 -1 90 -1 92 -1 88 -1 0.96 -1 ... ... ...Eritrea 7-14 7 5 52 45 40 44 37 0.84 17 18 16Ethiopia . 7 6 3,497 47 153 162 144 0.89 21 24 19Gabon 6-16 6 6 ... ... ... ... ... ... ... ... ...Gambia 7-12 7 6 43 51 93 91 96 1.06 ... ... ...Ghana 6-15 6 6 684 49 115 113 116 1.02 30 ** 30 ** 30 **Guinea 7-16 7 6 249 46 92 97 87 0.90 19 21 18Guinea-Bissau 7-12 7 6 ... ... ... ... ... ... 11 **, +1 12 **, +1 **, +110Kenya 6-13 6 6 ... ... ... ... ... ... 28 ** 27 ** 29 **Lesotho … 6 7 53 -1 48 -1 97 -1 101 -1 94 -1 0.94 -1 26 25 27Liberia 6-16 6 6 119 47 112 117 107 0.92 ... ... ...Madagascar 6-10 6 5 1,033 49 186 188 185 0.98 ... ... ...Malawi 6-13 6 6 666 51 141 137 144 1.05 ... ... ...Mali 7-15 7 6 344 +1 46 +1 96 +1 102 +1 89 +1 0.87 +1 ... ... ...Mauritius 5-16 5 6 19 +1 49 +1 99 +1 99 +1 99 +1 1.00 +1 71 70 72Mozambique 6-12 6 7 1,098 48 160 165 155 0.94 18 19 17Namibia 7-16 7 7 53 50 101 101 101 1.00 61 59 63Niger … 7 6 411 +1 45 +1 90 +1 97 +1 83 +1 0.85 +1 27 32 21Nigeria 6-14 6 6 ... ... ... ... ... ... ... ... ...Rwanda 7-12 7 6 560 50 210 213 207 0.97 ... ... ...Sao Tome and Principe 7-13 7 6 5.8 +1 ... 132 +1 ... ... ... ... ... ...Senegal 7-12 7 6 337 51 99 97 102 1.05 37 38 ** 36 **Seychelles 6-15 6 6 1.4 +1 48 +1 127 * 127 * 126 * 1.00 * 75 * 74 * 77 *Sierra Leone 6-11 6 6 296 -1 48 -1 192 -1 201 -1 182 -1 0.91 -1 ... ... ...Somalia … 6 6 ... ... ... ... ... ... ... ... ...South Africa 7-15 7 7 1,092 **, -1 48 **, -1 108 **, -1 112 **, -1 104 **, -1 0.93 **, -1 44 45 43Swaziland … 6 7 31 -1 49 -1 103 -1 105 -1 101 -1 0.96 -1 40 38 41Togo 6-15 6 6 185 +1 64 +1 105 +1 76 +1 134 +1 1.78 +1 39 42 37Uganda 6-12 6 7 1,662 50 ** 159 158 ** 160 ** 1.01 ** ... ... ...United Republic of Tanzania 7-13 7 7 1,267 **, -1 49 **, -1 106 **, -1 107 **, -1 105 **, -1 0.99 **, -1 14 13 15Zambia 7-13 7 7 479 51 125 122 127 1.04 38 37 39Zimbabwe 6-12 6 7 ... ... ... ... ... ... 43 +1 42 +1 44 +1REGIONAL AVERAGESWORLD … … … 137,071 ** 48 ** 112 ** 114 ** 110 ** 0.97 ** … … …Arab States … … … 7,431 ** 48 ** 99 ** 101 ** 97 ** 0.96 ** … … …Central and Eastern Europe … … … 4,321 48 ** 100 100 ** 99 ** 0.99 ** … … …Central Asia … … … 1,392 48 104 105 103 0.98 … … …East Asia and the Pacific … … … 32,411 # 47 # 103 # 102 # 104 # 1.02 # … … …Latin America and the Caribbean … … … 13,330 ** 48 ** 121 ** 123 ** 119 ** 0.97 ** … … …North America and Western Europe … … … 9,118 ** 49 ** 103 ** 102 ** 105 ** 1.02 ** … … …South and West Asia … … … 43,750 # 47 # 122 # 126 # 118 # 0.94 # … … …Sub-Saharan Africa … … … 25,318 ** 48 ** 116 ** 119 ** 112 ** 0.94 ** … … …Please refer to the Reader’s Guide for more information on the data and symbols used in each table.116
G l o b a l e d u c a t i o n d i g e s t 2 0 1 0 C o m p a r i n g e d u c a t i o n s t a t i s t i c s a r o u n d t h e w o r l dNet intake rateNet intake rate (adjusted)New entrantsto primary educationwith ECCE experience (%)2008 1999 2008 2008RegionMF M F MF M F MF M F MF M F13 14 15 16 17 18 19 20 21 22 23 24Country or territory30 -1 30 -1 29 -1 79 **, +1 ... ... ... ... ... ... ... ... Equatorial Guinea16 17 15 22 23 21 31 33 29 50 48 52 Eritrea77 80 74 24 26 21 83 86 80 6 6 6 Ethiopia... ... ... ... ... ... ... ... ... ... ... ... Gabon51 **, -1 50 **, -1 53 **, -1 65 67 64 60 -1 58 -1 62 -1 ... ... ... Gambia40 ** 39 ** 41 ** 40 ** 39 ** 41 ** 49 48 50 ... ... ... Ghana42 44 41 29 31 27 56 58 54 20 19 21 Guinea... ... ... 40 +1 46 +1 35 +1 ... ... ... ... ... ... Guinea-Bissau... ... ... 33 32 34 40 38 41 ... ... ... Kenya49 -1 49 -1 49 -1 26 26 27 57 -1 57 -1 58 -1 ... ... ... Lesotho... ... ... 15 17 12 ... ... ... ... ... ... Liberia86 86 87 59 64 55 99 97 100 ... ... ... Madagascar71 ** 68 ** 73 ** 74 73 76 84 80 87 ... ... ... Malawi26 +1 28 +1 23 +1 40 ** 45 ** 34 ** 77 +1 82 +1 72 +1 15 +1 15 +1 16 +1 Mali83 +1 83 +1 84 +1 71 70 72 83 +1 83 +1 84 +1 92 +1 92 +1 92 +1 Mauritius59 ** 60 ** 59 ** 25 25 24 64 64 63 ... ... ... Mozambique57 ** 55 ** 59 ** 80 78 83 77 76 78 ... ... ... Namibia60 +1 66 +1 54 +1 33 38 27 73 +1 79 +1 67 +1 13 +1 12 +1 14 +1 Niger... ... ... 37 ** 37 ** 38 ** 38 **, -1 36 **, -1 40 **, -1 ... ... ... Nigeria97 -2 98 -2 97 -2 ... ... ... 99 ** 100 ** 98 ** ... ... ... Rwanda46 47 45 86 88 84 99 100 99 42 -1 42 -1 43 -1 Sao Tome and Principe56 -1 54 -1 57 -1 54 ** 56 ** 52 ** 79 -1 77 -1 80 -1 ... ... ... Senegal93 * 92 * 94 * 76 * 75 * 77 * 93 * 92 * 94 * ... ... ... Seychelles... ... ... ... ... ... ... ... ... ... ... ... Sierra Leone... ... ... ... ... ... ... ... ... ... ... ... Somalia... ... ... 98 96 100 88 **, -1 88 **, -1 89 **, -1 ... ... ... South Africa48 -1 47 -1 50 -1 47 45 49 76 -1 78 -1 75 -1 ... ... ... Swaziland47 -1 49 -1 46 -1 68 72 63 76 -1 78 -1 74 -1 ... ... ... Togo71 ** 69 ** 74 ** ... ... ... 81 79 83 ... ... ... Uganda87 **, -1 87 **, -1 88 **, -1 15 14 16 ... ... ... ... ... ... United Republic of Tanzania52 ** 50 ** 54 ** 47 45 49 63 60 66 17 -1 16 -1 17 -1 Zambia... ... ... 49 +1 47 +1 50 +1 60 -2 58 -2 62 -2 ... ... ... ZimbabweREGIONAL AVERAGES… … … 81 ** 83 ** 79 ** 83 ** 84 ** 83 ** … … … World… … … 68 70 66 74 ** 75 ** 72 ** … … … Arab States… … … 86 # 87 # 86 # 88 ** 88 ** 89 ** … … … Central and Eastern Europe… … … 91 # 91 # 90 # 92 93 91 … … … Central Asia… … … 92 # 91 # 93 # 87 # 86 # 88 # … … … East Asia and the Pacific… … … 85 84 ** 86 ** 85 85 ** 86 ** … … … Latin America and the Caribbean… … … 91 90 92 92 90 94 … … … North America and Western Europe… … … 86 # 92 # 79 # 93 # 94 # 90 # … … … South and West Asia… … … 43 44 42 60 ** 60 ** 60 ** … … … Sub-Saharan Africa117
T a b l e3 PRIMARY EDUCATION / ISCED 1 / Enrolment and teaching staffRegion Enrolment Gross enrolment ratio2008 1999 2008Country or territoryArab StatesMF (000) % F % Private MF M F GPI MF M F GPI1 2 3 4 5 6 7 8 9 10 11Algeria 3,942 47 - 105 110 100 0.91 108 111 104 0.94Bahrain 86 49 28 107 107 108 1.01 105 106 104 0.98Djibouti 56 47 14 33 39 28 0.71 46 49 43 0.88Egypt 9,988 -1 48 -1 8 -1 93 ** 97 ** 89 ** 0.92 ** 100 -1 102 -1 97 -1 0.95 -1Iraq ... ... ... 96 104 86 0.83 ... ... ... ...Jordan 817 49 33 98 98 98 1.00 97 97 97 1.01Kuwait 209 49 38 100 99 101 1.01 95 96 95 0.98Lebanon 464 +1 49 +1 71 +1 110 ** 113 ** 108 ** 0.96 ** 103 +1 104 +1 102 +1 0.98 +1Libyan Arab Jamahiriya 755 -2 48 -2 5 -2 120 121 118 0.98 110 -2 113 -2 108 -2 0.95 -2Mauritania 513 +1 50 +1 9 +1 86 86 86 1.00 104 +1 101 +1 108 +1 1.08 +1Morocco 3,879 47 9 86 95 77 0.81 107 112 102 0.91Oman 271 49 7 91 93 90 0.97 75 74 75 1.01Palestinian Autonomous Territories 390 49 11 105 105 106 1.01 80 80 79 1.00Qatar 78 49 50 101 103 98 0.96 109 109 108 0.99Saudi Arabia 3,211 49 8 ... ... ... ... 98 100 96 0.96Sudan 4,744 +1 46 +1 4 +1 47 ** 50 ** 43 ** 0.85 ** 74 +1 78 +1 70 +1 0.90 +1Syrian Arab Republic 2,356 48 4 102 107 98 0.92 124 127 122 0.96Tunisia 1,036 48 2 116 119 113 0.95 107 108 106 0.98United Arab Emirates 284 -1 49 -1 67 -1 90 91 88 0.97 108 -1 108 -1 108 -1 1.00 -1Yemen 3,282 44 3 71 91 51 0.56 85 94 76 0.80Central and Eastern EuropeAlbania ... ... ... 110 110 109 0.99 ... ... ... ...Belarus 362 49 - 111 111 110 0.99 99 98 100 1.02Bosnia and Herzegovina 182 49 ... ... ... ... ... 109 109 110 1.01Bulgaria 263 49 1 107 108 105 0.98 101 101 101 1.00Croatia 191 -1 49 -1 - -1 93 93 92 0.99 99 -1 99 -1 98 -1 1.00 -1Czech Republic 460 48 1 103 104 103 0.99 103 103 103 0.99Estonia 75 48 3 102 103 100 0.97 100 101 99 0.99Hungary 394 48 8 102 103 101 0.98 99 100 98 0.99Latvia 117 48 1 100 101 99 0.98 98 100 96 0.96Lithuania 136 48 1 102 103 101 0.98 96 97 95 0.98Montenegro ... ... ... ... ... ... ... ... ... ... ...Poland 2,485 -1 49 -1 2 -1 98 99 97 0.98 97 -1 97 -1 97 -1 1.00 -1Republic of Moldova 152 48 1 100 * 100 * 100 * 1.00 * 94 * 95 * 93 * 0.98 *Romania 865 48 - 105 106 104 0.98 100 100 99 0.99Russian Federation 4,969 49 1 108 109 107 0.99 97 97 97 1.00Serbia 290 49 - 112 ** 112 ** 111 ** 0.99 ** 98 * 98 * 98 * 1.00 *Slovakia 225 49 6 102 103 101 0.99 103 103 102 0.99Slovenia 107 48 - 100 100 99 0.99 97 98 97 0.99The former Yugoslav Rep. of Macedonia 101 -1 48 -1 . -1 101 102 100 0.98 93 -1 93 -1 93 -1 1.00 -1Turkey 6,760 48 ... 99 103 94 0.92 99 101 98 0.97Ukraine 1,573 49 * 1 109 110 109 0.99 98 98 * 99 * 1.00 *Central AsiaArmenia 122 47 2 100 ... ... ... 105 104 106 1.02Azerbaijan 497 47 - 98 * 98 * 98 * 1.00 * 116 * 117 * 115 * 0.99 *118
G l o b a l e d u c a t i o n d i g e s t 2 0 1 0 C o m p a r i n g e d u c a t i o n s t a t i s t i c s a r o u n d t h e w o r l dNet enrolment rate (adjusted)Teaching staffTrainedteachers (%)Pupil/teacherratio1999 2008 2008 20082008MF M F GPI MF M F GPI MF (000) % F MF M F12 13 14 15 16 17 18 19 20 21 22 23 24 2592 94 90 0.96 96 96 95 0.99 170 53 99 -1 ... ... 23 Algeria99 97 100 1.03 99 100 99 0.99 ... ... ... ... ... ... BahrainRegionCountry or territoryArab States28 32 23 0.73 48 51 44 0.86 1.7 26 80 81 78 34 Djibouti88 ** 91 ** 85 ** 0.93 ** 95 **, -1 97 **, -1 93 **, -1 0.96 **, -1 369 **, -1 56 **, -1 ... ... ... 27 **, -1 Egypt88 94 81 0.86 ... ... ... ... ... ... ... ... ... ... Iraq95 94 95 1.00 94 93 94 1.01 ... ... ... ... ... ... Jordan93 93 93 1.01 93 94 93 0.98 23 89 100 100 100 9 Kuwait93 ** 94 ** 91 ** 0.97 ** 91 +1 92 +1 90 +1 0.99 +1 33 +1 86 +1 13 +1 16 +1 13 +1 14 +1 Lebanon... ... ... ... ... ... ... ... ... ... ... ... ... ... Libyan Arab Jamahiriya62 62 62 0.99 77 +1 74 +1 79 +1 1.06 +1 13 +1 37 +1 100 +1 100 +1 100 +1 39 +1 Mauritania71 76 65 0.85 90 92 88 0.95 146 49 100 100 100 27 Morocco83 83 83 1.00 72 71 73 1.03 23 ** 64 ** 100 **, -2 100 **, -2 100 **, -2 12 ** Oman99 99 99 1.01 77 77 78 1.00 13 67 100 100 100 29 Palestinian Autonomous Territories95 95 95 1.00 ... ... ... ... 6.2 85 52 42 54 13 Qatar... ... ... ... 85 85 84 0.99 299 * 51 * 91 *, -1 97 *, -1 87 *, -1 11 * Saudi Arabia42 **, +1 46 **, +1 38 **, +1 0.83 **, +1 ... ... ... ... 124 **, +1 61 **, +1 60 **, +1 64 **, +1 57 **, +1 38 **, +1 Sudan95 ** 98 ** 91 ** 0.93 ** ... ... ... ... 132 ** 66 ** ... ... ... 18 ** Syrian Arab Republic96 97 95 0.98 100 ... ... ... 60 54 ... ... ... 17 Tunisia81 82 81 0.99 99 -1 99 -1 99 -1 1.00 -1 17 -1 85 -1 100 -1 100 -1 100 -1 17 -1 United Arab Emirates56 70 42 0.59 73 80 66 0.83 ... ... ... ... ... ... Yemen100 ** ... ... ... ... ... ... ... ... ... ... ... ... ... Albania... ... ... ... 95 94 96 1.02 24 99 100 ... ... 15 BelarusCentral and Eastern Europe... ... ... ... ... ... ... ... ... ... ... ... ... ... Bosnia and Herzegovina99 99 98 0.99 97 97 98 1.00 16 93 ... ... ... 16 Bulgaria92 92 92 0.99 99 -1 98 -1 100 -1 1.02 -1 11 -1 91 -1 ... ... ... 17 -1 Croatia96 ** 96 ** 97 ** 1.00 ** 90 **, -2 88 **, -2 91 **, -2 1.03 **, -2 25 98 ... ... ... 18 Czech Republic100 ** 100 ** 100 ** 1.00 ** 97 96 97 1.00 6.1 94 ... ... ... 12 Estonia97 97 97 1.00 95 95 95 1.00 38 96 ... ... ... 10 Hungary99 ** 99 ** 98 ** 1.00 ** ... ... ... ... 11 93 ... ... ... 11 Latvia98 98 98 1.00 96 96 96 0.99 10 97 ... ... ... 13 Lithuania... ... ... ... ... ... ... ... ... ... ... ... ... ... Montenegro96 96 96 1.00 96 -1 95 -1 96 -1 1.01 -1 234 -1 84 -1 ... ... ... 11 -1 Poland96 ** ... ... ... 90 * 91 * 90 * 0.99 * 9.6 97 ... ... ... 16 Republic of Moldova100 ... ... ... 97 96 97 1.00 55 86 ... ... ... 16 Romania... ... ... ... ... ... ... ... 285 98 ... ... ... 17 Russian Federation... ... ... ... 96 * 96 * 96 * 1.00 * 17 84 100 -1 100 -1 100 -1 17 Serbia... ... ... ... ... ... ... ... 14 89 ... ... ... 17 Slovakia98 98 98 0.99 97 98 97 1.00 6.2 98 ... ... ... 17 Slovenia99 100 98 0.98 92 -1 91 -1 92 -1 1.01 -1 5.5 -1 72 -1 ... ... ... 18 -1 The former Yugoslav Rep. of Macedonia92 +1 96 +1 88 +1 0.92 +1 95 96 94 0.98 ... ... ... ... ... ... Turkey... ... ... ... 89 89 * 90 * 1.00 * 99 99 100 ... ... 16 UkraineCentral Asia... ... ... ... 93 -1 92 -1 94 -1 1.03 -1 6.6 -1 100 -1 ... ... ... 19 -1 Armenia89 * 88 * 89 * 1.01 * 96 * 97 * 95 * 0.98 * 44 87 100 100 100 11 Azerbaijan119
T a b l e3 PRIMARY EDUCATION / ISCED 1 / Enrolment and teaching staffRegion Enrolment Gross enrolment ratioCountry or territory2008 1999 2008MF (000) % F % Private MF M F GPI MF M F GPI1 2 3 4 5 6 7 8 9 10 11Georgia 311 47 7 95 96 94 0.98 107 109 106 0.98Kazakhstan 951 +1 49 +1 1 +1 97 97 98 1.01 108 +1 108 +1 109 +1 1.00 +1Kyrgyzstan 400 49 1 98 98 97 0.99 95 95 94 0.99Mongolia 240 49 5 102 101 103 1.02 102 102 101 0.99Tajikistan 692 48 . 98 101 96 0.95 102 104 100 0.96Turkmenistan ... ... ... ... ... ... ... ... ... ... ...Uzbekistan 2,071 49 . 99 99 99 1.00 93 94 92 0.98East Asia and the PacificAustralia 1,978 49 30 100 100 100 1.00 106 106 105 1.00Brunei Darussalam 45 48 37 114 115 112 0.97 107 107 107 1.00Cambodia 2,341 47 1 97 104 90 0.87 116 120 112 0.94China 105,951 46 4 ... ... ... ... 113 111 116 1.04Cook Islands 2.0 -1 47 -1 21 -1 96 * 99 * 94 * 0.95 * ... ... ... ...Democratic People’s Republic of Korea ... ... ... ... ... ... ... ... ... ... ...Fiji 103 48 99 109 109 108 0.99 94 95 94 0.99Hong Kong SAR of China 390 48 14 100 101 98 0.96 ... ... ... ...Indonesia 29,498 48 16 113 **, +1 115 **, +1 111 **, +1 0.97 **, +1 119 121 118 0.97Japan 7,166 49 1 101 101 100 1.00 102 102 102 1.00Kiribati 16 50 ... 104 * 104 * 105 * 1.01 * ... ... ... ...Lao People’s Democratic Republic 901 47 3 113 122 104 0.85 112 117 106 0.91Macao, China 27 +1 47 +1 97 +1 100 102 97 0.96 100 +1 102 +1 97 +1 0.95 +1Malaysia 3,104 -1 49 -1 1 -1 98 99 97 0.98 97 -1 97 -1 96 -1 1.00 -1Marshall Islands 8.2 -1 48 -1 ... 101 ** 102 ** 100 ** 0.98 ** 93 *, -1 94 *, -1 92 *, -1 *, -10.97Micronesia (Federated States of) 19 -1 49 -1 8 **, -1 ... ... ... ... 110 -1 110 -1 111 -1 1.01 -1Myanmar 5,110 50 . 100 101 99 0.98 117 117 117 0.99Nauru 1.3 50 ... 81 **, -1 80 **, -1 82 **, -1 1.04 **, -1 82 ** 80 ** 84 ** 1.06 **New Zealand 348 49 12 99 99 100 1.00 101 101 101 1.00Niue ... ... ... 99 * 99 * 98 * 1.00 * ... ... ... ...Palau 1.5 -1 48 **, -1 23 -1 114 * 118 * 109 * 0.93 * 99 *, -1 98 **, -1 100 **, -1 **, -11.02Papua New Guinea 532 -2 44 -2 ... 69 +1 74 +1 63 +1 0.86 +1 55 -2 59 -2 50 -2 0.84 -2Philippines 13,411 48 8 110 110 110 1.00 110 111 109 0.98Republic of Korea 3,680 48 1 100 100 99 1.00 105 106 104 0.98Samoa 30 +1 48 +1 ... 98 99 97 0.98 100 +1 101 +1 99 +1 0.98 +1Singapore 300 48 7 ... ... ... ... ... ... ... ...Solomon Islands 83 -1 47 -1 18 -1 88 91 86 0.94 107 -1 109 -1 106 -1 0.97 -1Thailand 5,371 +1 48 +1 18 +1 94 95 93 0.97 91 +1 92 +1 90 +1 0.98 +1Timor-Leste 201 47 13 ... ... ... ... 107 110 103 0.94Tokelau ... ... ... 101 **, +1 93 **, +1 111 **, +1 1.19 **, +1 ... ... ... ...Tonga 17 -2 47 -2 ... 108 111 106 0.96 112 -2 113 -2 110 -2 0.97 -2Tuvalu 1.5 -2 48 -2 ... 98 * 97 * 99 * 1.02 * 106 *, -2 106 *, -2 105 *, -2 *, -20.99Vanuatu 38 -1 47 -1 26 -1 111 112 110 0.98 109 -1 111 -1 106 -1 0.96 -1Viet Nam 6,872 46 1 108 112 104 0.93 ... ... ... ...Latin America and the CaribbeanAnguilla 1.6 49 9 111 **, +1 109 **, +1 113 **, +1 1.04 **, +1 94 ** 94 ** 94 ** 1.00 **Antigua and Barbuda 12 48 52 ... ... ... ... 100 * 105 * 96 * 0.92 *Argentina 4,700 -1 49 -1 23 -1 114 115 114 0.99 116 -1 116 -1 115 -1 0.99 -1120
G l o b a l e d u c a t i o n d i g e s t 2 0 1 0 C o m p a r i n g e d u c a t i o n s t a t i s t i c s a r o u n d t h e w o r l dNet enrolment rate (adjusted)Teaching staffTrainedteachers (%)Pupil/teacherratio1999 2008 2008 20082008MF M F GPI MF M F GPI MF (000) % F MF M F12 13 14 15 16 17 18 19 20 21 22 23 24 25... ... ... ... 99 ... ... ... 36 85 95 95 95 9 GeorgiaRegionCountry or territory95 **, +1 94 **, +1 96 **, +1 1.02 **, +1 99 99 100 1.01 58 +1 98 +1 ... ... ... 16 +1 Kazakhstan94 * 94 * 94 * 1.00 * 91 91 91 1.00 17 98 64 64 64 24 Kyrgyzstan96 94 97 1.03 99 99 99 1.00 7.7 95 99 98 99 31 Mongolia97 +1 ... ... ... 98 99 96 0.96 31 68 88 ... ... 23 Tajikistan... ... ... ... ... ... ... ... ... ... ... ... ... ... Turkmenistan... ... ... ... 91 92 90 0.98 118 85 100 100 100 18 Uzbekistan94 94 95 1.01 97 97 98 1.01 ... ... ... ... ... ... AustraliaEast Asia and the Pacific... ... ... ... 97 97 97 1.00 3.6 75 84 92 81 13 Brunei Darussalam83 ** 87 ** 79 ** 0.91 ** 89 90 87 0.96 48 44 98 ... ... 49 Cambodia... ... ... ... ... ... ... ... 6,036 56 ... ... ... 18 China86 * 88 * 85 * 0.96 * ... ... ... ... 0.13 -1 77 -1 79 -1 79 -1 79 -1 16 -1 Cook Islands... ... ... ... ... ... ... ... ... ... ... ... ... ... Democratic People’s Republic of Korea99 98 99 1.01 89 90 89 0.99 3.9 55 98 98 98 26 Fiji... ... ... ... ... ... ... ... 24 78 95 94 95 17 Hong Kong SAR of China98 **, +1 ... ... ... 99 ... ... ... 1,687 59 ... ... ... 17 Indonesia100 ... ... ... 100 ... ... ... 392 ... ... ... ... 18 Japan99 ** ... ... ... ... ... ... ... 0.65 82 85 83 86 25 Kiribati78 81 74 0.92 82 84 81 0.96 30 49 97 97 97 30 Lao People’s Democratic Republic85 84 85 1.01 87 +1 88 +1 87 +1 0.99 +1 1.6 +1 88 +1 86 +1 73 +1 88 +1 17 +1 Macao, China98 99 97 0.98 96 -1 96 -1 96 -1 1.00 -1 206 -1 68 -1 ... ... ... 15 -1 Malaysia... ... ... ... 67 *, -1 67 *, -1 66 *, -1 0.99 *, -1 ... ... ... ... ... ... Marshall Islands... ... ... ... ... ... ... ... 1.1 **, -1 ... ... ... ... 17 **, -1 Micronesia (Federated States of)... ... ... ... ... ... ... ... 177 84 99 100 99 29 Myanmar... ... ... ... 72 **, -1 72 **, -1 73 **, -1 1.01 **, -1 0.06 93 74 -1 50 -1 77 -1 22 Nauru99 99 99 1.00 99 99 100 1.01 23 84 ... ... ... 15 New Zealand99 * 99 * 98 * 1.00 * ... ... ... ... ... ... ... ... ... ... Niue97 ** 99 ** 94 ** 0.94 ** ... ... ... ... ... ... ... ... ... ... Palau... ... ... ... ... ... ... ... 15 **, -2 43 **, -2 ... ... ... 36 **, -2 Papua New Guinea90 90 90 1.00 92 91 93 1.02 390 -1 87 -1 ... ... ... 34 -1 Philippines98 98 98 1.00 99 100 98 0.98 153 77 ... ... ... 24 Republic of Korea94 94 94 0.99 94 +1 94 +1 94 +1 1.00 +1 0.94 +1 ... ... ... ... 32 +1 Samoa... ... ... ... ... ... ... ... 16 81 97 97 97 19 Singapore... ... ... ... 67 -1 67 -1 67 -1 1.00 -1 ... ... ... ... ... ... Solomon Islands... ... ... ... 90 +1 91 +1 89 +1 0.99 +1 348 60 ... ... ... 16 Thailand... ... ... ... 77 79 76 0.96 4.9 33 ... ... ... 41 Timor-Leste... ... ... ... ... ... ... ... ... ... ... ... ... ... Tokelau88 90 86 0.95 99 -2 ... ... ... 0.76 -2 ... ... ... ... 22 -2 Tonga... ... ... ... ... ... ... ... ... ... ... ... ... ... Tuvalu92 92 91 0.99 ... ... ... ... 1.6 -1 55 -1 100 -1 ... ... 24 -1 Vanuatu96 ... ... ... ... ... ... ... 345 77 99 94 100 20 Viet Nam... ... ... ... 93 ** 93 ** 93 ** 1.00 ** 0.11 90 58 36 60 14 AnguillaLatin America and the Caribbean... ... ... ... 89 * 91 * 87 * 0.95 * 0.68 93 53 52 53 17 Antigua and Barbuda... ... ... ... ... ... ... ... 303 -1 87 -1 ... ... ... 16 -1 Argentina121
T a b l e3 PRIMARY EDUCATION / ISCED 1 / Enrolment and teaching staffRegion Enrolment Gross enrolment ratioCountry or territory2008 1999 2008MF (000) % F % Private MF M F GPI MF M F GPI1 2 3 4 5 6 7 8 9 10 11Aruba 10 49 77 114 116 112 0.97 114 116 112 0.96Bahamas 37 49 30 95 96 94 0.98 103 103 103 1.00Barbados 23 * 49 * 11 * ... ... ... ... ... ... ... ...Belize 52 49 95 111 113 109 0.97 120 122 119 0.97Bermuda 4.7 -2 46 -2 35 -2 ... ... ... ... 100 *, -2 108 *, -2 92 *, -2 *, -20.85Bolivia 1,512 -1 49 -1 8 -1 113 114 112 0.98 108 -1 108 -1 108 -1 1.00 -1Brazil 17,812 47 12 155 159 150 0.94 127 132 123 0.93British Virgin Islands 3.0 -1 49 -1 28 -1 112 * 113 * 110 * 0.97 * 108 **, -1 110 **, -1 105 **, -1 **, -10.96Cayman Islands 3.7 48 36 108 *, +1 109 *, +1 106 *, +1 0.97 *, +1 93 * 102 * 85 * 0.84 *Chile 1,679 -1 48 -1 55 -1 101 102 99 0.97 106 -1 108 -1 103 -1 0.95 -1Colombia 5,286 49 20 119 119 119 1.00 120 120 120 0.99Costa Rica 535 48 8 108 109 107 0.98 110 110 109 0.99Cuba 868 +1 48 +1 . +1 111 113 109 0.97 104 +1 104 +1 103 +1 0.98 +1Dominica 8.4 49 35 104 * 107 * 102 * 0.95 * 82 * 79 * 84 * 1.06 *Dominican Republic 1,306 47 21 107 109 106 0.98 104 108 101 0.93Ecuador 2,041 ** 49 ** ... 114 114 114 1.00 118 ** 119 ** 118 ** 1.00 **El Salvador 994 48 11 109 111 107 0.97 115 117 113 0.97Grenada 14 48 79 92 +1 93 +1 91 +1 0.97 +1 103 105 100 0.95Guatemala 2,501 48 11 101 108 94 0.87 114 117 110 0.94Guyana 107 49 2 118 119 116 0.98 109 109 108 0.99Haiti ... ... ... ... ... ... ... ... ... ... ...Honduras 1,276 49 9 107 +1 106 +1 108 +1 1.01 +1 116 116 116 1.00Jamaica 315 49 12 94 ** 94 ** 94 ** 1.00 ** 93 95 92 0.97Mexico 14,699 49 8 111 112 110 0.98 114 115 113 0.98Montserrat 0.50 -1 49 -1 31 -1 ... ... ... ... 107 *, -1 101 *, -1 113 *, -1 *, -11.12Netherlands Antilles ... ... ... 131 135 127 0.95 ... ... ... ...Nicaragua 944 48 15 101 100 101 1.01 117 118 116 0.98Panama 445 48 11 108 110 106 0.97 111 113 109 0.97Paraguay 894 -1 48 -1 18 -1 119 ** 121 ** 116 ** 0.96 ** 105 -1 107 -1 104 -1 0.97 -1Peru 3,855 49 20 123 124 123 0.99 109 109 109 1.00Saint Kitts and Nevis 6.5 50 21 120 *, +1 118 *, +1 122 *, +1 1.04 *, +1 ... ... ... ...Saint Lucia 21 49 4 104 107 101 0.95 98 99 97 0.97Saint Vincent and the Grenadines 16 47 6 117 +1 121 +1 114 +1 0.95 +1 109 114 104 0.92Suriname 70 48 46 ... ... ... ... 114 116 111 0.95Trinidad and Tobago 131 48 72 97 98 97 0.99 103 105 102 0.97Turks and Caicos Islands ... ... ... ... ... ... ... ... ... ... ...Uruguay 359 -1 48 -1 14 -1 111 112 111 0.99 114 -1 116 -1 113 -1 0.97 -1Venezuela 3,439 48 16 100 101 99 0.98 103 104 102 0.97North America and Western EuropeAndorra 4.5 47 2 ... ... ... ... 87 * 88 * 85 * 0.96 *Austria 337 48 5 102 103 102 0.99 100 100 99 0.99Belgium 733 49 54 105 105 105 0.99 103 103 103 1.00Canada 2,305 -2 49 -2 6 -2 99 99 99 1.00 99 -2 99 -2 99 -2 1.00 -2Cyprus 57 49 7 97 * 98 * 97 * 1.00 * 103 * 104 * 103 * 0.99 *Denmark 416 -1 49 -1 12 -1 101 102 101 1.00 99 -1 99 -1 99 -1 1.00 -1Finland 357 49 1 99 99 99 1.00 97 98 97 0.99122
G l o b a l e d u c a t i o n d i g e s t 2 0 1 0 C o m p a r i n g e d u c a t i o n s t a t i s t i c s a r o u n d t h e w o r l dNet enrolment rate (adjusted)Teaching staffTrainedteachers (%)Pupil/teacherratio1999 2008 2008 20082008MF M F GPI MF M F GPI MF (000) % F MF M F12 13 14 15 16 17 18 19 20 21 22 23 24 2599 ... ... ... 99 99 99 0.99 0.58 83 99 97 100 17 ArubaRegion90 89 90 1.00 92 91 93 1.03 2.3 87 91 90 91 16 Bahamas... ... ... ... ... ... ... ... 1.7 * 79 * 61 * 65 * 60 * 13 * Barbados90 ** 90 ** 90 ** 1.00 ** 100 99 100 1.00 2.3 72 43 42 43 23 Belize... ... ... ... 93 **, -2 ... ... ... 0.57 -2 89 -2 100 -2 100 -2 100 -2 8 -2 Bermuda96 96 96 1.00 95 -1 95 -1 95 -1 1.01 -1 62 -1 ... ... ... ... 24 -1 Bolivia92 ... ... ... 95 96 94 0.98 774 91 ... ... ... 23 BrazilCountry or territory98 ** 98 ** 99 ** 1.01 ** 97 **, -1 96 **, -1 98 **, -1 1.03 **, -1 0.22 -1 90 -1 72 -1 57 -1 73 -1 14 -1 British Virgin Islands99 *, +1 ... ... ... 87 * 93 * 81 * 0.88 * 0.31 88 96 87 97 12 Cayman Islands... ... ... ... 95 -1 95 -1 94 -1 0.99 -1 67 -1 78 -1 ... ... ... 25 -1 Chile96 95 ** 96 ** 1.01 ** 94 93 94 1.00 180 78 100 100 100 29 Colombia... ... ... ... ... ... ... ... 28 80 86 87 86 19 Costa Rica99 ... ... ... 100 +1 ... ... ... 92 +1 78 +1 100 +1 100 +1 100 +1 9 +1 Cuba97 ** 97 ** 96 ** 0.98 ** 76 * 72 * 80 * 1.12 * 0.50 85 59 41 63 17 Dominica81 81 82 1.02 82 82 83 1.02 67 69 89 90 89 20 Dominican Republic99 98 100 1.01 99 -1 ... ... ... 90 ** 70 ** 100 ** 100 ** 100 ** 23 ** Ecuador79 -1 73 -1 86 -1 1.18 -1 96 95 96 1.02 30 73 93 91 94 33 El Salvador84 **, +1 87 **, +1 81 **, +1 0.93 **, +1 98 98 99 1.01 0.62 75 73 71 74 23 Grenada83 87 80 0.92 96 98 95 0.97 85 65 ... ... ... 29 Guatemala... ... ... ... 99 98 99 1.00 4.2 88 58 53 59 26 Guyana... ... ... ... ... ... ... ... ... ... ... ... ... ... Haiti88 +1 88 +1 89 +1 1.01 +1 97 96 98 1.02 38 75 36 31 38 33 Honduras90 ** 90 ** 90 ** 1.01 ** 81 82 79 0.97 ... ... ... ... ... ... Jamaica99 99 100 1.01 100 99 100 1.00 525 66 95 ... ... 28 Mexico... ... ... ... 96 *, -1 ... ... ... 0.03 -1 100 -1 77 -1 . -1 77 -1 16 -1 Montserrat... ... ... ... ... ... ... ... ... ... ... ... ... ... Netherlands Antilles80 79 81 1.02 93 93 94 1.01 32 76 73 58 77 29 Nicaragua97 97 97 1.00 99 99 98 0.99 18 76 91 93 91 24 Panama97 96 97 1.00 91 -1 91 -1 91 -1 1.00 -1 ... ... ... ... ... ... Paraguay100 ** ... ... ... 97 97 98 1.01 185 65 ... ... ... 21 Peru... ... ... ... ... ... ... ... 0.40 89 64 ... ... 16 Saint Kitts and Nevis93 ** 95 ** 92 ** 0.97 ** 94 94 93 0.99 0.98 86 88 73 90 21 Saint Lucia98 **, +1 ... ... ... 98 ... ... ... 0.92 87 83 ... ... 17 Saint Vincent and the Grenadines... ... ... ... 90 91 90 0.99 4.4 93 100 100 100 16 Suriname93 92 93 1.01 95 96 95 0.99 7.6 * 79 * 87 * ... ... 17 * Trinidad and Tobago... ... ... ... ... ... ... ... ... ... ... ... ... ... Turks and Caicos Islands... ... ... ... 98 -1 98 -1 98 -1 1.00 -1 23 -1 ... ... ... ... 16 -1 Uruguay87 86 88 1.01 92 92 92 1.01 212 81 83 69 87 16 Venezuela... ... ... ... 82 * 82 * 81 * 0.98 * 0.45 78 100 100 100 10 Andorra97 ** 97 ** 98 ** 1.01 ** ... ... ... ... 29 89 ... ... ... 12 Austria99 99 99 1.00 99 98 99 1.01 66 80 ... ... ... 11 Belgium99 99 99 1.00 ... ... ... ... ... ... ... ... ... ... Canada98 * 98 * 98 * 1.00 * 99 * 99 * 99 * 0.99 * 3.9 82 ... ... ... 15 Cyprus98 98 98 1.01 96 -1 95 -1 97 -1 1.02 -1 ... ... ... ... ... ... Denmark99 99 98 1.00 96 96 96 1.00 25 78 ... ... ... 14 FinlandNorth America and Western Europe123
T a b l e3 PRIMARY EDUCATION / ISCED 1 / Enrolment and teaching staffRegion Enrolment Gross enrolment ratioCountry or territory2008 1999 2008MF (000) % F % Private MF M F GPI MF M F GPI1 2 3 4 5 6 7 8 9 10 11France 4,139 48 15 106 106 105 0.99 110 111 109 0.99Germany 3,236 49 4 106 106 106 0.99 105 105 105 1.00Gibraltar 3.2 49 9 ... ... ... ... ... ... ... ...Greece 639 -1 49 -1 7 -1 94 94 95 1.00 101 -1 101 -1 101 -1 1.00 -1Holy See . . . . . . . . . . .Iceland 30 49 2 99 100 98 0.98 98 98 98 1.00Ireland 487 49 1 104 104 103 0.99 105 105 105 1.01Israel 841 49 . 112 113 111 0.99 111 110 111 1.01Italy 2,820 -1 48 -1 7 -1 104 105 104 0.99 104 -1 104 -1 103 -1 0.99 -1Liechtenstein 2.2 50 4 ... ... ... ... 107 * 107 * 107 * 1.00 *Luxembourg 36 49 8 101 100 102 1.02 100 100 101 1.01Malta 28 -1 48 -1 27 -1 107 106 107 1.01 99 -1 99 -1 99 -1 1.00 -1Monaco 1.8 +1 49 +1 23 +1 ... ... ... ... 128 *, +1 131 *, +1 125 *, +1 *, +10.95Netherlands 1,286 48 ... 108 109 107 0.98 107 108 106 0.98Norway 430 49 2 101 101 101 1.00 99 99 99 1.00Portugal 754 -1 47 -1 11 -1 123 126 120 0.96 115 -1 118 -1 112 -1 0.95 -1San Marino 1.6 48 . ... ... ... ... ... ... ... ...Spain 2,625 48 33 105 106 105 0.99 107 107 106 0.99Sweden 585 49 8 110 108 111 1.03 95 95 95 0.99Switzerland 505 48 4 104 104 104 1.00 103 103 103 1.00United Kingdom 4,465 49 5 101 101 101 1.00 106 106 106 1.00United States of America 24,677 49 10 101 99 102 1.03 99 98 99 1.01South and West AsiaAfghanistan 4,888 38 ... 29 52 4 0.08 106 127 84 0.66Bangladesh 16,002 * 51 * 40 * ... ... ... ... 92 * 89 * 94 * 1.06 *Bhutan 109 +1 50 +1 3 +1 75 80 69 0.85 109 +1 108 +1 110 +1 1.01 +1India 140,357 -1 47 -1 ... 93 101 85 0.84 113 -1 115 -1 111 -1 0.97 -1Iran (Islamic Republic of) 7,028 57 ... 109 112 106 0.94 128 … … …Maldives 47 48 1 134 135 134 1.00 112 115 109 0.94Nepal 4,901 +2 50 +2 13 +2 115 129 99 0.77 ... ... ... ...Pakistan 18,176 44 ... 69 *, +1 82 **, +1 56 **, +1 0.68 **, +1 85 93 77 0.83Sri Lanka 1,631 49 - 105 -1 106 -1 103 -1 0.97 -1 101 101 102 1.00Sub-Saharan AfricaAngola 3,932 45 2 81 -1 89 -1 74 -1 0.83 -1 128 141 114 0.81Benin 1,601 46 9 83 99 66 0.67 117 125 108 0.87Botswana 330 -2 49 -2 5 -2 105 105 106 1.00 110 -2 111 -2 109 -2 0.98 -2Burkina Faso 1,906 +1 46 +1 14 +1 44 51 36 0.70 78 +1 83 +1 74 +1 0.89 +1Burundi 1,603 49 1 49 54 44 0.82 136 139 132 0.95Cameroon 3,201 46 23 84 92 75 0.82 111 119 102 0.86Cape Verde 76 48 - 121 123 118 0.96 101 105 98 0.94Central African Republic 608 +1 42 +1 14 +1 ... ... ... ... 89 +1 104 +1 74 +1 0.71 +1Chad 1,496 41 ... 63 80 46 0.58 83 97 68 0.70Comoros 111 47 15 99 107 91 0.85 119 125 114 0.92Congo 628 48 35 57 58 56 0.97 114 118 110 0.94Côte d’Ivoire 2,356 44 10 73 84 62 0.74 74 83 66 0.79Democratic Republic of the Congo 9,973 45 10 47 49 45 0.90 90 99 82 0.83124
G l o b a l e d u c a t i o n d i g e s t 2 0 1 0 C o m p a r i n g e d u c a t i o n s t a t i s t i c s a r o u n d t h e w o r l dNet enrolment rate (adjusted)Teaching staffTrainedteachers (%)Pupil/teacherratio1999 2008 2008 20082008MF M F GPI MF M F GPI MF (000) % F MF M F12 13 14 15 16 17 18 19 20 21 22 23 24 25100 100 100 1.00 99 99 99 1.00 217 82 ... ... ... 19 FranceRegion100 ** ... ... ... 100 **, -1 ... ... ... 240 85 ... ... ... 13 Germany... ... ... ... ... ... ... ... 0.19 77 100 100 100 17 Gibraltar95 95 96 1.01 100 -1 99 -1 100 -1 1.00 -1 62 -1 65 -1 ... ... ... 10 -1 Greece. . . . . . . . . . . . . . Holy See99 ... ... ... 98 97 98 1.00 2.9 **, -1 80 **, -1 ... ... ... 10 **, -1 Iceland93 93 94 1.01 97 96 98 1.02 31 84 ... ... ... 16 Ireland98 98 98 1.00 97 97 98 1.01 64 86 ... ... ... 13 Israel100 ... ... ... 99 -1 100 -1 99 -1 0.99 -1 273 -1 95 -1 ... ... ... 10 -1 ItalyCountry or territory... ... ... ... 90 * 88 * 92 * 1.05 * 0.33 76 ... ... ... 7 Liechtenstein98 97 99 1.03 97 97 98 1.02 3.0 72 ... ... ... 12 Luxembourg95 94 96 1.02 91 -1 91 -1 92 -1 1.01 -1 ... ... ... ... ... ... Malta... ... ... ... ... ... ... ... ... ... ... ... ... ... Monaco99 100 99 0.99 99 99 99 0.99 ... ... ... ... ... ... Netherlands100 100 100 1.00 99 99 99 1.00 ... ... ... ... ... ... Norway... ... ... ... 99 -1 99 -1 99 -1 0.99 -1 64 -1 82 -1 ... ... ... 12 -1 Portugal... ... ... ... ... ... ... ... 0.25 91 ... ... ... 6 San Marino100 100 99 1.00 100 100 100 1.00 211 75 ... ... ... 12 Spain100 ... ... ... 95 95 94 0.99 61 81 ... ... ... 10 Sweden99 99 100 1.01 99 99 99 1.01 40 80 ... ... ... 13 Switzerland100 100 100 1.00 100 100 100 1.00 244 81 ... ... ... 18 United Kingdom95 95 95 1.00 93 93 94 1.01 1,803 86 ... ... ... 14 United States of AmericaSouth and West Asia... ... ... ... ... ... ... ... 114 29 ... ... ... 43 Afghanistan... ... ... ... 88 87 89 1.02 366 42 54 52 57 44 * Bangladesh56 59 52 0.89 88 +1 87 +1 90 +1 1.03 +1 3.9 +1 35 +1 91 ... ... 28 +1 Bhutan85 *, +1 92 *, +1 77 *, +1 0.84 *, +1 96 -1 97 -1 94 -1 0.96 -1 ... ... ... ... ... ... India93 ** 95 ** 91 ** 0.96 ** ... ... ... ... 351 63 ... ... ... 20 Iran (Islamic Republic of)98 98 98 0.99 96 97 95 0.98 3.6 72 68 70 67 13 Maldives67 * 75 * 59 * 0.79 * ... ... ... ... 154 +2 40 +2 74 +2 74 +2 72 +2 32 +2 Nepal... ... ... ... 66 * 72 * 60 * 0.83 * 447 47 85 92 77 41 Pakistan... ... ... ... 99 99 100 1.01 69 85 ... ... ... 23 Sri Lanka52 **, -1 55 **, -1 48 **, -1 0.86 **, -1 ... ... ... ... ... ... ... ... ... ... Angola... ... ... ... 93 99 86 0.87 36 19 72 -2 71 -2 76 -2 45 BeninSub-Saharan Africa83 81 85 1.05 90 -2 88 -2 91 -2 1.03 -2 13 -2 80 -2 94 -2 91 -2 95 -2 25 -2 Botswana35 41 29 0.70 64 +1 68 +1 60 +1 0.89 +1 39 +1 33 +1 86 +1 84 +1 91 +1 49 +1 Burkina Faso36 39 33 0.84 99 ... ... ... 29 -1 53 -1 87 -1 81 -1 94 -1 52 -1 Burundi... ... ... ... 88 94 82 0.87 70 44 62 *, -2 58 *, -2 67 *, -2 46 Cameroon99 ** ... ... ... 85 86 84 0.98 3.1 67 85 80 87 24 Cape Verde... ... ... ... 67 +1 77 +1 57 +1 0.74 +1 6.4 +1 14 +1 ... ... ... 95 +1 Central African Republic51 63 39 0.62 ... ... ... ... 24 28 35 ... ... 62 Chad68 73 62 0.85 ... ... ... ... 3.7 37 57 ... ... 30 Comoros... ... ... ... 64 -2 66 -2 62 -2 0.93 -2 12 47 89 -2 84 -2 95 -2 52 Congo56 64 48 0.76 ... ... ... ... 56 23 100 100 100 42 Côte d’Ivoire33 34 32 0.94 ... ... ... ... 256 27 93 93 95 39 Democratic Republic of the Congo125
T a b l e3 PRIMARY EDUCATION / ISCED 1 / Enrolment and teaching staffRegion Enrolment Gross enrolment ratio2008 1999 2008Country or territoryMF (000) % F % Private MF M F GPI MF M F GPI1 2 3 4 5 6 7 8 9 10 11Equatorial Guinea 81 -1 49 -1 ... 109 122 96 0.79 99 -1 101 -1 96 -1 0.95 -1Eritrea 314 45 9 52 57 47 0.82 52 57 47 0.82Ethiopia 12,742 47 7 ** 50 63 38 0.61 98 103 92 0.89Gabon ... ... ... 139 139 139 1.00 ... ... ... ...Gambia 221 51 20 92 100 85 0.85 86 84 89 1.06Ghana 3,625 49 17 ** 79 82 76 0.92 105 106 105 0.99Guinea 1,364 45 26 56 68 43 0.64 90 97 83 0.85Guinea-Bissau 269 -2 ... ... 80 ** 96 ** 65 ** 0.67 ** 120 -2 ... ... ...Kenya 6,869 49 11 91 92 90 0.97 112 113 110 0.98Lesotho 401 -1 49 -1 1 -1 102 98 105 1.08 108 -1 108 -1 107 -1 0.99 -1Liberia 540 47 30 98 113 83 0.74 91 96 86 0.90Madagascar 4,020 49 19 98 100 96 0.97 152 154 149 0.97Malawi 3,198 50 ... 136 139 133 0.96 120 119 122 1.03Mali 1,926 +1 45 +1 40 +1 56 66 47 0.71 95 +1 103 +1 86 +1 0.84 +1Mauritius 118 +1 49 +1 27 +1 103 103 104 1.01 100 +1 100 +1 100 +1 1.00 +1Mozambique 4,904 47 2 70 80 59 0.74 114 121 107 0.88Namibia 407 49 4 116 116 117 1.01 112 113 112 0.99Niger 1,554 +1 43 +1 4 +1 30 36 24 0.68 62 +1 69 +1 55 +1 0.80 +1Nigeria 21,632 -1 46 -1 5 -1 91 101 81 0.80 93 -1 99 -1 87 -1 0.88 -1Rwanda 2,190 51 6 100 101 99 0.98 151 150 152 1.01Sao Tome and Principe 34 +1 50 +1 - +1 108 109 106 0.97 133 +1 133 +1 134 +1 1.01 +1Senegal 1,618 50 13 65 70 ** 60 ** 0.86 ** 84 83 84 1.02Seychelles 8.6 +1 49 +1 8 +1 116 * 117 * 116 * 0.99 * 131 * 131 * 130 * 0.99 *Sierra Leone 1,322 -1 48 -1 3 -1 70 +1 ... ... ... 158 -1 168 -1 148 -1 0.88 -1Somalia 457 -1 35 -1 ... ... ... ... ... 33 -1 42 -1 23 -1 0.55 -1South Africa 7,312 -1 49 -1 2 -1 113 115 112 0.97 105 -1 106 -1 103 -1 0.96 -1Swaziland 233 -1 48 -1 - -1 94 96 92 0.95 108 -1 112 -1 104 -1 0.93 -1Togo 1,164 +1 48 +1 ... 116 133 100 0.75 115 +1 119 +1 111 +1 0.94 +1Uganda 7,964 50 9 ** 126 132 121 0.92 120 120 121 1.01United Republic of Tanzania 8,602 49 1 ** 67 67 67 1.00 110 111 109 0.99Zambia 2,909 49 3 82 85 79 0.92 119 120 118 0.98Zimbabwe 2,446 -2 50 -2 ... 100 102 99 0.97 104 -2 104 -2 103 -2 0.99 -2REGIONAL AVERAGESWorld 696,347 ** 47 ** ... 98 ** 102 ** 94 ** 0.92 ** 107 ** 108 ** 105 ** 0.97 **Arab States 40,840 ** 47 ** ... 87 93 81 0.87 96 ** 100 ** 91 ** 0.92 **Central and Eastern Europe 19,847 49 ... 103 105 102 0.97 99 99 98 0.99Central Asia 5,596 48 ... 99 99 98 0.99 100 101 100 0.98East Asia and the Pacific 189,098 47 ... 109 # 110 # 109 # 0.99 # 110 110 111 1.01Latin America and the Caribbean 67,687 48 ... 121 123 119 0.97 116 118 114 0.97North America and Western Europe 51,752 49 ... 103 102 103 1.01 102 102 102 1.00South and West Asia 192,978 # 47 # ... 89 97 80 0.83 108 # 110 # 106 # 0.96 #Sub-Saharan Africa 128,548 ** 47 ** ... 80 86 73 0.85 102 ** 106 ** 97 ** 0.91 **Please refer to the Reader’s Guide for more information on the data and symbols used in each table.126
G l o b a l e d u c a t i o n d i g e s t 2 0 1 0 C o m p a r i n g e d u c a t i o n s t a t i s t i c s a r o u n d t h e w o r l dNet enrolment rate (adjusted)Teaching staffTrainedteachers (%)Pupil/teacherratio1999 2008 2008 20082008MF M F GPI MF M F GPI MF (000) % F MF M F12 13 14 15 16 17 18 19 20 21 22 23 24 25RegionCountry or territory69 **, +1 ... ... ... ... ... ... ... 2.9 -1 34 -1 31 -1 32 -1 29 -1 28 -1 Equatorial Guinea33 36 31 0.86 40 43 37 0.87 6.6 48 89 94 84 47 Eritrea37 43 30 0.69 79 82 76 0.93 215 39 90 87 94 59 Ethiopia... ... ... ... ... ... ... ... ... ... ... ... ... ... Gabon77 82 71 0.87 72 69 74 1.07 6.4 33 ... ... ... 34 Gambia60 ** 61 ** 59 ** 0.96 ** 77 76 77 1.01 112 33 49 40 68 32 Ghana44 51 36 0.69 72 77 67 0.87 31 28 82 * 80 * 88 * 44 Guinea52 ** 61 ** 43 ** 0.71 ** ... ... ... ... 4.3 -2 ... ... ... ... 62 -2 Guinea-Bissau63 63 64 1.02 82 82 83 1.01 148 ** 46 ** 98 ** 98 ** 98 ** 47 ** Kenya58 54 61 1.13 73 -1 71 -1 75 -1 1.05 -1 11 -1 77 -1 71 -1 64 -1 74 -1 37 -1 Lesotho48 55 42 0.76 ... ... ... ... 23 12 40 39 47 24 Liberia66 66 67 1.01 99 -1 99 -1 100 -1 1.01 -1 85 56 52 42 60 47 Madagascar99 100 98 0.98 91 88 94 1.06 ... ... ... ... ... ... Malawi45 ** 52 ** 37 ** 0.71 ** 77 +1 84 +1 70 +1 0.83 +1 38 +1 27 +1 50 +1 48 +1 56 +1 50 +1 Mali91 90 91 1.01 94 +1 93 +1 95 +1 1.01 +1 5.5 +1 68 +1 100 +1 100 +1 100 +1 22 +1 Mauritius52 58 46 0.79 80 82 77 0.94 77 35 67 64 73 64 Mozambique89 86 92 1.07 91 88 93 1.06 14 ... 95 ... ... 29 Namibia26 31 21 0.68 54 +1 60 +1 48 +1 0.79 +1 40 +1 45 +1 98 +1 97 +1 99 +1 39 +1 Niger61 ** 67 ** 55 ** 0.82 ** 63 **, -1 66 **, -1 60 **, -1 0.91 **, -1 467 -1 48 -1 51 -2 41 -2 62 -2 46 -1 Nigeria... ... ... ... 96 ** 95 ** 97 ** 1.03 ** 32 54 94 90 97 68 Rwanda88 88 87 0.99 98 +1 ... ... ... 1.3 +1 49 +1 48 +1 47 +1 49 +1 26 +1 Sao Tome and Principe55 59 ** 52 ** 0.87 ** 75 75 76 1.02 44 29 ... ... ... 36 Senegal... ... ... ... ... ... ... ... 0.62 +1 85 +1 99 +1 ... ... 14 +1 Seychelles... ... ... ... ... ... ... ... 30 -1 26 -1 49 -1 45 -1 63 -1 44 -1 Sierra Leone... ... ... ... ... ... ... ... 13 -1 17 -1 ... ... ... 36 -1 Somalia97 95 98 1.03 93 **, -1 92 **, -1 94 **, -1 1.02 **, -1 236 -1 77 -1 ... ... ... 31 -1 South Africa71 70 72 1.03 83 -1 82 -1 84 -1 1.02 -1 7.2 -1 70 -1 94 -1 93 -1 94 -1 32 -1 Swaziland86 97 75 0.77 94 +1 98 +1 89 +1 0.91 +1 28 +1 46 +1 15 -1 14 -1 22 -1 41 +1 Togo... ... ... ... 97 96 99 1.03 160 40 89 90 89 50 Uganda49 49 50 1.04 100 ** ... ... ... 165 50 100 -1 100 -1 100 -1 52 United Republic of Tanzania70 71 68 0.97 97 96 97 1.02 48 ** 50 ** ... ... ... 61 ** Zambia84 83 84 1.01 91 -2 90 -2 91 -2 1.02 -2 64 -2 ... ... ... ... 38 -2 ZimbabweREGIONAL AVERAGES84 ** 87 ** 81 ** 0.93 ** 90 ** 91 ** 89 ** 0.98 ** 27,845 ** 62 ** ... ... ... 25 ** World77 81 73 0.90 86 ** 88 ** 83 ** 0.94 ** 1,899 ** 56 ** ... ... ... 22 ** Arab States93 # 94 # 92 # 0.98 # 94 ** 94 ** 94 ** 1.00 ** 1,120 ** 82 ** ... ... ... 18 ** Central and Eastern Europe95 # 95 # 94 # 0.99 # 94 95 94 0.99 330 88 ... ... ... 17 Central Asia95 # 95 # 95 # 1.00 # 95 # 95 # 96 # 1.02 # 10,033 60 ... ... ... 19 East Asia and the Pacific94 93 ** 94 ** 1.01 ** 95 95 95 1.00 2,919 78 ... ... ... 23 Latin America and the Caribbean97 97 97 1.00 96 95 96 1.01 3,739 83 ... ... ... 14 North America and Western Europe79 # 86 # 71 # 0.83 # 90 # 92 # 87 # 0.95 # 4,970 # 46 # ... ... ... 39 # South and West Asia59 63 55 0.88 77 ** 79 ** 75 ** 0.95 ** 2,835 ** 43 ** ... ... ... 45 ** Sub-Saharan Africa127
T a b l e 4 PRIMARY EDUCATION / ISCED 1 / Measures of progression and completionRegionTotal numberof repeatersPercentageof repeatersSurvival rateto grade 5Survival rateto last gradeGross intake ratioto the last gradeCountry or territoryArab States2008 2008 2007 to 2008 2007 to 2008 2008MF (000) % F MF M F MF M F MF M F GPI MF M1 2 3 4 5 6 7 8 9 10 11 12 13 14Algeria 307 36 8 10 6 96 95 97 93 91 95 1.04 114 119Bahrain 1.7 46 2 2 2 ... ... ... ... ... ... ... 98 98Djibouti 6.0 46 11 11 10 87 88 86 87 88 86 0.98 41 45Egypt 310 -1 35 -1 3 -1 4 -1 2 -1 97 **, -1 ... ... 97 **, -1 ... ... ... 95 -1 97 -1Iraq ... ... ... ... ... ... ... ... ... ... ... ... ... ...Jordan 4.8 50 1 1 1 99 -1 ... ... 99 -1 ... ... ... 100 99Kuwait 1.9 -1 38 -1 1 -1 1 -1 1 -1 100 -1 100 -1 99 -1 100 -1 100 -1 99 -1 0.99 -1 98 -1 98 -1Lebanon 42 +1 39 +1 9 +1 11 +1 7 +1 97 +1 96 +1 97 +1 93 +1 92 +1 95 +1 1.03 +1 85 +1 83 +1Libyan Arab Jamahiriya ... ... ... ... ... ... ... ... ... ... ... ... ... ...Mauritania 14 +1 51 +1 3 +1 3 +1 3 +1 82 +1 81 +1 83 +1 82 +1 81 +1 83 +1 1.02 +1 72 +1 70 +1Morocco 461 38 12 14 10 83 83 82 76 77 76 0.99 81 85Oman 3.0 49 1 1 1 99 99 100 100 99 100 1.01 80 80Palestinian Autonomous Territories 1.8 48 - - - . . . 99 ... ... ... 82 83Qatar 0.49 45 1 1 1 97 93 100 97 94 100 1.07 115 119Saudi Arabia 106 46 3 3 3 97 * 100 * 94 * 96 * 100 * 93 * 0.93 * 95 99Sudan 174 +1 45 +1 4 +1 4 +1 4 +1 94 89 100 93 88 100 1.14 57 +1 ...Syrian Arab Republic 176 41 7 8 6 . . . 97 96 97 1.01 114 114Tunisia 88 37 8 10 6 96 96 96 94 94 95 1.01 93 93United Arab Emirates 5.3 -1 44 -1 2 -1 2 -1 2 -1 100 -1 100 -1 100 -1 100 -1 100 -1 100 -1 1.00 -1 105 -1 103 -1Yemen 188 38 6 6 5 ... ... ... ... ... ... ... 61 72Central and Eastern EuropeAlbania ... ... ... ... ... . . . ... ... ... ... ... ...Belarus 0.14 ... - - - . . . 100 -1 99 -1 100 -1 1.00 -1 96 ...Bosnia and Herzegovina 0.14 32 - - - . . . ... ... ... ... ... ...Bulgaria 4.8 39 2 2 1 . . . 94 93 94 1.01 90 91Croatia 0.55 -1 40 -1 - -1 - -1 - -1 . . . 100 -1 100 -1 100 -1 1.00 -1 102 -1 102 -1Czech Republic 2.9 40 1 1 1 99 99 99 99 99 99 1.00 95 95Estonia 0.66 25 1 1 - 99 99 98 98 99 98 0.99 100 100Hungary 6.8 40 2 2 1 . . . 99 99 99 1.00 95 97Latvia 3.9 27 3 5 2 96 98 95 96 97 94 0.97 95 97Lithuania 0.91 37 1 1 1 . . . 98 98 98 1.00 92 92Montenegro ... ... ... ... ... . . . ... ... ... ... ... ...Poland 18 -1 22 -1 1 -1 1 -1 - -1 98 -1 ... ... 97 -1 ... ... ... 96 -1 ...Republic of Moldova 0.12 46 - - - . . . 96 94 97 1.03 91 * 92 *Romania 15 39 2 2 1 . . . 93 93 94 1.01 96 96Russian Federation 21 ... - ... ... . . . 95 ... ... ... 95 ...Serbia 1.8 40 1 1 1 . . . 98 98 99 1.01 100 * 99 *Slovakia 6.7 44 3 3 3 . . . 97 97 98 1.01 96 96Slovenia 0.61 37 1 1 - ... ... ... ... ... ... ... 96 97The former Yugoslav Rep. of Macedonia 0.10 -1 35 -1 - -1 - -1 - -1 . . . 97 -1 98 -1 97 -1 0.98 -1 92 -1 92 -1Turkey 144 50 2 2 2 94 94 94 94 94 94 1.01 93 95Ukraine 1.8 49 * - - * - * . . . 97 96 * 98 * 1.02 * 99 98 *Central AsiaArmenia 0.22 -1 48 -1 - -1 - -1 - -1 . . . 98 -1 98 -1 97 -1 0.99 -1 98 -1 96 -1Azerbaijan 1.5 42 - - - . . . 99 100 98 0.98 121 * 123 *128
G l o b a l e d u c a t i o n d i g e s t 2 0 1 0 C o m p a r i n g e d u c a t i o n s t a t i s t i c s a r o u n d t h e w o r l dGross intake ratioto the last gradeExpected gross intake ratioto the last gradeGross primarygraduation ratioTransition rate fromprimary to secondary(general programmes)2008 2008 2008 2007 to 2008RegionF GPI MF M F GPI MF M F GPI MF M F GPI15 16 17 18 19 20 21 22 23 24 25 26 27 28108 0.90 95 95 96 1.02 81 -2 79 -2 82 -2 1.04 -2 91 90 92 1.02 Algeria98 1.00 ... ... ... ... ... ... ... ... 96 -2 95 -2 98 -2 1.03 -2 BahrainCountry or territoryArab States37 0.81 ... ... ... ... 27 -2 31 -2 23 -2 0.73 -2 88 -1 90 -1 85 -1 0.94 -1 Djibouti93 -1 0.96 -1 94 **, -1 ... ... ... ... ... ... ... ... ... ... ... Egypt... ... ... ... ... ... ... ... ... ... ... ... ... ... Iraq100 1.01 ... ... ... ... ... ... ... ... 99 99 98 0.99 Jordan98 -1 1.01 -1 98 -1 99 -1 96 -1 0.97 -1 ... ... ... ... 97 96 98 1.02 Kuwait87 +1 1.05 +1 95 +1 91 +1 100 +1 1.09 +1 81 +1 77 +1 85 +1 1.10 +1 86 +1 84 +1 89 +1 1.06 +1 Lebanon... ... ... ... ... ... ... ... ... ... ... ... ... ... Libyan Arab Jamahiriya75 +1 1.08 +1 95 +1 91 +1 98 +1 1.08 +1 12 +1 13 +1 10 +1 0.83 +1 34 +1 38 +1 31 +1 0.81 +1 Mauritania78 0.91 81 82 79 0.96 82 86 78 0.91 79 80 78 0.98 Morocco81 1.01 73 73 73 1.01 78 78 78 1.00 97 97 97 1.00 Oman81 0.98 78 ... ... ... 84 84 83 0.98 98 98 98 1.01 Palestinian Autonomous Territories112 0.93 103 99 107 1.08 99 -2 102 -2 96 -2 0.94 -2 99 -1 97 -1 100 -1 1.03 -1 Qatar92 0.93 98 * 101 * 94 * 0.93 * 98 -1 101 -1 95 -1 0.94 -1 94 * 92 * 97 * 1.05 * Saudi Arabia... ... ... ... ... ... ... ... ... ... 94 90 98 1.09 Sudan113 0.99 113 114 113 0.99 108 108 108 1.00 95 95 96 1.01 Syrian Arab Republic93 1.00 100 99 101 1.02 ... ... ... ... 82 79 86 1.08 Tunisia107 -1 1.04 -1 113 -1 113 -1 112 -1 0.99 -1 88 ** 88 ** 89 ** 1.01 ** 98 -1 98 -1 99 -1 1.00 -1 United Arab Emirates49 0.69 ... ... ... ... ... ... ... ... ... ... ... ... Yemen... ... ... ... ... ... ... ... ... ... ... ... ... ... Albania... ... ... ... ... ... 92 -1 91 -1 92 -1 1.01 -1 100 -1 100 -1 100 -1 1.00 -1 BelarusCentral and Eastern Europe... ... ... ... ... ... ... ... ... ... ... ... ... ... Bosnia and Herzegovina89 0.98 100 100 101 1.02 ... ... ... ... 95 95 95 1.01 Bulgaria101 -1 1.00 -1 94 -1 95 -1 94 -1 1.00 -1 ... ... ... ... 100 -1 99 -1 100 -1 1.01 -1 Croatia95 1.00 107 108 106 0.99 ... ... ... ... 99 99 99 1.00 Czech Republic101 1.01 100 101 100 0.99 ... ... ... ... 98 97 99 1.02 Estonia94 0.97 102 102 102 1.00 ... ... ... ... 99 99 99 1.00 Hungary93 0.97 100 101 99 0.98 ... ... ... ... 94 92 97 1.05 Latvia92 1.00 94 96 92 0.97 ... ... ... ... 99 99 99 1.00 Lithuania... ... ... ... ... ... ... ... ... ... ... ... ... ... Montenegro... ... 95 -1 ... ... ... ... ... ... ... 92 **, -2 ... ... ... Poland90 * 0.98 * 91 * 92 * 90 * 0.98 * 99 * 99 * 99 * 1.00 * 98 99 98 0.99 Republic of Moldova96 0.99 93 94 93 0.99 ... ... ... ... 97 97 97 1.00 Romania... ... 94 ... ... ... ... ... ... ... 100 ... ... ... Russian Federation101 * 1.02 * 101 * 100 * 102 * 1.02 * 99 *, -1 99 *, -1 99 *, -1 1.00 *, -1 99 99 99 1.00 Serbia96 1.00 97 97 97 1.00 ... ... ... ... 97 97 97 1.00 Slovakia96 0.99 ... ... ... ... ... ... ... ... ... ... ... ... Slovenia92 -1 1.00 -1 90 -1 90 -1 90 -1 1.00 -1 ... ... ... ... 99 99 100 1.01 The former Yugoslav Rep. of Macedonia92 0.96 94 95 92 0.97 ... ... ... ... ... ... ... ... Turkey99 * 1.01 * 97 96 * 98 * 1.02 * ... ... ... ... 100 100 * 100 * 1.00 * UkraineCentral Asia100 -1 1.04 -1 125 -1 124 -1 126 -1 1.02 -1 104 -1 101 -1 107 -1 1.07 -1 99 100 98 0.98 Armenia119 * 0.97 * 117 * 119 * 115 * 0.97 * 89 89 89 1.00 99 100 99 0.99 Azerbaijan129
T a b l e 4 PRIMARY EDUCATION / ISCED 1 / Measures of progression and completionRegionTotal numberof repeatersPercentageof repeatersSurvival rateto grade 5Survival rateto last gradeGross intake ratioto the last gradeCountry or territory2008 2008 2007 to 2008 2007 to 2008 2008MF (000) % F MF M F MF M F MF M F GPI MF M1 2 3 4 5 6 7 8 9 10 11 12 13 14Georgia 0.92 34 - - - 95 94 97 95 94 97 1.03 100 103Kazakhstan 0.70 +1 36 +1 - +1 - +1 - +1 . . . 99 +1 99 +1 99 +1 1.01 +1 106 +1 106 +1Kyrgyzstan 0.39 36 - - - . . . 98 98 98 1.00 92 93Mongolia 0.43 42 - - - 95 94 95 95 94 95 1.01 93 94Tajikistan 1.7 ... - ... ... . . . 99 ... ... ... 98 ...Turkmenistan - -2 ... ... ... ... . . . ... ... ... ... ... ...Uzbekistan 0.12 37 - - - . . . 99 98 100 1.03 95 95East Asia and the PacificAustralia ... ... ... ... ... ... ... ... ... ... ... ... ... ...Brunei Darussalam 0.37 27 1 1 - 100 100 99 98 98 98 1.00 106 105Cambodia 263 43 11 12 10 62 60 65 54 52 57 1.10 79 80China 304 42 - - - 100 100 99 100 100 99 0.99 96 94Cook Islands 0.04 -1 ... 2 -1 ... ... ... ... ... ... ... ... ... ... ...Democratic People’s Republic of Korea ... ... ... ... ... … … … ... ... ... ... ... ...Fiji 1.7 38 2 2 1 95 ... ... 95 ... ... ... 92 92Hong Kong SAR of China 3.6 39 1 1 1 100 100 100 100 100 100 1.00 ... ...Indonesia 858 37 3 4 2 86 83 89 80 77 83 1.07 106 107Japan ... ... ... ... ... ... ... ... ... ... ... ... ... ...Kiribati ... ... ... ... ... ... ... ... ... ... ... ... ... ...Lao People’s Democratic Republic 152 43 17 18 16 67 66 68 67 66 68 1.03 75 78Macao, China 1.7 +1 34 +1 6 +1 8 +1 5 +1 99 +1 99 +1 100 +1 100 +1 99 +1 100 +1 1.01 +1 99 +1 102 +1Malaysia . -1 . -1 . -1 . -1 . -1 94 -1 94 -1 94 -1 92 -1 92 -1 92 -1 1.00 -1 96 -1 96 -1Marshall Islands . -1 . -1 . -1 . -1 . -1 ... ... ... ... ... ... ... 91 *, -1 *, -189Micronesia (Federated States of) ... ... ... ... ... ... ... ... ... ... ... ... ... ...Myanmar 23 49 - - - 74 ... ... 74 ... ... ... 99 98Nauru ... ... ... ... ... ... ... ... ... ... ... ... 79 **, -1 **, -178New Zealand ... ... ... ... ... ... ... ... ... ... ... ... ... ...Niue ... ... ... ... ... ... ... ... ... ... ... ... ... ...Palau ... ... ... ... ... ... ... ... ... ... ... ... ... ...Papua New Guinea ... ... ... ... ... ... ... ... ... ... ... ... ... ...Philippines 304 -1 34 -1 2 -1 3 -1 2 -1 77 -1 73 -1 81 -1 73 -1 69 -1 78 -1 1.14 -1 92 -1 90 -1Republic of Korea 0.07 30 - - - 99 98 99 98 98 99 1.00 99 100Samoa 0.29 +1 41 +1 1 +1 1 +1 1 +1 ... ... ... ... ... ... ... 93 +1 97 +1Singapore 0.93 44 - - - ... ... ... ... ... ... ... ... ...Solomon Islands ... ... ... ... ... ... ... ... ... ... ... ... ... ...Thailand 525 -1 34 -1 9 -1 12 -1 6 -1 ... ... ... ... ... ... ... 87 -1 87 -1Timor-Leste 25 45 12 13 12 ... ... ... ... ... ... ... 80 80Tokelau ... ... ... ... ... ... ... ... ... ... ... ... ... ...Tonga 0.88 -2 40 -2 5 -2 6 -2 4 -2 92 -2 92 -2 92 -2 91 -2 90 -2 92 -2 1.02 -2 105 -2 102 -2Tuvalu . **, -2 . **, -2 . **, -2 . **, -2 . **, -2 ... ... ... ... ... ... ... 105 **, -2 **, -293Vanuatu 5.1 -1 43 -1 14 -1 15 -1 12 -1 82 -1 81 -1 83 -1 73 -1 74 -1 73 -1 0.99 -1 79 -1 77 -1Viet Nam 75 **, -2 ... 1 **, -2 ... ... 92 **, -2 ... ... 92 **, -2 ... ... ... ... ...Latin America and the CaribbeanAnguilla - ... - - - ... ... ... ... ... ... ... 79 ** 76 **Antigua and Barbuda 0.65 35 6 7 4 96 94 97 97 ... ... ... 103 * 104 *Argentina 288 -1 39 -1 6 -1 7 -1 5 -1 96 -1 95 -1 98 -1 95 -1 93 -1 97 -1 1.05 -1 102 -1 100 -1130
G l o b a l e d u c a t i o n d i g e s t 2 0 1 0 C o m p a r i n g e d u c a t i o n s t a t i s t i c s a r o u n d t h e w o r l dGross intake ratioto the last gradeExpected gross intake ratioto the last gradeGross primarygraduation ratioTransition rate fromprimary to secondary(general programmes)2008 2008 2008 2007 to 2008RegionF GPI MF M F GPI MF M F GPI MF M F GPI15 16 17 18 19 20 21 22 23 24 25 26 27 2897 0.94 110 107 114 1.07 104 106 101 0.95 99 99 100 1.00 GeorgiaCountry or territory106 +1 1.00 +1 105 +1 104 +1 105 +1 1.01 +1 110 +1 109 +1 110 +1 1.01 +1 100 +1 100 +1 100 +1 1.00 +1 Kazakhstan92 0.99 95 95 94 0.99 94 94 93 0.99 100 100 100 1.00 Kyrgyzstan92 0.98 127 127 127 1.00 91 92 91 1.00 97 96 98 1.02 Mongolia... ... 103 ... ... ... 96 100 93 0.93 98 ... ... ... Tajikistan... ... ... ... ... ... ... ... ... ... ... ... ... ... Turkmenistan94 0.99 91 92 91 0.99 99 100 98 0.97 100 100 100 1.00 Uzbekistan... ... ... ... ... ... ... ... ... ... ... ... ... ... AustraliaEast Asia and the Pacific107 1.02 102 100 103 1.02 87 -1 81 -1 94 -1 1.16 -1 99 100 99 1.00 Brunei Darussalam79 0.99 68 67 70 1.05 72 72 72 1.00 79 80 79 0.99 Cambodia98 1.04 96 94 97 1.03 ... ... ... ... 95 95 96 1.01 China... ... ... ... ... ... ... ... ... ... ... ... ... ... Cook Islands... ... ... ... ... ... ... ... ... ... ... ... ... ... Democratic People’s Republic of Korea91 0.99 89 ... ... ... 93 93 92 0.99 100 100 100 1.00 Fiji... ... ... ... ... ... 90 89 90 1.01 100 100 100 1.00 Hong Kong SAR of China106 0.99 100 97 104 1.07 ... ... ... ... 90 86 93 1.08 Indonesia... ... ... ... ... ... ... ... ... ... ... ... ... ... Japan... ... ... ... ... ... ... ... ... ... ... ... ... ... Kiribati71 0.91 80 82 78 0.95 70 73 66 0.91 79 80 77 0.96 Lao People’s Democratic Republic95 +1 0.93 +1 ... ... ... ... 96 +1 100 +1 92 +1 0.93 +1 91 +1 89 +1 94 +1 1.05 +1 Macao, China96 -1 1.00 -1 90 -1 90 -1 90 -1 1.01 -1 ... ... ... ... 99 **, -1 100 **, -1 98 **, -1 0.98 **, -1 Malaysia92 *, -1 1.03 *, -1 ... ... ... ... ... ... ... ... ... ... ... ... Marshall Islands... ... ... ... ... ... ... ... ... ... ... ... ... ... Micronesia (Federated States of)100 1.02 106 ... ... ... 97 96 98 1.02 73 -1 75 -1 70 -1 0.93 -1 Myanmar80 **, -1 1.02 **, -1 ... ... ... ... ... ... ... ... ... ... ... ... Nauru... ... ... ... ... ... ... ... ... ... ... ... ... ... New Zealand... ... ... ... ... ... ... ... ... ... ... ... ... ... Niue... ... ... ... ... ... ... ... ... ... ... ... ... ... Palau... ... ... ... ... ... ... ... ... ... ... ... ... ... Papua New Guinea95 -1 1.06 -1 95 -1 92 -1 99 -1 1.07 -1 ... ... ... ... 98 -1 98 -1 97 -1 0.98 -1 Philippines97 0.97 103 104 103 0.99 ... ... ... ... 100 100 100 1.00 Republic of Korea90 +1 0.93 +1 ... ... ... ... 87 +1 83 +1 91 +1 1.10 +1 ... ... ... ... Samoa... ... ... ... ... ... ... ... ... ... 91 88 95 1.08 Singapore... ... ... ... ... ... ... ... ... ... ... ... ... ... Solomon Islands88 -1 1.02 -1 ... ... ... ... ... ... ... ... 87 -1 85 -1 89 -1 1.05 -1 Thailand79 0.98 ... ... ... ... 45 -1 45 -1 46 -1 1.03 -1 100 100 100 1.00 Timor-Leste... ... ... ... ... ... ... ... ... ... ... ... ... ... Tokelau108 -2 1.06 -2 98 -2 97 -2 98 -2 1.01 -2 ... ... ... ... 77 -2 78 -2 75 -2 0.97 -2 Tonga118 **, -2 1.27 **, -2 ... ... ... ... ... ... ... ... ... ... ... ... Tuvalu81 -1 1.05 -1 81 -1 83 -1 78 -1 0.94 -1 ... ... ... ... 79 -1 75 -1 83 -1 1.10 -1 Vanuatu... ... ... ... ... ... ... ... ... ... 93 **, -2 ... ... ... Viet Nam81 ** 1.07 ** ... ... ... ... 86 **, -1 88 **, -1 84 **, -1 0.95 **, -1 ... ... ... ... AnguillaLatin America and the Caribbean102 * 0.98 * 87 * ... ... ... 105 *, -1 100 *, -1 110 *, -1 1.10 *, -1 ... ... ... ... Antigua and Barbuda104 -1 1.04 -1 105 -1 103 -1 108 -1 1.05 -1 ... ... ... ... 94 -1 93 -1 96 -1 1.03 -1 Argentina131
T a b l e 4 PRIMARY EDUCATION / ISCED 1 / Measures of progression and completionRegionTotal numberof repeatersPercentageof repeatersSurvival rateto grade 5Survival rateto last gradeGross intake ratioto the last gradeCountry or territory2008 2008 2007 to 2008 2007 to 2008 2008MF (000) % F MF M F MF M F MF M F GPI MF M1 2 3 4 5 6 7 8 9 10 11 12 13 14Aruba 0.75 42 7 8 6 88 88 88 86 85 88 1.04 95 92Bahamas - ... - - - 92 92 93 91 90 92 1.03 95 93Barbados . . . * . * . * 96 * ... ... 94 * ... ... ... ... ...Belize 4.3 41 8 9 7 93 94 93 90 90 91 1.00 99 98Bermuda . -2 . -2 . -2 . -2 . -2 90 -2 ... ... 86 -2 ... ... ... 96 *, -2 ...Bolivia 38 -1 44 -1 2 -1 3 -1 2 -1 83 -1 83 -1 83 -1 80 -1 81 -1 80 -1 0.98 -1 98 -1 98 -1Brazil ... ... ... ... ... . . . ... ... ... ... ... ...British Virgin Islands 0.14 -1 29 -1 4 -1 6 -1 3 -1 ... ... ... ... ... ... ... 84 **, -1 **, -179Cayman Islands - ... - - - ... ... ... ... ... ... ... 89 **, -1 **, -173Chile 40 -1 36 -1 2 -1 3 -1 2 -1 96 -1 96 **, -1 97 **, -1 95 -1 ... ... ... 95 -1 **, -1101Colombia 184 42 3 4 3 88 ... ... 88 ... ... ... 110 109Costa Rica 38 40 7 8 6 96 95 98 94 93 96 1.04 93 91Cuba 3.7 +1 26 +1 - +1 1 +1 - +1 96 +1 96 +1 96 +1 96 +1 96 +1 96 +1 1.00 +1 98 +1 98 +1Dominica 0.32 30 4 5 2 94 97 91 91 91 90 0.99 81 * 78 *Dominican Republic 45 36 3 4 3 73 70 77 69 64 74 1.15 91 89Ecuador 50 ** 45 ** 2 ** 3 ** 2 ** 83 ** 83 ** 84 ** 81 ** 82 ** 81 ** 0.99 ** 106 ** 106 **El Salvador 61 40 6 7 5 80 78 82 76 74 78 1.05 89 88Grenada 0.40 33 3 4 2 ... ... ... ... ... ... ... 114 119Guatemala 311 44 12 13 11 71 71 70 65 65 64 0.98 80 83Guyana 0.79 41 1 1 1 ... ... ... ... ... ... ... 110 111Haiti ... ... ... ... ... ... ... ... ... ... ... ... ... ...Honduras 68 42 5 6 5 78 75 80 76 74 79 1.07 90 87Jamaica 9.6 42 3 3 3 ... ... ... ... ... ... ... 89 **, -1 **, -188Mexico 530 37 4 4 3 94 93 95 92 90 93 1.02 104 104Montserrat 0.02 -1 44 -1 3 -1 4 -1 3 -1 ... ... ... ... ... ... ... 69 *, -1 *, -151Netherlands Antilles ... ... ... ... ... ... ... ... ... ... ... ... ... ...Nicaragua 104 41 11 13 9 51 48 55 48 45 52 1.17 75 71Panama 24 39 5 6 4 87 87 88 85 85 86 1.01 102 102Paraguay 36 -1 39 -1 4 -1 5 -1 3 -1 84 -1 83 -1 84 -1 79 -1 78 -1 80 -1 1.03 -1 95 -1 94 -1Peru 276 47 7 7 7 87 87 88 83 82 84 1.02 101 101Saint Kitts and Nevis 0.10 30 2 2 1 82 82 82 68 68 69 1.02 ... ...Saint Lucia 0.50 33 2 3 2 97 95 99 ... ... ... ... 98 97Saint Vincent and the Grenadines 0.71 40 5 5 4 ... ... ... ... ... ... ... 109 114Suriname 12 40 17 20 14 80 -1 78 -1 81 -1 68 -1 63 -1 72 -1 1.13 -1 88 81Trinidad and Tobago 8.6 40 7 8 5 98 98 99 96 94 98 1.04 92 92Turks and Caicos Islands ... ... ... ... ... ... ... ... ... ... ... ... ... ...Uruguay 25 -1 39 -1 7 -1 8 -1 6 -1 94 -1 93 -1 96 -1 94 -1 92 -1 95 -1 1.04 -1 104 -1 102 -1Venezuela 116 36 3 4 3 84 82 87 81 78 83 1.07 95 94North America and Western EuropeAndorra 0.13 36 3 3 2 98 99 97 ... ... ... ... ... ...Austria - ... - - - . . . 98 97 99 1.02 99 99Belgium 25 47 3 4 3 91 90 92 87 86 88 1.03 86 84Canada - -2 ... - -2 - -2 - -2 ... ... ... ... ... ... ... 96 -2 96 -2Cyprus 0.25 44 - - - 99 97 100 98 97 100 1.03 100 * 101 *Denmark - -1 ... - -1 - -1 - -1 ... ... ... ... ... ... ... 101 -1 100 -1Finland 1.5 33 - 1 - 100 99 100 100 100 100 1.00 98 99132
G l o b a l e d u c a t i o n d i g e s t 2 0 1 0 C o m p a r i n g e d u c a t i o n s t a t i s t i c s a r o u n d t h e w o r l dGross intake ratioto the last gradeExpected gross intake ratioto the last gradeGross primarygraduation ratioTransition rate fromprimary to secondary(general programmes)2008 2008 2008 2007 to 2008RegionF GPI MF M F GPI MF M F GPI MF M F GPI15 16 17 18 19 20 21 22 23 24 25 26 27 2897 1.05 93 92 94 1.03 92 -1 90 -1 93 -1 1.04 -1 97 -1 95 -1 100 -1 1.06 -1 Aruba96 1.04 101 102 101 0.99 ... ... ... ... 100 100 100 1.00 Bahamas... ... ... ... ... ... ... ... ... ... 99 * ... ... ... Barbados100 1.02 103 105 101 0.96 98 97 99 1.03 90 89 92 1.03 Belize... ... 89 *, -2 ... ... ... ... ... ... ... 95 -2 ... ... ... Bermuda98 -1 1.00 -1 97 -1 98 -1 96 -1 0.98 -1 90 -1 90 -1 91 -1 1.02 -1 90 -1 90 -1 90 -1 0.99 -1 Bolivia... ... ... ... ... ... ... ... ... ... ... ... ... ... BrazilCountry or territory89 **, -1 1.13 **, -1 ... ... ... ... ... ... ... ... 95 -1 100 -1 91 -1 0.91 -1 British Virgin Islands108 **, -1 1.47 **, -1 ... ... ... ... 74 ** 70 ** 79 ** 1.13 ** 97 ... ... ... Cayman Islands88 **, -1 0.87 **, -1 98 -1 ... ... ... ... ... ... ... ... ... ... ... Chile112 1.03 110 ... ... ... 105 104 107 1.02 98 98 99 1.00 Colombia95 1.05 90 88 91 1.03 87 * 84 * 90 * 1.07 * 97 100 94 0.94 Costa Rica98 +1 1.00 +1 96 +1 95 +1 97 +1 1.02 +1 93 95 92 0.97 98 +1 99 +1 98 +1 1.00 +1 Cuba85 * 1.09 * 77 * 72 * 82 * 1.13 * 101 *, -1 114 *, -1 90 *, -1 0.79 *, -1 95 94 97 1.03 Dominica92 1.04 72 71 73 1.02 84 82 87 1.06 92 90 94 1.05 Dominican Republic105 ** 1.00 ** 105 ** 105 ** 106 ** 1.01 ** 103 -1 102 -1 104 -1 1.01 -1 79 -1 81 -1 77 -1 0.95 -1 Ecuador91 1.04 92 91 92 1.02 86 84 88 1.04 92 92 92 1.00 El Salvador110 0.93 ... ... ... ... 104 -1 102 -1 105 -1 1.03 -1 ... ... ... ... Grenada77 0.92 79 80 77 0.96 77 80 74 0.93 91 93 90 0.96 Guatemala109 0.98 ... ... ... ... ... ... ... ... 93 95 91 0.96 Guyana... ... ... ... ... ... ... ... ... ... ... ... ... ... Haiti93 1.07 94 93 96 1.03 84 81 87 1.07 71 -2 68 -2 74 -2 1.09 -2 Honduras90 **, -1 1.02 **, -1 ... ... ... ... ... ... ... ... ... ... ... ... Jamaica105 1.01 112 111 113 1.02 ... ... ... ... 94 94 93 0.99 Mexico97 *, -1 1.89 *, -1 ... ... ... ... 80 **, -1 61 **, -1 107 **, -1 1.77 **, -1 ... ... ... ... Montserrat... ... ... ... ... ... ... ... ... ... ... ... ... ... Netherlands Antilles78 1.11 74 71 78 1.10 70 66 75 1.13 ... ... ... ... Nicaragua102 1.00 91 92 91 0.99 100 100 101 1.01 99 98 99 1.01 Panama95 -1 1.02 -1 79 -1 80 -1 79 -1 1.00 -1 ... ... ... ... 87 -1 87 -1 88 -1 1.01 -1 Paraguay101 1.00 83 82 84 1.02 ... ... ... ... 93 94 93 0.98 Peru... ... ... ... ... ... 75 ** 76 ** 74 ** 0.97 ** ... ... ... ... Saint Kitts and Nevis98 1.02 ... ... ... ... 103 -2 103 -2 103 -2 1.00 -2 97 95 100 1.06 Saint Lucia105 0.92 ... ... ... ... 100 88 112 1.26 ... ... ... ... Saint Vincent and the Grenadines95 1.17 ... ... ... ... 87 86 88 1.02 53 46 59 1.27 Suriname92 1.00 92 91 94 1.04 82 77 88 1.13 90 88 92 1.04 Trinidad and Tobago... ... ... ... ... ... ... ... ... ... ... ... ... ... Turks and Caicos Islands105 -1 1.03 -1 97 -1 96 -1 99 -1 1.03 -1 ... ... ... ... 77 -1 71 -1 83 -1 1.18 -1 Uruguay97 1.02 82 81 84 1.04 94 92 96 1.04 95 95 96 1.00 Venezuela... ... ... ... ... ... ... ... ... ... ... ... ... ... Andorra98 0.99 100 101 100 0.99 ... ... ... ... 100 100 99 0.99 Austria88 1.05 85 83 87 1.05 ... ... ... ... 99 100 99 0.99 Belgium96 -2 1.00 -2 ... ... ... ... ... ... ... ... ... ... ... ... Canada100 * 0.99 * 109 * 110 * 108 * 0.98 * ... ... ... ... 100 100 100 1.00 Cyprus101 -1 1.01 -1 ... ... ... ... ... ... ... ... 97 -1 97 -1 96 -1 0.99 -1 Denmark97 0.98 100 101 99 0.98 ... ... ... ... 100 100 100 1.00 FinlandNorth America and Western Europe133
T a b l e 4 PRIMARY EDUCATION / ISCED 1 / Measures of progression and completionRegionTotal numberof repeatersPercentageof repeatersSurvival rateto grade 5Survival rateto last gradeGross intake ratioto the last gradeCountry or territory2008 2008 2007 to 2008 2007 to 2008 2008MF (000) % F MF M F MF M F MF M F GPI MF M1 2 3 4 5 6 7 8 9 10 11 12 13 14France ... ... ... ... ... ... ... ... ... ... ... ... ... ...Germany 41 46 1 1 1 . . . 96 95 96 1.01 104 103Gibraltar ... ... ... ... ... ... ... ... ... ... ... ... ... ...Greece 4.3 -1 42 -1 1 -1 1 -1 1 -1 98 -1 99 -1 98 -1 98 -1 98 -1 98 -1 1.00 -1 101 -1 102 -1Holy See . . . . . . . . . . . . . .Iceland - ... - - - 94 -1 ... ... 93 -1 ... ... ... 95 95Ireland 3.4 44 1 1 1 ... ... ... ... ... ... ... 99 99Israel 12 33 1 2 1 99 100 99 100 100 99 0.99 99 99Italy 6.9 -1 36 -1 - -1 - -1 - -1 100 -1 99 -1 100 -1 100 -1 99 -1 100 -1 1.01 -1 101 -1 101 -1Liechtenstein - ... - - - 82 80 84 82 80 84 1.05 97 * 99 *Luxembourg 1.4 46 4 4 4 98 97 100 86 84 89 1.06 84 83Malta 0.23 -1 50 -1 1 -1 1 -1 1 -1 ... ... ... ... ... ... ... 98 -1 99 -1Monaco ... ... ... ... ... ... ... ... ... ... ... ... ... ...Netherlands . . . . . 100 99 100 ... ... ... ... ... ...Norway - ... - - - 100 99 100 100 100 100 1.00 98 98Portugal ... ... ... ... ... ... ... ... ... ... ... ... ... ...San Marino - ... - - - ... ... ... ... ... ... ... ... ...Spain - ... - - - 100 -2 100 -2 100 -2 100 -2 100 -2 100 -2 1.00 -2 107 108Sweden - ... - - - 100 100 100 100 100 100 1.00 94 95Switzerland 7.5 45 1 2 1 ... ... ... ... ... ... ... 94 93United Kingdom - ... - - - ... ... ... ... ... ... ... ... ...United States of America - ... - - - 94 ... ... 99 ... ... ... 95 94South and West AsiaAfghanistan - ... - - - ... ... ... ... ... ... ... ... ...Bangladesh 2,105 * 50 * 13 * 13 * 13 * 55 -2 52 -2 58 -2 55 -2 52 -2 58 -2 1.10 -2 54 * 52 *Bhutan 7.2 +1 43 +1 7 +1 7 +1 6 +1 96 +1 93 +1 99 +1 90 +1 85 +1 95 +1 1.12 +1 88 +1 85 +1India 4,840 -1 47 -1 3 -1 3 -1 3 -1 66 -2 66 -2 65 -2 66 -2 66 -2 65 -2 0.99 -2 94 -1 95 -1Iran (Islamic Republic of) 127 38 2 3 1 ... ... ... ... ... ... ... 117 **, -1 **, -1108Maldives 2.0 35 4 5 3 94 95 93 ... ... ... ... 113 117Nepal 689 +2 50 +2 14 +2 14 +2 14 +2 62 60 64 62 60 64 1.07 95 +2 93 +2Pakistan 804 39 4 5 4 ... ... ... ... ... ... ... 60 67Sri Lanka 13 39 1 1 1 98 98 98 98 98 98 1.00 98 98Sub-Saharan AfricaAngola ... ... ... ... ... ... ... ... ... ... ... ... ... ...Benin 229 46 14 14 14 ... ... ... ... ... ... ... 65 75Botswana 15 -2 38 -2 5 -2 6 -2 4 -2 89 -2 89 -2 89 -2 87 -2 85 -2 89 -2 1.05 -2 99 -2 96 -2Burkina Faso 201 +1 46 +1 11 +1 11 +1 11 +1 82 +1 82 +1 83 +1 71 +1 71 +1 72 +1 1.01 +1 43 +1 46 +1Burundi 541 49 34 33 34 62 59 65 54 51 57 1.12 45 48Cameroon 538 44 17 17 16 63 63 63 57 57 56 0.98 73 79Cape Verde 8.8 38 12 14 9 91 90 92 87 86 88 1.03 92 90Central African Republic 145 +1 42 +1 24 +1 24 +1 24 +1 53 +1 57 +1 48 +1 46 +1 50 +1 40 +1 0.80 +1 38 +1 47 +1Chad 289 **, -1 43 **, -1 22 **, -1 21 **, -1 23 **, -1 38 -2 41 -2 34 -2 30 -2 33 -2 25 -2 0.74 -2 31 **, -1 **, -140Comoros 27 47 24 24 24 ... ... ... ... ... ... ... 81 91Congo 141 46 22 23 22 77 ** 76 ** 80 ** 70 ** 70 ** 71 ** 1.01 ** 73 75Côte d’Ivoire 425 45 18 18 18 94 ... ... 90 ... ... ... 48 57Democratic Republic of the Congo 1,530 46 15 15 16 80 80 79 79 82 76 0.93 53 63134
G l o b a l e d u c a t i o n d i g e s t 2 0 1 0 C o m p a r i n g e d u c a t i o n s t a t i s t i c s a r o u n d t h e w o r l dGross intake ratioto the last gradeExpected gross intake ratioto the last gradeGross primarygraduation ratioTransition rate fromprimary to secondary(general programmes)2008 2008 2008 2007 to 2008RegionF GPI MF M F GPI MF M F GPI MF M F GPI15 16 17 18 19 20 21 22 23 24 25 26 27 28... ... ... ... ... ... ... ... ... ... ... ... ... ... France104 1.00 95 95 95 1.00 ... ... ... ... 99 99 99 1.00 Germany... ... ... ... ... ... ... ... ... ... ... ... ... ... Gibraltar101 -1 0.99 -1 101 -1 101 -1 101 -1 1.00 -1 ... ... ... ... 97 -1 ... ... ... Greece. . . . . . . . . . . . . . Holy See94 0.99 ... ... ... ... ... ... ... ... 100 100 100 1.00 Iceland99 1.00 ... ... ... ... ... ... ... ... ... ... ... ... Ireland100 1.01 99 98 99 1.02 ... ... ... ... 71 71 70 0.99 Israel100 -1 0.99 -1 108 -1 108 -1 108 -1 0.99 -1 ... ... ... ... 100 -1 100 -1 99 -1 0.99 -1 ItalyCountry or territory95 * 0.97 * 101 * 101 * 101 * 1.00 * ... ... ... ... 99 100 97 0.97 Liechtenstein85 1.03 85 80 90 1.12 ... ... ... ... ... ... ... ... Luxembourg98 -1 0.99 -1 ... ... ... ... ... ... ... ... ... ... ... ... Malta... ... ... ... ... ... ... ... ... ... ... ... ... ... Monaco... ... ... ... ... ... ... ... ... ... ... ... ... ... Netherlands97 1.00 102 102 103 1.01 ... ... ... ... 100 100 100 1.00 Norway... ... ... ... ... ... ... ... ... ... ... ... ... ... Portugal... ... ... ... ... ... ... ... ... ... ... ... ... ... San Marino106 0.99 ... ... ... ... ... ... ... ... ... ... ... ... Spain94 0.99 107 107 106 0.99 ... ... ... ... 100 100 100 1.00 Sweden95 1.02 ... ... ... ... ... ... ... ... 99 ... ... ... Switzerland... ... ... ... ... ... ... ... ... ... ... ... ... ... United Kingdom97 1.03 104 ... ... ... ... ... ... ... ... ... ... ... United States of AmericaSouth and West Asia... ... ... ... ... ... ... ... ... ... ... ... ... ... Afghanistan57 * 1.10 * ... ... ... ... 50 * 49 * 52 * 1.07 * 97 -2 95 -2 100 -2 1.06 -2 Bangladesh92 +1 1.09 +1 102 +1 95 +1 109 +1 1.15 +1 91 +1 88 +1 95 +1 1.08 +1 98 +1 95 +1 100 +1 1.05 +1 Bhutan92 -1 0.96 -1 ... ... ... ... ... ... ... ... 85 -1 86 -1 84 -1 0.98 -1 India126 **, -1 1.16 **, -1 ... ... ... ... 94 -1 95 -1 94 -1 0.99 -1 79 ** 84 ** 74 ** 0.88 ** Iran (Islamic Republic of)109 0.93 ... ... ... ... ... ... ... ... 87 83 92 1.10 Maldives98 +2 1.05 +2 ... ... ... ... ... ... ... ... 81 81 81 1.00 Nepal53 0.80 ... ... ... ... 46 -1 53 -1 40 -1 0.75 -1 73 73 71 0.97 Pakistan99 1.01 96 95 97 1.02 ... ... ... ... 98 97 99 1.01 Sri Lanka... ... ... ... ... ... ... ... ... ... ... ... ... ... Angola55 0.73 ... ... ... ... ... ... ... ... 71 -2 72 -2 70 -2 0.97 -2 Benin102 -2 1.07 -2 100 -2 99 -2 101 -2 1.02 -2 114 -2 ... ... ... 98 -2 98 -2 98 -2 1.00 -2 BotswanaSub-Saharan Africa40 +1 0.86 +1 62 +1 64 +1 60 +1 0.94 +1 27 -1 30 -1 23 -1 0.77 -1 49 +1 52 +1 45 +1 0.88 +1 Burkina Faso42 0.87 77 75 80 1.06 22 -2 31 -2 13 -2 0.42 -2 31 -1 ... ... ... Burundi67 0.84 67 73 62 0.85 59 62 56 0.90 48 46 50 1.07 Cameroon94 1.05 73 72 74 1.02 91 -2 87 -2 94 -2 1.09 -2 86 84 87 1.04 Cape Verde29 +1 0.61 +1 44 +1 55 +1 34 +1 0.62 +1 ... ... ... ... 45 +1 45 +1 45 +1 1.00 +1 Central African Republic22 **, -1 0.54 **, -1 ... ... ... ... 21 -2 29 -2 14 -2 0.47 -2 64 **, -1 64 **, -1 65 **, -1 1.03 **, -1 Chad71 0.78 ... ... ... ... 44 -1 ... ... ... ... ... ... ... Comoros71 0.95 72 ** 75 ** 70 ** 0.93 ** 65 -2 67 -2 64 -2 0.95 -2 63 ** 63 ** 63 ** 0.99 ** Congo39 0.69 70 ... ... ... ... ... ... ... 47 50 43 0.85 Côte d’Ivoire44 0.69 93 86 97 1.13 33 -1 40 -1 25 -1 0.64 -1 80 * 83 * 76 * 0.92 * Democratic Republic of the Congo135
T a b l e 4 PRIMARY EDUCATION / ISCED 1 / Measures of progression and completionRegionTotal numberof repeatersPercentageof repeatersSurvival rateto grade 5Survival rateto last gradeGross intake ratioto the last gradeCountry or territory2008 2008 2007 to 2008 2007 to 2008 2008MF (000) % F MF M F MF M F MF M F GPI MF M1 2 3 4 5 6 7 8 9 10 11 12 13 14Equatorial Guinea 20 -1 47 -1 24 -1 25 -1 23 -1 ... ... ... ... ... ... ... 52 -1 53 -1Eritrea 48 43 15 16 15 73 77 69 73 77 69 0.89 47 52Ethiopia 632 43 5 5 5 47 46 49 40 39 42 1.09 52 56Gabon ... ... ... ... ... ... ... ... ... ... ... ... ... ...Gambia 12 50 5 6 5 72 ** 71 ** 72 ** 70 ** 68 ** 72 ** 1.06 ** 79 76Ghana 236 45 7 7 6 ... ... ... ... ... ... ... 82 84Guinea 211 46 15 15 16 70 74 65 55 60 49 0.83 55 62Guinea-Bissau 50 -2 ... 19 -2 ... ... ... ... ... ... ... ... ... ... ...Kenya ... ... ... ... ... ... ... ... ... ... ... ... ... ...Lesotho 84 -1 42 -1 21 -1 24 -1 18 -1 62 -1 55 -1 69 -1 46 -1 37 -1 56 -1 1.51 -1 73 -1 62 -1Liberia 36 48 7 6 7 ... ... ... ... ... ... ... 58 63Madagascar 790 47 20 21 19 42 42 43 42 42 43 1.03 71 71Malawi 642 49 20 21 20 43 -1 44 -1 43 -1 36 -1 37 -1 35 -1 0.94 -1 54 -1 54 -1Mali 258 +1 46 +1 13 +1 13 +1 14 +1 87 +1 88 +1 85 +1 79 +1 81 +1 77 +1 0.95 +1 59 +1 67 +1Mauritius 4.3 +1 41 +1 4 +1 4 +1 3 +1 99 +1 97 +1 100 +1 98 +1 96 +1 100 +1 1.04 +1 89 +1 89 +1Mozambique 270 45 6 6 5 60 63 58 44 46 42 0.91 59 67Namibia 74 39 18 22 14 87 -2 84 -2 90 -2 77 -2 73 -2 80 -2 1.10 -2 81 76Niger 78 +1 44 +1 5 +1 5 +1 5 +1 69 +1 72 +1 66 +1 67 +1 69 +1 64 +1 0.92 +1 40 +1 47 +1Nigeria 625 **, -1 48 **, -1 3 **, -1 3 **, -1 3 **, -1 ... ... ... ... ... ... ... ... ...Rwanda 388 51 18 18 18 ... ... ... ... ... ... ... 54 52Sao Tome and Principe 7.9 46 24 26 23 79 82 75 74 77 71 0.93 85 +1 ...Senegal 124 50 8 8 8 71 70 72 58 57 60 1.04 56 57Seychelles . +1 . +1 . +1 . +1 . +1 98 +1 100 +1 96 +1 98 +1 ... ... ... 120 * 116 *Sierra Leone 131 -1 49 -1 10 -1 10 -1 10 -1 ... ... ... ... ... ... ... 88 -1 101 -1Somalia ... ... ... ... ... ... ... ... ... ... ... ... ... ...South Africa 582 **, -1 46 **, -1 8 **, -1 8 **, -1 8 **, -1 ... ... ... ... ... ... ... 86 **, -1 **, -186Swaziland 42 -1 41 -1 18 -1 21 -1 15 -1 82 -1 76 -1 88 -1 74 -1 71 -1 76 -1 1.07 -1 72 -1 75 -1Togo 266 +1 47 +1 23 +1 23 +1 22 +1 54 -1 58 -1 50 -1 45 -1 49 -1 39 -1 0.80 -1 61 +1 71 +1Uganda 872 49 11 11 11 59 -1 59 **, -1 59 **, -1 32 -1 34 **, -1 31 **, -1 0.91 **, -1 56 57 **United Republic of Tanzania 351 -1 49 -1 4 -1 4 -1 4 -1 87 **, -1 85 **, -1 89 **, -1 83 **, -1 81 **, -1 85 **, -1 1.05 **, -1 83 **, -1 **, -184Zambia 171 47 6 6 6 90 92 88 79 82 75 0.90 93 98Zimbabwe ... ... ... ... ... ... ... ... ... ... ... ... ... ...Please refer to the Reader’s Guide for more information on the data and symbols used in each table.136
G l o b a l e d u c a t i o n d i g e s t 2 0 1 0 C o m p a r i n g e d u c a t i o n s t a t i s t i c s a r o u n d t h e w o r l dGross intake ratioto the last gradeExpected gross intake ratioto the last gradeGross primarygraduation ratioTransition rate fromprimary to secondary(general programmes)2008 2008 2008 2007 to 2008RegionF GPI MF M F GPI MF M F GPI MF M F GPI15 16 17 18 19 20 21 22 23 24 25 26 27 28Country or territory51 -1 0.95 -1 ... ... ... ... ... ... ... ... ... ... ... ... Equatorial Guinea42 0.80 30 34 25 0.75 48 -1 54 -1 42 -1 0.78 -1 83 84 81 0.96 Eritrea48 0.86 62 63 61 0.97 43 48 39 0.81 88 88 89 1.00 Ethiopia... ... ... ... ... ... ... ... ... ... ... ... ... ... Gabon83 1.09 66 ** 62 ** 70 ** 1.12 ** ... ... ... ... 84 ** 84 ** 84 ** 1.00 ** Gambia80 0.95 ... ... ... ... 88 90 85 0.94 98 97 98 1.01 Ghana47 0.75 51 58 43 0.75 47 -1 56 -1 39 -1 0.69 -1 31 34 26 0.75 Guinea... ... ... ... ... ... ... ... ... ... ... ... ... ... Guinea-Bissau... ... ... ... ... ... ... ... ... ... ... ... ... ... Kenya84 -1 1.36 -1 45 -1 37 -1 52 -1 1.42 -1 58 -2 ... ... ... 67 -1 68 -1 66 -1 0.97 -1 Lesotho53 0.84 ... ... ... ... ... ... ... ... ... ... ... ... Liberia71 1.00 79 79 80 1.01 51 51 50 0.98 60 61 59 0.97 Madagascar55 -1 1.02 -1 49 -1 49 -1 49 -1 1.01 -1 32 38 26 0.67 77 79 75 0.96 Malawi52 +1 0.77 +1 76 +1 83 +1 68 +1 0.82 +1 50 59 42 0.72 70 +1 72 +1 68 +1 0.95 +1 Mali90 +1 1.01 +1 97 +1 95 +1 99 +1 1.05 +1 76 +1 72 +1 81 +1 1.14 +1 69 +1 64 +1 75 +1 1.16 +1 Mauritius52 0.78 70 75 65 0.86 46 40 52 1.30 57 56 60 1.08 Mozambique86 1.13 ... ... ... ... ... ... ... ... 78 76 79 1.04 Namibia34 +1 0.72 +1 60 +1 67 +1 53 +1 0.78 +1 21 +1 26 +1 16 +1 0.63 +1 47 +1 49 +1 44 +1 0.90 +1 Niger... ... ... ... ... ... 76 -1 83 -1 69 -1 0.84 -1 ... ... ... ... Nigeria56 1.07 ... ... ... ... ... ... ... ... ... ... ... ... Rwanda... ... ... ... ... ... ... ... ... ... 50 +1 ... ... ... Sao Tome and Principe56 0.98 58 56 61 1.09 43 ... ... ... 62 65 58 0.89 Senegal124 * 1.07 * 129 * ... ... ... ... ... ... ... 98 +1 99 +1 98 +1 0.99 +1 Seychelles75 -1 0.74 -1 ... ... ... ... ... ... ... ... ... ... ... ... Sierra Leone... ... ... ... ... ... ... ... ... ... ... ... ... ... Somalia86 **, -1 1.00 **, -1 ... ... ... ... ... ... ... ... 94 **, -1 93 **, -1 94 **, -1 1.01 **, -1 South Africa69 -1 0.93 -1 76 -1 75 -1 77 -1 1.03 -1 ... ... ... ... 89 -2 90 -2 87 -2 0.96 -2 Swaziland52 +1 0.73 +1 ... ... ... ... 53 +1 63 +1 42 +1 0.67 +1 53 -1 56 -1 49 -1 0.87 -1 Togo55 ** 0.97 ** ... ... ... ... 44 46 42 0.91 61 63 ** 60 ** 0.96 ** Uganda81 **, -1 0.96 **, -1 88 **, -1 86 **, -1 90 **, -1 1.04 **, -1 ... ... ... ... 46 **, -2 47 **, -2 45 **, -2 0.96 **, -2 United Republic of Tanzania88 0.89 98 101 95 0.94 105 112 97 0.87 56 ** 55 ** 58 ** 1.05 ** Zambia... ... ... ... ... ... ... ... ... ... ... ... ... ... Zimbabwe137
T a b l e5 SECONDARY EDUCATION / ISCED 2 and 3 / Enrolment and repeaters / 2008RegionCountry or territoryArab StatesEducationsystemSecondary (ISCED 2-3)general programmesTotal secondary (ISCED 2-3)all programmesEntranceage Duration MF (000) % F % PrivateEnrolmentEnrolment in technical and vocationalprogrammes (%)Totalsecondary(ISCED 2-3)Lowersecondary(ISCED 2)Gross enrolment ratioLower secondary (ISCED 2)all programmesUppersecondary(ISCED 3) MF M F GPI1 2 3 4 5 6 7 8 9 10 11 12Algeria 12 7 ... ... ... ... ... ... ... ... ... ...Bahrain 12 6 78 50 19 16 . 33 101 102 101 0.99Djibouti 12 7 41 41 12 5 1 16 37 43 31 0.72Egypt 12 6 ... ... ... ... ... ... ... ... ... ...Iraq 12 6 ... ... ... ... ... ... ... ... ... ...Jordan 12 6 700 50 18 4 . 15 95 94 96 1.02Kuwait 11 7 250 49 29 2 1 3 96 96 96 1.00Lebanon 12 6 391 +1 52 +1 59 +1 16 +1 5 +1 29 +1 89 +1 85 +1 92 +1 1.09 +1Libyan Arab Jamahiriya 12 7 733 -2 53 -2 2 -2 ... ... ... 116 -2 117 -2 115 -2 0.99 -2Mauritania 12 6 102 **, -1 46 **, -1 ... 3 *, -2 2 -2 5 *, -2 26 **, -1 28 **, -1 23 **, -1 **, -10.85Morocco 12 6 2,173 -1 46 **, -1 ... 6 -1 2 -1 12 -1 74 -1 81 **, -1 68 **, -1 **, -10.84Oman 12 6 307 48 2 . . . 88 89 88 0.98Palestinian Autonomous Territories 10 8 708 51 ** 5 1 ** . 5 ** 93 91 95 1.05Qatar 12 6 66 49 38 1 . 2 113 106 121 1.15Saudi Arabia 12 6 2,885 46 ** 13 3 6 1 98 105 91 0.86Sudan 12 5 1,837 +1 46 +1 12 +1 2 +1 . +1 4 +1 53 +1 57 +1 48 +1 0.83 +1Syrian Arab Republic 10 8 2,626 48 4 4 . 21 98 100 96 0.97Tunisia 12 7 1,259 51 5 11 11 10 118 119 117 0.98United Arab Emirates 11 7 311 **, -1 49 **, -1 49 **, -1 - -2 . -2 1 -2 101 -1 101 -1 100 -1 0.98 -1Yemen 12 6 ... ... ... ... . ... 51 63 37 0.59Central and Eastern EuropeAlbania 10 8 ... ... ... ... ... ... ... ... ... ...Belarus 10 7 823 -1 49 -1 - -1 1 -1 . -1 3 -1 107 -1 109 -1 105 -1 0.97 -1Bosnia and Herzegovina 10 8 339 49 ... 35 . 75 105 104 106 1.01Bulgaria 11 8 593 48 1 30 1 52 86 89 84 0.95Croatia 11 8 393 -1 50 -1 1 -1 38 -1 6 -1 73 -1 100 -1 99 -1 101 -1 1.03 -1Czech Republic 11 8 904 49 10 39 - 74 99 99 99 1.00Estonia 13 6 106 49 3 18 1 32 102 105 100 0.95Hungary 11 8 924 48 12 14 1 27 99 100 98 0.98Latvia 13 6 183 50 1 19 1 35 101 103 99 0.96Lithuania 11 8 377 49 1 10 3 28 100 100 99 0.98Montenegro 11 8 ... ... ... ... ... ... ... ... ... ...Poland 13 6 3,206 -1 48 -1 3 -1 24 -1 - -1 47 -1 100 -1 101 -1 100 -1 0.98 -1Republic of Moldova 11 7 345 50 1 11 . 35 90 * 90 * 90 * 0.99 *Romania 11 8 1,934 49 1 34 . 65 102 102 101 0.99Russian Federation 11 7 10,087 48 1 17 . 47 85 85 85 1.01Serbia 11 8 608 49 - 36 . 76 97 * 97 * 96 * 1.00 *Slovakia 10 9 591 49 9 35 1 72 94 94 93 0.98Slovenia 12 7 147 48 1 36 . 60 96 96 95 1.00The former Yugoslav Rep. of Macedonia 11 8 204 48 - 28 . 60 92 92 92 1.00Turkey 11 6 6,709 46 ... 18 . 40 91 95 87 0.92Ukraine 10 7 3,499 48 * - 8 . 25 96 96 * 96 * 1.00 *Central AsiaArmenia 10 7 309 49 1 1 . 3 95 94 95 1.01Azerbaijan 10 7 1,114 +1 49 +1 13 +1 16 +1 . +1 43 +1 93 +1 96 +1 90 +1 0.94 +1138
G l o b a l e d u c a t i o n d i g e s t 2 0 1 0 C o m p a r i n g e d u c a t i o n s t a t i s t i c s a r o u n d t h e w o r l dUpper secondary (ISCED 3)all programmesGross enrolment ratioTotal secondary (ISCED 2-3)all programmesNet enrolment rateTotal secondary (ISCED 2-3)all programmesPercentageof repeatersTotal secondary (ISCED 2-3)general programmesRegionMF M F GPI MF M F GPI MF M F GPI MF M F13 14 15 16 17 18 19 20 21 22 23 24 25 26 27... ... ... ... ... ... ... ... ... ... ... ... 13 **, -1 16 **, -1 10 **, -1 Algeria92 88 97 1.10 97 95 99 1.04 89 87 92 1.05 5 ** 6 ** 3 ** BahrainCountry or territoryArab States19 23 15 0.63 30 35 24 0.70 22 ** 25 ** 18 ** 0.71 ** 6 6 5 Djibouti... ... ... ... ... ... ... ... ... ... ... ... ... ... ... Egypt... ... ... ... ... ... ... ... ... ... ... ... ... ... ... Iraq74 71 78 1.09 88 87 90 1.04 82 80 84 1.05 1 2 1 Jordan81 77 84 1.09 90 88 91 1.04 80 **, -1 80 **, -1 80 **, -1 1.01 **, -1 8 9 6 Kuwait75 +1 70 +1 80 +1 1.14 +1 82 +1 78 +1 87 +1 1.11 +1 75 +1 71 +1 79 +1 1.11 +1 9 +1 10 +1 9 +1 Lebanon77 -2 65 -2 91 -2 1.41 -2 93 -2 86 -2 101 -2 1.17 -2 ... ... ... ... ... ... ... Libyan Arab Jamahiriya23 **, -1 24 **, -1 22 **, -1 0.93 **, -1 24 **, -1 26 **, -1 23 **, -1 0.89 **, -1 16 **, -1 17 **, -1 15 **, -1 0.88 **, -1 11 +1 11 +1 12 +1 Mauritania38 -1 40 **, -1 36 **, -1 0.90 **, -1 56 -1 60 **, -1 51 **, -1 0.86 **, -1 ... ... ... ... 16 19 12 Morocco88 90 86 0.95 88 90 87 0.97 78 79 78 0.99 2 2 1 Oman79 72 86 1.19 90 87 93 1.07 87 ** 85 ** 90 ** 1.07 ** 2 2 2 Palestinian Autonomous Territories78 61 109 1.79 93 79 115 1.46 79 67 98 1.47 3 3 3 Qatar91 99 ** 84 ** 0.85 ** 95 102 ** 87 ** 0.85 ** 73 *, -1 70 **, -1 76 **, -1 1.08 **, -1 4 5 3 Saudi Arabia28 +1 28 +1 27 +1 0.95 +1 38 +1 40 +1 36 +1 0.88 +1 ... ... ... ... 3 3 2 Sudan35 34 35 1.04 74 75 73 0.98 68 68 67 0.98 6 8 5 Syrian Arab Republic74 67 81 1.21 92 88 96 1.08 71 67 76 1.13 17 20 15 Tunisia84 **, -1 81 **, -1 87 **, -1 1.07 **, -1 94 **, -1 93 **, -1 95 **, -1 1.02 **, -1 84 **, -1 83 **, -1 85 **, -1 1.02 **, -1 5 -1 7 -1 3 -1 United Arab Emirates... ... ... ... ... ... ... ... ... ... ... ... 6 7 4 Yemen... ... ... ... ... ... ... ... ... ... ... ... ... ... ... Albania72 -1 66 -1 79 -1 1.21 -1 95 -1 94 -1 96 -1 1.02 -1 87 -1 ... ... ... - -1 - -1 - -1 BelarusCentral and Eastern Europe77 76 79 1.03 90 89 91 1.02 ... ... ... ... - ... ... Bosnia and Herzegovina90 91 89 0.98 89 90 87 0.96 83 85 82 0.97 2 2 1 Bulgaria88 -1 86 -1 89 -1 1.04 -1 94 -1 92 -1 95 -1 1.03 -1 88 **, -2 87 **, -2 89 **, -2 1.02 **, -2 - -1 1 -1 - -1 Croatia91 90 92 1.03 95 94 96 1.01 ... ... ... ... 1 1 1 Czech Republic97 92 102 1.10 99 98 101 1.03 90 88 91 1.03 4 4 3 Estonia96 96 95 0.99 97 98 97 0.98 91 91 91 0.99 3 4 2 Hungary96 92 100 1.09 98 97 99 1.03 ... ... ... ... 5 7 3 Latvia98 95 100 1.06 99 99 99 1.00 92 91 92 1.02 1 2 1 Lithuania... ... ... ... ... ... ... ... ... ... ... ... ... ... ... Montenegro99 -1 99 -1 99 -1 1.00 -1 100 -1 100 -1 99 -1 0.99 -1 94 -1 93 -1 95 -1 1.02 -1 2 -1 4 -1 1 -1 Poland83 * 78 * 88 * 1.13 * 88 * 86 * 89 * 1.03 * 83 * 82 * 85 * 1.04 * - - - Republic of Moldova84 84 83 0.99 92 92 91 0.99 73 74 72 0.97 2 3 1 Romania84 88 80 0.91 85 86 84 0.97 ... ... ... ... - ... ... Russian Federation81 * 79 * 83 * 1.06 * 89 * 87 * 90 * 1.03 * 88 * 87 * 89 * 1.03 * 1 1 1 Serbia90 89 92 1.04 92 92 93 1.01 ... ... ... ... 2 2 1 Slovakia98 98 97 0.99 97 97 97 0.99 91 91 92 1.01 1 ... ... Slovenia76 79 73 0.93 84 85 82 0.97 ... ... ... ... - 1 - The former Yugoslav Rep. of Macedonia72 78 66 0.85 82 87 77 0.89 74 77 70 0.91 6 7 4 Turkey91 94 * 88 * 0.94 * 94 95 * 94 * 0.98 * 85 84 * 85 * 1.01 * - - * - * UkraineCentral Asia75 70 80 1.14 88 86 90 1.05 86 -1 83 -1 88 -1 1.06 -1 - - - Armenia113 +1 107 +1 119 +1 1.12 +1 99 +1 99 +1 99 +1 1.00 +1 93 +1 92 +1 93 +1 1.00 +1 1 +1 1 +1 1 +1 Azerbaijan139
T a b l e5 SECONDARY EDUCATION / ISCED 2 and 3 / Enrolment and repeaters / 2008RegionCountry or territoryEducationsystemSecondary (ISCED 2-3)general programmesTotal secondary (ISCED 2-3)all programmesEntranceage Duration MF (000) % F % PrivateEnrolmentEnrolment in technical and vocationalprogrammes (%)Totalsecondary(ISCED 2-3)Lowersecondary(ISCED 2)Gross enrolment ratioLower secondary (ISCED 2)all programmesUppersecondary(ISCED 3) MF M F GPI1 2 3 4 5 6 7 8 9 10 11 12Georgia 12 5 305 49 5 1 . 1 90 93 88 0.95Kazakhstan 11 7 1,741 +1 48 +1 1 +1 6 +1 . +1 26 +1 112 +1 111 +1 112 +1 1.01 +1Kyrgyzstan 11 7 697 * 49 * 1 * 3 * . 13 * 92 92 93 1.01Mongolia 12 6 328 52 6 9 . 26 96 94 99 1.05Tajikistan 11 7 1,019 46 . 2 . 10 95 99 91 0.92Turkmenistan 10 7 ... ... ... ... ... ... ... ... ... ...Uzbekistan 11 7 4,497 49 . 27 . 81 96 97 96 0.98East Asia and the PacificAustralia 12 6 2,538 47 29 40 20 61 114 113 114 1.01Brunei Darussalam 12 7 47 49 13 7 . 15 116 118 113 0.96Cambodia 12 6 875 -1 44 -1 2 -1 2 -1 - -1 8 -1 56 -1 60 -1 52 -1 0.87 -1China 12 6 101,448 48 9 19 - 43 92 90 95 1.05Cook Islands 11 7 2.0 -1 50 -1 15 -1 . -1 . -1 . -1 ... ... ... ...Democratic People’s Republic of Korea 10 6 ... ... ... ... ... ... ... ... ... ...Fiji 12 7 99 50 92 3 . 11 94 92 96 1.05Hong Kong SAR of China 12 7 514 49 15 1 . 3 96 96 96 1.00Indonesia 13 6 18,315 49 43 15 . 37 89 89 90 1.01Japan 12 6 7,356 49 19 12 . 24 102 102 102 1.00Kiribati 12 6 12 51 ... - . - ... ... ... ...Lao People’s Democratic Republic 11 6 412 44 2 1 - 1 53 58 47 0.82Macao, China 12 6 39 +1 49 +1 95 +1 3 +1 . +1 6 +1 111 +1 114 +1 107 +1 0.94 +1Malaysia 12 7 2,499 -1 51 -1 ... 6 -1 . -1 15 -1 93 -1 92 -1 93 -1 1.00 -1Marshall Islands 12 6 5.4 -1 49 -1 ... 4 -1 . -1 6 -1 82 *, -1 82 *, -1 83 *, -1 *, -11.01Micronesia (Federated States of) 12 6 15 **, -1 ... ... ... ... ... 100 -1 100 -1 99 -1 0.99 -1Myanmar 10 6 2,829 ... . - . - 60 60 60 0.99Nauru 12 6 0.82 51 ... . -1 . -1 . -1 ... ... ... ...New Zealand 11 7 515 50 20 ... . ... 104 104 104 0.99Niue 11 6 ... ... ... ... ... ... ... ... ... ...Palau 11 7 2.4 -1 50 **, -1 28 -1 . -1 . -1 . -1 98 *, -1 ... ... ...Papua New Guinea 13 6 ... ... ... ... ... ... ... ... ... ...Philippines 12 4 6,509 51 ... . . . 88 86 91 1.07Republic of Korea 12 6 3,959 47 32 12 . 25 99 101 96 0.95Samoa 11 7 25 +1 51 20 . +1 . +1 . +1 96 +1 95 +1 97 +1 1.02 +1Singapore 12 4 231 48 6 12 12 11 ... ... ... ...Solomon Islands 12 7 27 -1 44 -1 27 -1 . -1 . -1 . -1 54 -1 56 -1 51 -1 0.90 -1Thailand 12 6 4,769 +1 51 +1 16 +1 16 +1 . +1 39 +1 90 +1 90 +1 91 +1 1.02 +1Timor-Leste 12 6 ... ... ... ... . ... 55 55 56 1.02Tokelau 11 5 ... ... ... ... ... ... ... ... ... ...Tonga 11 6 14 -2 48 -2 ... ... ... ... 108 -2 109 -2 108 -2 0.99 -2Tuvalu 12 6 ... ... ... ... ... ... ... ... ... ...Vanuatu 12 7 ... ... ... ... ... ... ... ... ... ...Viet Nam 11 7 9,543 50 ** ... 6 . 17 ... ... ... ...Latin America and the CaribbeanAnguilla 12 5 1.0 50 . ... . ... 79 ** 84 ** 74 ** 0.89 **Antigua and Barbuda 12 5 8.6 50 ... 6 6 7 131 * 145 * 118 * 0.81 *Argentina 12 6 3,483 -1 52 -1 28 -1 35 -1 . -1 90 -1 103 -1 100 -1 106 -1 1.06 -1140
G l o b a l e d u c a t i o n d i g e s t 2 0 1 0 C o m p a r i n g e d u c a t i o n s t a t i s t i c s a r o u n d t h e w o r l dUpper secondary (ISCED 3)all programmesGross enrolment ratioTotal secondary (ISCED 2-3)all programmesNet enrolment rateTotal secondary (ISCED 2-3)all programmesPercentageof repeatersTotal secondary (ISCED 2-3)general programmesRegionMF M F GPI MF M F GPI MF M F GPI MF M F13 14 15 16 17 18 19 20 21 22 23 24 25 26 2790 91 88 0.97 90 92 88 0.96 81 -1 82 **, -1 79 **, -1 0.96 **, -1 - - - GeorgiaCountry or territory74 +1 78 +1 70 +1 0.89 +1 99 +1 101 +1 98 +1 0.98 +1 89 +1 88 +1 89 +1 1.01 +1 - +1 - +1 - +1 Kazakhstan68 * 67 * 69 * 1.02 * 85 * 85 * 86 * 1.01 * 80 80 81 1.01 - - - Kyrgyzstan93 87 99 1.13 95 92 99 1.08 82 79 85 1.08 - - - Mongolia59 69 48 0.70 84 90 78 0.87 83 88 77 0.88 - ... ... Tajikistan... ... ... ... ... ... ... ... ... ... ... ... ... ... ... Turkmenistan114 114 113 0.99 101 102 101 0.98 91 92 90 0.98 - - - Uzbekistan219 231 207 0.90 149 153 146 0.95 88 87 89 1.02 ... ... ... AustraliaEast Asia and the Pacific82 78 86 1.10 97 96 98 1.02 88 87 90 1.04 9 11 6 Brunei Darussalam23 -1 27 -1 19 -1 0.70 -1 40 -1 44 -1 36 -1 0.82 -1 34 **, -1 36 **, -1 32 **, -1 0.88 **, -1 2 3 1 Cambodia62 60 64 1.07 76 74 78 1.05 ... ... ... ... - - - China... ... ... ... ... ... ... ... ... ... ... ... ... ... ... Cook Islands... ... ... ... ... ... ... ... ... ... ... ... ... ... ... Democratic People’s Republic of Korea62 59 66 1.12 81 78 84 1.07 79 -2 76 -2 83 -2 1.10 -2 ... ... ... Fiji73 71 75 1.05 83 82 84 1.02 75 * 74 * 76 * 1.03 * 5 5 4 Hong Kong SAR of China60 61 59 0.97 74 75 74 0.99 68 69 68 0.99 - 1 - Indonesia100 100 100 1.00 101 101 101 1.00 98 98 98 1.00 ... ... ... Japan... ... ... ... ... ... ... ... ... ... ... ... ... ... ... Kiribati34 38 30 0.78 44 48 39 0.81 36 **, -1 39 **, -1 33 **, -1 0.87 **, -1 2 2 1 Lao People’s Democratic Republic77 +1 77 +1 76 +1 0.99 +1 92 +1 94 +1 90 +1 0.96 +1 76 +1 76 +1 76 +1 1.00 +1 12 +1 15 +1 9 +1 Macao, China49 -1 46 -1 53 -1 1.17 -1 68 -1 66 -1 71 -1 1.07 -1 68 -1 66 -1 70 -1 1.07 -1 ... ... ... Malaysia59 *, -1 59 *, -1 60 *, -1 1.02 *, -1 66 *, -1 66 *, -1 67 *, -1 1.02 *, -1 45 *, -1 43 *, -1 47 *, -1 1.08 *, -1 . -1 . -1 . -1 Marshall Islands... ... ... ... 91 **, -1 ... ... ... ... ... ... ... ... ... ... Micronesia (Federated States of)38 ... ... ... 53 ... ... ... 49 … … … 3 -1 3 -1 3 -1 Myanmar... ... ... ... 52 ** 47 ** 58 ** 1.23 ** ... ... ... ... ... ... ... Nauru137 130 145 1.12 119 115 122 1.05 ... ... ... ... ... ... ... New Zealand... ... ... ... ... ... ... ... ... ... ... ... ... ... ... Niue96 *, -1 97 *, -1 96 *, -1 0.99 *, -1 97 *, -1 98 **, -1 96 **, -1 0.97 **, -1 ... ... ... ... ... ... ... Palau... ... ... ... ... ... ... ... ... ... ... ... ... ... ... Papua New Guinea65 59 71 1.20 82 79 86 1.09 61 55 66 1.19 3 -1 4 -1 1 -1 Philippines96 97 94 0.98 97 99 95 0.96 95 97 94 0.96 - - - Republic of Korea67 +1 61 +1 74 +1 1.21 +1 76 +1 72 +1 81 +1 1.13 +1 71 +1 66 +1 75 +1 1.13 +1 2 +1 3 +1 2 +1 Samoa... ... ... ... ... ... ... ... ... ... ... ... 2 2 1 Singapore19 -1 22 -1 16 -1 0.72 -1 35 -1 38 -1 32 -1 0.84 -1 30 -1 32 -1 29 -1 0.90 -1 ... ... ... Solomon Islands62 +1 56 +1 67 +1 1.20 +1 76 +1 73 +1 79 +1 1.09 +1 72 +1 68 +1 77 +1 1.13 +1 10 -1 11 -1 9 -1 Thailand... ... ... ... ... ... ... ... 31 **, -1 30 **, -1 33 **, -1 1.10 **, -1 1 1 1 Timor-Leste... ... ... ... ... ... ... ... ... ... ... ... ... ... ... Tokelau90 -2 85 -2 97 -2 1.15 -2 103 -2 101 -2 105 -2 1.03 -2 66 **, -2 60 **, -2 74 **, -2 1.24 **, -2 9 -2 10 -2 8 -2 Tonga... ... ... ... ... ... ... ... ... ... ... ... ... ... ... Tuvalu... ... ... ... ... ... ... ... ... ... ... ... 2 -2 2 -2 2 -2 Vanuatu... ... ... ... ... ... ... ... ... ... ... ... ... ... ... Viet Nam81 ** 78 ** 83 ** 1.06 ** 80 ** 82 ** 78 ** 0.95 ** ... ... ... ... ... ... ... AnguillaLatin America and the Caribbean88 * 77 * 98 * 1.28 * 114 * 119 * 110 * 0.93 * ... ... ... ... 16 21 12 Antigua and Barbuda67 -1 59 -1 74 -1 1.26 -1 85 -1 80 -1 90 -1 1.13 -1 79 -1 75 -1 84 -1 1.12 -1 14 -1 16 -1 12 -1 Argentina141
T a b l e5 SECONDARY EDUCATION / ISCED 2 and 3 / Enrolment and repeaters / 2008RegionCountry or territoryEducationsystemSecondary (ISCED 2-3)general programmesTotal secondary (ISCED 2-3)all programmesEntranceage Duration MF (000) % F % PrivateEnrolmentEnrolment in technical and vocationalprogrammes (%)Totalsecondary(ISCED 2-3)Lowersecondary(ISCED 2)Gross enrolment ratioLower secondary (ISCED 2)all programmesUppersecondary(ISCED 3) MF M F GPI1 2 3 4 5 6 7 8 9 10 11 12Aruba 12 5 7.3 51 92 19 8 27 103 100 105 1.05Bahamas 11 6 34 50 31 . . . 97 97 97 1.00Barbados 11 5 20 * 50 * 5 * . * . * . * ... ... ... ...Belize 11 6 31 51 70 4 . 18 85 83 87 1.05Bermuda 11 7 4.5 -2 51 -2 42 -2 . -2 . -2 . -2 91 *, -2 93 *, -2 89 *, -2 *, -20.96Bolivia 12 6 1,052 -1 48 -1 13 -1 - -1 . -1 . -1 93 -1 95 -1 91 -1 0.97 -1Brazil 11 7 23,646 52 13 5 . 12 107 106 109 1.03British Virgin Islands 12 5 1.9 -1 54 -1 12 -1 21 -1 5 -1 55 -1 112 **, -1 106 **, -1 117 **, -1 **, -11.10Cayman Islands 11 6 3.2 52 29 . . . 85 * 86 * 84 * 0.97 *Chile 12 6 1,612 -1 50 -1 55 -1 24 -1 . -1 38 -1 99 -1 100 -1 99 -1 0.98 -1Colombia 11 6 4,772 51 24 6 . 25 100 96 103 1.07Costa Rica 12 5 381 50 10 15 14 18 106 105 107 1.03Cuba 12 6 826 +1 49 +1 . +1 26 +1 3 +1 50 +1 92 +1 94 +1 91 +1 0.97 +1Dominica 12 5 7.3 49 26 2 3 . 122 * 134 * 111 * 0.83 *Dominican Republic 12 6 909 54 22 5 . 7 84 80 88 1.10Ecuador 12 6 1,247 ** 49 ** ... 24 ** . ** 55 ** 85 ** 86 ** 84 ** 0.97 **El Salvador 13 6 539 50 18 19 . 56 79 80 79 1.00Grenada 12 5 12 47 62 . . . 111 112 110 0.98Guatemala 13 5 903 48 74 28 . 88 62 66 59 0.90Guyana 12 5 75 50 3 7 8 3 123 125 121 0.97Haiti 12 7 ... ... ... ... ... ... ... ... ... ...Honduras 12 5 567 55 26 46 26 82 68 62 74 1.19Jamaica 12 5 263 50 4 - . - 95 95 95 1.00Mexico 12 6 11,444 51 15 16 20 9 117 113 121 1.07Montserrat 12 5 0.35 -1 46 -1 . -1 . -1 . -1 . -1 101 *, -1 96 *, -1 109 *, -1 *, -11.14Netherlands Antilles 12 6 ... ... ... ... ... ... ... ... ... ...Nicaragua 12 5 462 53 23 3 1 9 78 75 81 1.08Panama 12 6 267 51 16 16 . 43 87 86 89 1.03Paraguay 12 6 532 -1 50 -1 ... 10 -1 - -1 23 -1 77 -1 76 -1 78 -1 1.02 -1Peru 12 5 2,609 49 23 2 2 . 98 99 97 0.98Saint Kitts and Nevis 12 5 4.4 51 4 . . . ... ... ... ...Saint Lucia 12 5 16 51 3 1 2 . 105 107 103 0.96Saint Vincent and the Grenadines 12 5 12 52 24 . . . 120 119 121 1.02Suriname 12 7 48 56 19 47 39 64 90 86 95 1.11Trinidad and Tobago 12 5 95 ** 51 ** ... ... 4 * ... 91 * 89 * 93 * 1.05 *Turks and Caicos Islands 12 5 ... ... ... ... ... ... ... ... ... ...Uruguay 12 6 295 -1 49 -1 13 -1 15 -1 7 -1 24 -1 101 -1 97 -1 105 -1 1.08 -1Venezuela 12 5 2,224 51 27 6 . 17 90 87 93 1.07North America and Western EuropeAndorra 12 6 3.9 49 3 7 . 25 88 * 86 * 90 * 1.05 *Austria 10 8 771 48 10 39 . 77 102 102 101 1.00Belgium 12 6 817 48 69 42 14 56 110 113 107 0.94Canada 12 6 2,632 -2 48 -2 6 -2 - -2 . -2 - -2 97 -2 98 -2 96 -2 0.99 -2Cyprus 12 6 65 49 16 6 . 13 101 * 101 * 101 * 1.00 *Denmark 13 6 475 -1 49 -1 13 -1 26 -1 . -1 54 -1 117 -1 115 -1 118 -1 1.03 -1Finland 13 6 431 50 7 29 . 55 102 103 102 1.00142
G l o b a l e d u c a t i o n d i g e s t 2 0 1 0 C o m p a r i n g e d u c a t i o n s t a t i s t i c s a r o u n d t h e w o r l dUpper secondary (ISCED 3)all programmesGross enrolment ratioTotal secondary (ISCED 2-3)all programmesNet enrolment rateTotal secondary (ISCED 2-3)all programmesPercentageof repeatersTotal secondary (ISCED 2-3)general programmesRegionMF M F GPI MF M F GPI MF M F GPI MF M F13 14 15 16 17 18 19 20 21 22 23 24 25 26 2789 86 92 1.07 95 92 98 1.06 75 72 78 1.08 11 12 10 Aruba89 87 92 1.06 93 92 94 1.03 85 83 87 1.05 - - - Bahamas... ... ... ... ... ... ... ... ... ... ... ... . * . * . * Barbados54 49 59 1.19 75 72 78 1.08 63 -1 61 -1 66 -1 1.09 -1 ... ... ... Belize79 *, -2 74 *, -2 85 *, -2 1.15 *, -2 84 *, -2 82 *, -2 87 *, -2 1.06 *, -2 ... ... ... ... . -2 . -2 . -2 Bermuda76 -1 77 -1 75 -1 0.97 -1 82 -1 83 -1 81 -1 0.97 -1 70 -1 70 -1 70 -1 0.99 -1 3 -1 4 -1 3 -1 Bolivia92 82 102 1.24 101 96 106 1.11 82 78 85 1.10 ... ... ... BrazilCountry or territory84 **, -1 77 **, -1 90 **, -1 1.17 **, -1 101 **, -1 95 **, -1 106 **, -1 1.11 **, -1 84 **, -1 79 **, -1 89 **, -1 1.12 **, -1 11 -2 15 -2 8 -2 British Virgin Islands91 * 89 * 94 * 1.06 * 88 * 87 * 88 * 1.01 * 81 * 83 * 78 * 0.94 * - - - Cayman Islands86 -1 84 -1 88 -1 1.05 -1 91 -1 89 -1 92 -1 1.03 -1 85 -1 84 -1 87 -1 1.03 -1 3 -1 4 -1 3 -1 Chile72 66 78 1.18 91 86 95 1.10 71 68 75 1.09 3 3 2 Colombia65 61 69 1.14 89 87 92 1.06 ... ... ... ... 9 10 8 Costa Rica87 +1 86 +1 88 +1 1.02 +1 90 +1 90 +1 89 +1 0.99 +1 83 +1 82 +1 83 +1 1.01 +1 - +1 1 +1 - +1 Cuba80 * 74 * 86 * 1.16 * 105 * 109 * 101 * 0.93 * 68 ** 62 ** 74 ** 1.21 ** 15 21 9 Dominica70 63 78 1.24 75 69 81 1.19 58 52 63 1.22 1 2 1 Dominican Republic66 ** 64 ** 68 ** 1.07 ** 76 ** 75 ** 76 ** 1.01 ** 62 ** 61 ** 62 ** 1.03 ** 9 ** 10 ** 7 ** Ecuador46 45 47 1.06 64 63 64 1.02 55 54 56 1.03 5 6 3 El Salvador103 113 94 0.83 108 112 103 0.92 89 93 85 0.91 5 6 4 Grenada47 47 48 1.03 57 58 55 0.93 40 41 39 0.94 3 4 3 Guatemala67 62 72 1.16 102 102 102 1.01 ... ... ... ... 12 14 10 Guyana... ... ... ... ... ... ... ... ... ... ... ... ... ... ... Haiti60 50 70 1.42 65 57 72 1.27 ... ... ... ... 5 -1 5 -1 5 -1 Honduras85 80 89 1.11 91 89 93 1.04 77 75 79 1.05 1 2 1 Jamaica61 60 63 1.06 90 87 93 1.06 72 71 74 1.03 2 2 1 Mexico103 *, -1 111 *, -1 96 *, -1 0.86 *, -1 102 *, -1 101 *, -1 103 *, -1 1.02 *, -1 96 *, -1 95 *, -1 96 *, -1 1.01 *, -1 - -1 - -1 - -1 Montserrat... ... ... ... ... ... ... ... ... ... ... ... ... ... ... Netherlands Antilles53 46 60 1.29 68 64 72 1.13 45 ** 42 ** 48 ** 1.16 ** 8 10 6 Nicaragua55 50 59 1.17 71 68 74 1.08 66 63 69 1.10 6 7 4 Panama54 -1 52 -1 56 -1 1.06 -1 66 -1 65 -1 67 -1 1.04 -1 58 -1 57 -1 60 -1 1.07 -1 1 -1 1 -1 1 -1 Paraguay75 74 75 1.01 89 89 89 0.99 75 75 75 1.00 6 7 5 Peru... ... ... ... ... ... ... ... ... ... ... ... 3 3 3 Saint Kitts and Nevis76 68 84 1.22 93 91 95 1.04 80 ** 77 ** 82 ** 1.06 ** - - - Saint Lucia90 77 104 1.34 108 102 114 1.11 90 85 95 1.12 8 ... ... Saint Vincent and the Grenadines55 40 71 1.77 75 66 85 1.28 ... ... ... ... ... ... ... Suriname86 ** 82 ** 90 ** 1.09 ** 89 ** 86 ** 92 ** 1.07 ** 74 ** 71 ** 76 ** 1.07 ** 1 1 1 Trinidad and Tobago... ... ... ... ... ... ... ... ... ... ... ... ... ... ... Turks and Caicos Islands83 -1 88 -1 78 -1 0.89 -1 92 -1 93 -1 91 -1 0.99 -1 68 -1 64 -1 71 -1 1.11 -1 13 -1 14 -1 12 -1 Uruguay68 63 74 1.17 81 77 85 1.10 69 66 74 1.12 3 4 2 Venezuela71 * 62 * 80 * 1.30 * 82 * 78 * 87 * 1.11 * 71 * 69 * 75 * 1.09 * 11 15 8 Andorra99 102 95 0.93 100 102 98 0.96 ... ... ... ... - - - Austria108 109 107 0.98 108 110 107 0.97 87 **, -2 89 **, -2 85 **, -2 0.96 **, -2 7 9 6 Belgium104 -2 105 -2 102 -2 0.98 -2 101 -2 102 -2 100 -2 0.98 -2 ... ... ... ... ... ... ... Canada95 * 94 * 97 * 1.02 * 98 * 98 * 99 * 1.01 * 96 * 95 * 97 * 1.02 * 1 2 1 Cyprus122 -1 120 -1 124 -1 1.03 -1 119 -1 117 -1 121 -1 1.03 -1 90 -1 88 -1 91 -1 1.03 -1 1 -2 1 -2 1 -2 Denmark118 113 124 1.10 110 108 113 1.05 96 96 97 1.01 - - - FinlandNorth America and Western Europe143
T a b l e5 SECONDARY EDUCATION / ISCED 2 and 3 / Enrolment and repeaters / 2008RegionCountry or territoryEducationsystemSecondary (ISCED 2-3)general programmesTotal secondary (ISCED 2-3)all programmesEntranceage Duration MF (000) % F % PrivateEnrolmentEnrolment in technical and vocationalprogrammes (%)Totalsecondary(ISCED 2-3)Lowersecondary(ISCED 2)Gross enrolment ratioLower secondary (ISCED 2)all programmesUppersecondary(ISCED 3) MF M F GPI1 2 3 4 5 6 7 8 9 10 11 12France 11 7 5,899 49 26 20 - 44 110 110 110 0.99Germany 10 9 7,907 48 9 22 1 57 100 100 100 1.00Gibraltar 11 4 1.7 47 2 - . - ... ... ... ...Greece 12 6 682 -1 47 -1 5 -1 16 -1 . -1 32 -1 104 -1 108 -1 100 -1 0.92 -1Holy See . . . . . . . . . . . .Iceland 13 7 35 50 7 21 . 34 101 101 100 0.99Ireland 12 5 318 50 1 17 3 33 105 104 107 1.02Israel 12 6 615 49 . 20 . 34 73 72 73 1.01Italy 11 8 4,553 -1 48 -1 5 -1 37 -1 . -1 60 -1 102 -1 103 -1 100 -1 0.97 -1Liechtenstein 11 7 3.2 46 5 35 - 78 104 * 103 * 105 * 1.02 *Luxembourg 12 7 39 50 18 31 . 60 108 108 108 1.00Malta 11 7 37 -1 49 -1 28 -1 15 -1 - -1 48 -1 97 -1 93 -1 101 -1 1.08 -1Monaco 11 7 3.0 +1 48 +1 21 +1 19 +1 7 +1 37 +1 162 *, +1 162 *, +1 161 *, +1 *, +11.00Netherlands 12 6 1,461 48 ... 47 28 68 127 130 124 0.96Norway 13 6 424 48 7 31 . 55 96 97 96 0.99Portugal 12 6 680 -1 51 -1 16 -1 18 -1 7 -1 33 -1 117 -1 117 -1 117 -1 1.00 -1San Marino 11 8 2.2 49 . 23 . 38 ... ... ... ...Spain 12 6 3,069 50 29 16 - 44 117 117 118 1.00Sweden 13 6 764 49 14 30 . 59 103 103 103 1.00Switzerland 13 7 599 48 7 33 . 65 112 110 113 1.03United Kingdom 11 7 5,356 49 26 13 . 24 103 105 102 0.97United States of America 12 6 24,693 49 9 . . . 99 99 99 0.99South and West AsiaAfghanistan 13 6 1,036 -1 26 -1 ... 1 -1 . -1 3 -1 39 -1 55 -1 22 -1 0.40 -1Bangladesh 11 7 10,445 -1 50 -1 96 -1 2 -1 . -1 6 -1 62 -1 58 -1 65 -1 1.12 -1Bhutan 13 6 57 +1 49 +1 12 +1 - +1 . +1 - +1 74 +1 73 +1 75 +1 1.04 +1India 11 7 96,049 -1 44 -1 ... 1 -1 - -1 2 -1 76 -1 79 -1 72 -1 0.91 -1Iran (Islamic Republic of) 11 7 8,187 48 7 10 . 19 98 100 95 0.94Maldives 13 5 33 **, -2 50 **, -2 12 **, -2 ... . ... 124 -2 118 -2 131 -2 1.11 -2Nepal 10 7 2,305 47 14 1 . 2 ... ... ... ...Pakistan 10 7 9,340 42 31 4 . 9 44 50 38 0.76Sri Lanka 10 8 ... ... ... ... . ... 108 106 109 1.02Sub-Saharan AfricaAngola 12 6 ... ... ... ... ... ... ... ... ... ...Benin 12 7 ... ... ... ... ... ... ... ... ... ...Botswana 13 5 175 -2 51 -2 4 -2 6 -2 . -2 19 -2 91 -2 88 -2 94 -2 1.07 -2Burkina Faso 13 7 468 +1 42 +1 42 +1 6 +1 2 +1 21 +1 27 +1 30 +1 23 +1 0.78 +1Burundi 13 7 243 ** 41 ** ... 5 ** 2 ** 19 ** 25 ** 29 ** 21 ** 0.73 **Cameroon 12 7 1,128 44 29 19 20 18 44 49 39 0.80Cape Verde 12 6 ... ... ... ... . ... 101 97 105 1.09Central African Republic 12 7 93 +1 36 +1 10 +1 5 +1 3 +1 10 +1 18 +1 23 +1 13 +1 0.56 +1Chad 12 7 314 -1 31 -1 ... 1 -1 - -1 4 -1 24 -1 33 -1 14 -1 0.41 -1Comoros 12 7 ... ... ... ... ... ... ... ... ... ...Congo 12 7 ... ... ... ... ... ... ... ... ... ...Côte d’Ivoire 12 7 ... ... ... ... ... ... ... ... ... ...Democratic Republic of the Congo 12 6 3,129 * 36 * ... 19 * 2 * 34 * 45 * 56 * 34 * 0.61 *144
G l o b a l e d u c a t i o n d i g e s t 2 0 1 0 C o m p a r i n g e d u c a t i o n s t a t i s t i c s a r o u n d t h e w o r l dUpper secondary (ISCED 3)all programmesGross enrolment ratioTotal secondary (ISCED 2-3)all programmesNet enrolment rateTotal secondary (ISCED 2-3)all programmesPercentageof repeatersTotal secondary (ISCED 2-3)general programmesRegionMF M F GPI MF M F GPI MF M F GPI MF M F13 14 15 16 17 18 19 20 21 22 23 24 25 26 27117 117 118 1.01 113 113 113 1.00 98 98 99 1.02 7 7 6 France104 108 101 0.94 102 103 100 0.98 ... ... ... ... 3 3 2 Germany... ... ... ... ... ... ... ... ... ... ... ... ... ... ... Gibraltar99 -1 101 -1 98 -1 0.97 -1 102 -1 104 -1 99 -1 0.95 -1 91 -1 91 -1 91 -1 0.99 -1 3 -1 4 -1 2 -1 Greece. . . . . . . . . . . . . . . Holy See117 114 121 1.06 110 108 112 1.03 90 89 91 1.02 ... ... ... Iceland129 122 136 1.11 115 111 119 1.06 88 86 90 1.05 1 1 1 Ireland108 107 109 1.01 90 89 91 1.01 86 85 88 1.02 2 2 1 Israel99 -1 99 -1 99 -1 1.00 -1 100 -1 100 -1 99 -1 0.99 -1 92 -1 92 -1 93 -1 1.02 -1 3 -1 4 -1 2 -1 ItalyCountry or territory114 * 135 * 93 * 0.69 * 108 * 117 * 100 * 0.86 * 83 * 85 * 81 * 0.96 * - - - Liechtenstein87 84 89 1.06 96 95 98 1.03 84 82 85 1.04 10 11 8 Luxembourg102 -1 107 -1 96 -1 0.90 -1 98 -1 97 -1 99 -1 1.02 -1 82 -1 79 -1 85 -1 1.07 -1 2 -1 2 -1 2 -1 Malta143 *, +1 141 *, +1 144 *, +1 1.02 *, +1 153 *, +1 153 *, +1 154 *, +1 1.01 *, +1 ... ... ... ... ... ... ... Monaco114 114 115 1.01 121 122 120 0.98 88 88 89 1.01 5 6 4 Netherlands127 129 125 0.97 112 113 110 0.98 96 96 96 1.00 ... ... ... Norway86 -1 79 -1 93 -1 1.18 -1 101 -1 98 -1 105 -1 1.07 -1 88 -1 84 -1 92 -1 1.09 -1 ... ... ... Portugal... ... ... ... ... ... ... ... ... ... ... ... - - - San Marino125 116 135 1.16 120 117 123 1.06 95 93 97 1.03 ... ... ... Spain104 104 103 0.99 103 104 103 0.99 99 99 99 1.00 - - - Sweden85 90 80 0.89 96 98 94 0.95 85 87 83 0.96 2 3 2 Switzerland96 93 99 1.06 99 98 100 1.02 93 92 95 1.03 ... ... ... United Kingdom89 89 89 1.00 94 94 94 1.00 88 88 89 1.01 ... ... ... United States of AmericaSouth and West Asia17 -1 24 -1 8 -1 0.34 -1 29 -1 41 -1 15 -1 0.38 -1 27 **, -1 38 **, -1 15 **, -1 0.38 **, -1 ... ... ... Afghanistan31 -1 32 -1 30 -1 0.96 -1 44 -1 43 -1 45 -1 1.05 -1 41 -1 40 -1 43 -1 1.05 -1 9 -1 9 -1 8 -1 Bangladesh38 +1 42 +1 35 +1 0.84 +1 62 +1 62 +1 61 +1 0.99 +1 47 +1 46 +1 49 +1 1.07 +1 4 +1 4 +1 4 +1 Bhutan43 -1 47 -1 37 -1 0.80 -1 57 -1 61 -1 52 -1 0.86 -1 ... ... ... ... 5 -2 5 -2 4 -2 India69 68 70 1.02 80 80 79 0.98 75 75 75 1.00 ... ... ... Iran (Islamic Republic of)... ... ... ... 84 **, -2 81 **, -2 86 **, -2 1.05 **, -2 69 **, -1 68 **, -1 71 **, -1 1.04 **, -1 7 -2 7 -2 7 -2 Maldives... ... ... ... ... ... ... ... ... ... ... ... 7 7 8 Nepal24 28 21 0.75 33 37 28 0.76 33 * 37 * 28 * 0.76 * ... ... ... Pakistan... ... ... ... ... ... ... ... ... ... ... ... 1 -2 1 -2 1 -2 Sri Lanka... ... ... ... ... ... ... ... ... ... ... ... ... ... ... Angola... ... ... ... ... ... ... ... ... ... ... ... 17 -2 17 -2 17 -2 Benin64 -2 63 -2 65 -2 1.04 -2 80 -2 78 -2 82 -2 1.06 -2 ... ... ... ... - -2 - -2 1 -2 BotswanaSub-Saharan Africa10 +1 12 +1 7 +1 0.62 +1 20 +1 23 +1 17 +1 0.74 +1 15 +1 18 +1 13 +1 0.74 +1 26 +1 24 +1 28 +1 Burkina Faso8 ** 10 ** 6 ** 0.61 ** 18 ** 21 ** 15 ** 0.71 ** ... ... ... ... 22 -1 18 -1 27 -1 Burundi28 31 24 0.79 37 41 33 0.80 ... ... ... ... 16 15 16 Cameroon... ... ... ... ... ... ... ... ... ... ... ... 19 19 18 Cape Verde8 +1 10 +1 6 +1 0.55 +1 14 +1 18 +1 10 +1 0.56 +1 10 +1 13 +1 8 +1 0.58 +1 16 +1 16 +1 18 +1 Central African Republic12 -1 15 -1 9 -1 0.56 -1 19 -1 26 -1 12 -1 0.45 -1 ... ... ... ... 19 -2 18 -2 19 -2 Chad... ... ... ... ... ... ... ... ... ... ... ... 17 17 17 Comoros... ... ... ... ... ... ... ... ... ... ... ... 24 24 25 Congo... ... ... ... ... ... ... ... ... ... ... ... 11 11 11 Côte d’Ivoire29 * 38 * 20 0.52 * 35 * 45 * 25 * 0.55 * ... ... ... ... 16 * 15 * 17 * Democratic Republic of the Congo145
T a b l e5 SECONDARY EDUCATION / ISCED 2 and 3 / Enrolment and repeaters / 2008RegionCountry or territoryEducationsystemSecondary (ISCED 2-3)general programmesTotal secondary (ISCED 2-3)all programmesEntranceage Duration MF (000) % F % PrivateEnrolmentEnrolment in technical and vocationalprogrammes (%)Totalsecondary(ISCED 2-3)Lowersecondary(ISCED 2)Gross enrolment ratioLower secondary (ISCED 2)all programmesUppersecondary(ISCED 3) MF M F GPI1 2 3 4 5 6 7 8 9 10 11 12Equatorial Guinea 12 7 ... ... ... ... ... ... ... ... ... ...Eritrea 12 7 229 ** 41 ** 6 ** 1 ** . 2 ** 44 51 37 0.72Ethiopia 13 6 3,696 42 ... 6 . 54 43 50 36 0.73Gabon 12 7 ... ... ... ... ... ... ... ... ... ...Gambia 13 6 105 48 27 - - - 62 63 61 0.97Ghana 12 6 1,724 46 16 ** 4 . 14 76 79 73 0.92Guinea 13 7 531 36 23 2 - 7 43 53 33 0.62Guinea-Bissau 13 5 55 -2 ... ... 2 -2 ... ... ... ... ... ...Kenya 12 6 3,107 48 ... 1 - 2 93 95 91 0.96Lesotho 13 5 102 **, -1 57 **, -1 ... 2 -2 1 -2 3 -2 51 -1 43 -1 59 -1 1.37 -1Liberia 12 6 158 43 58 ... ... ... 39 44 35 0.79Madagascar 11 7 945 49 41 4 1 14 41 42 40 0.96Malawi 12 6 636 46 ... . . . 51 54 48 0.89Mali 13 6 686 +1 39 +1 32 +1 13 +1 . +1 40 +1 50 +1 59 +1 41 +1 0.69 +1Mauritius 11 7 131 **, +1 50 **, +1 56 **, +1 ... 14 ... 96 +1 95 +1 98 +1 1.02 +1Mozambique 13 5 512 43 11 6 5 7 28 32 24 0.76Namibia 14 5 164 54 5 - - - 86 80 93 1.16Niger 13 7 256 +1 38 +1 20 +1 2 +1 - +1 15 +1 16 +1 20 +1 13 +1 0.64 +1Nigeria 12 6 6,068 -1 43 -1 14 -1 4 -1 4 -1 5 -1 34 -1 38 -1 30 -1 0.79 -1Rwanda 13 6 288 48 37 16 -1 . -1 45 -1 28 29 27 0.95Sao Tome and Principe 13 5 9.7 +1 52 +1 2 +1 2 +1 ... 11 +1 71 +1 65 +1 77 +1 1.19 +1Senegal 13 7 593 44 22 6 6 5 40 44 37 0.84Seychelles 12 5 7.5 +1 50 +1 7 +1 . +1 . +1 . +1 115 * 110 * 121 * 1.10 *Sierra Leone 12 6 240 -1 41 -1 7 -1 5 -1 1 -1 16 -1 50 -1 60 -1 40 -1 0.66 -1Somalia 12 6 87 **, -1 31 **, -1 ... ... ... ... 10 **, -1 14 **, -1 6 **, -1 **, -10.46South Africa 14 5 4,780 **, -1 51 **, -1 ... ... ... ... 94 -1 95 -1 94 -1 0.99 -1Swaziland 13 5 83 -1 47 -1 - -1 - -1 - -1 . -1 64 -1 68 -1 60 -1 0.88 -1Togo 12 7 409 -1 35 **, -1 ... 8 **, -1 1 **, -1 25 **, -1 51 **, -1 65 **, -1 37 **, -1 **, -10.57Uganda 13 6 1,145 46 51 5 2 21 31 33 29 0.87United Republic of Tanzania 14 6 ... ... ... ... ... ... ... ... ... ...Zambia 14 5 646 45 5 9 . 20 59 63 55 0.88Zimbabwe 13 6 831 -2 48 -2 ... . -2 . -2 . -2 59 -2 60 -2 59 -2 0.99 -2REGIONAL AVERAGESWorld 525,665 ** 47 ** ... 11 ** 1.2 ** 24 ** 79 ** 81 ** 78 ** 0.96 **Arab States 29,858 ** 47 ** ... 13 ** 3.3 ** 30 ** 83 ** 87 ** 78 ** 0.89 **Central and Eastern Europe 32,258 48 ... 19 0.2 46 92 93 91 0.98Central Asia 10,913 49 ... 15 0.0 49 98 98 97 0.98East Asia and the Pacific 164,535 48 ... 16 # 0.5 # 37 # 90 89 91 1.03Latin America and the Caribbean 59,101 51 ... 11 4.7 21 101 100 103 1.04North America and Western Europe 62,338 49 ... 13 1.2 26 103 103 102 0.99South and West Asia 130,312 # 45 # ... 1 # 0.0 # 3 # 71 # 75 # 68 # 0.91 #Sub-Saharan Africa 36,349 ** 44 ** ... 7 ** 2.4 ** 14 ** 41 ** 45 ** 36 ** 0.80 **Please refer to the Reader’s Guide for more information on the data and symbols used in each table.146
G l o b a l e d u c a t i o n d i g e s t 2 0 1 0 C o m p a r i n g e d u c a t i o n s t a t i s t i c s a r o u n d t h e w o r l dUpper secondary (ISCED 3)all programmesGross enrolment ratioTotal secondary (ISCED 2-3)all programmesNet enrolment rateTotal secondary (ISCED 2-3)all programmesPercentageof repeatersTotal secondary (ISCED 2-3)general programmesRegionMF M F GPI MF M F GPI MF M F GPI MF M F13 14 15 16 17 18 19 20 21 22 23 24 25 26 27Country or territory... ... ... ... ... ... ... ... ... ... ... ... ... ... ... Equatorial Guinea20 ** 24 ** 16 ** 0.69 ** 30 ** 36 ** 25 ** 0.71 ** 26 ** 30 ** 22 ** 0.71 ** 11 11 11 Eritrea12 15 10 0.70 33 39 28 0.72 25 **, -2 31 **, -2 20 **, -2 0.64 **, -2 9 9 8 Ethiopia... ... ... ... ... ... ... ... ... ... ... ... ... ... ... Gabon39 41 36 0.90 51 52 49 0.94 42 42 41 0.98 4 4 4 Gambia33 36 30 0.82 55 58 52 0.89 47 ** 49 ** 45 ** 0.92 ** ... ... ... Ghana25 33 17 0.51 36 45 26 0.59 28 34 21 0.61 26 27 24 Guinea... ... ... ... 36 -2 ... ... ... ... ... ... ... 14 -2 ... ... Guinea-Bissau40 43 38 0.87 58 61 56 0.92 49 ** 50 ** 48 ** 0.96 ** ... ... ... Kenya23 **, -1 22 **, -1 25 **, -1 1.17 **, -1 40 **, -1 34 **, -1 45 **, -1 1.32 **, -1 25 **, -1 20 **, -1 31 **, -1 1.58 **, -1 13 -1 12 -1 13 -1 Lesotho23 28 19 0.69 32 36 27 0.75 ... ... ... ... ... ... ... Liberia14 15 13 0.89 30 31 29 0.94 24 23 24 1.05 12 12 11 Madagascar17 19 15 0.78 29 32 27 0.85 25 26 24 0.93 12 12 12 Malawi26 +1 33 +1 19 +1 0.58 +1 38 +1 46 +1 30 +1 0.65 +1 29 35 22 0.63 22 +1 23 +1 22 +1 Mali81 **, +1 79 **, +1 82 **, +1 1.03 **, +1 87 **, +1 86 **, +1 88 **, +1 1.02 **, +1 ... ... ... ... 12 +1 15 +1 10 +1 Mauritius8 9 7 0.69 21 24 18 0.75 6 6 6 0.93 12 11 12 Mozambique34 31 37 1.20 66 61 71 1.17 54 **, -1 49 **, -1 60 **, -1 1.23 **, -1 ... ... ... Namibia4 +1 5 +1 3 +1 0.49 +1 12 +1 14 +1 9 +1 0.61 +1 9 -1 11 -1 7 -1 0.62 -1 20 +1 20 +1 21 +1 Niger26 -1 30 -1 23 -1 0.75 -1 30 -1 34 -1 27 -1 0.77 -1 26 **, -1 29 **, -1 22 **, -1 0.77 **, -1 ... ... ... Nigeria16 17 14 0.83 22 23 21 0.90 ... ... ... ... 8 7 8 Rwanda20 +1 23 +1 18 +1 0.77 +1 51 +1 49 +1 54 +1 1.12 +1 38 -1 36 -1 40 -1 1.11 -1 33 35 32 Sao Tome and Principe16 19 13 0.68 31 34 27 0.81 25 **, -1 28 **, -1 22 **, -1 0.76 **, -1 14 14 15 Senegal102 * 88 * 118 * 1.35 * 110 * 101 * 120 * 1.19 * 92 * ... ... ... . +1 . +1 . +1 Seychelles18 -1 22 -1 15 -1 0.66 -1 35 -1 42 -1 28 -1 0.66 -1 25 -1 30 -1 20 -1 0.69 -1 7 -1 6 -1 7 -1 Sierra Leone6 **, -1 9 **, -1 4 **, -1 0.45 **, -1 8 **, -1 11 **, -1 5 **, -1 0.46 **, -1 ... ... ... ... ... ... ... Somalia96 **, -1 92 **, -1 99 **, -1 1.09 **, -1 95 **, -1 93 **, -1 97 **, -1 1.05 **, -1 72 **, -1 70 **, -1 74 **, -1 1.06 **, -1 ... ... ... South Africa37 -1 38 -1 36 -1 0.95 -1 53 -1 56 -1 50 -1 0.90 -1 29 -1 31 -1 26 -1 0.86 -1 8 -1 8 -1 8 -1 Swaziland27 **, -1 38 **, -1 16 **, -1 0.42 **, -1 41 -1 54 **, -1 28 **, -1 0.53 **, -1 ... ... ... ... 27 +1 27 +1 27 +1 Togo14 15 12 0.76 25 27 23 0.85 22 ** 22 ** 21 ** 0.92 ** 2 2 2 Uganda... ... ... ... ... ... ... ... ... ... ... ... 3 **, -2 2 **, -2 4 **, -2 United Republic of Tanzania36 40 31 0.78 46 50 41 0.83 43 ** 47 ** 39 ** 0.82 ** 6 6 6 Zambia32 -2 34 -2 29 -2 0.86 -2 41 -2 43 -2 39 -2 0.92 -2 38 -2 39 -2 37 -2 0.96 -2 ... ... ... ZimbabweREGIONAL AVERAGES55 ** 56 ** 54 ** 0.96 ** 67 ** 68 ** 66 ** 0.96 ** 58 # 62 # 54 # 0.87 # ... ... ... World53 ** 54 ** 52 ** 0.96 ** 68 ** 71 ** 65 ** 0.92 ** 63 # 65 # 60 # 0.93 # ... ... ... Arab States84 86 81 0.94 88 90 87 0.96 81 ** 82 ** 80 ** 0.98 ** ... ... ... Central and Eastern Europe95 96 94 0.97 97 98 96 0.98 88 89 87 0.98 ... ... ... Central Asia63 62 65 1.06 77 75 78 1.04 70 # 69 # 71 # 1.03 # ... ... ... East Asia and the Pacific74 69 80 1.16 89 86 93 1.08 73 71 # 76 # 1.07 # ... ... ... Latin America and the Caribbean98 98 98 1.00 100 101 100 1.00 90 ** 90 ** 91 ** 1.01 ** ... ... ... North America and Western Europe40 # 44 # 36 # 0.82 # 54 # 57 # 50 # 0.87 # 44 # 56 # 31 # 0.56 # ... ... ... South and West Asia27 ** 30 ** 23 ** 0.77 ** 34 ** 38 ** 30 ** 0.79 ** 26 # 29 # 23 # 0.78 # ... ... ... Sub-Saharan Africa147
SECONDARY AND POST-SECONDARY NON-TERTIARY EDUCATION / ISCED 2, 3 and 4 /T a b l e6 Teaching staff and post-secondary non-tertiary enrolment / 2008RegionTeaching staffCountry or territoryArab StatesTotal secondary (ISCED 2-3) Lower secondary (ISCED 2) Upper secondary (ISCED 3)MF (000) % F MF (000) % F MF (000) % F1 2 3 4 5 6Algeria ... ... ... ... ... ...Bahrain ... ... ... ... ... ...Djibouti 1.2 24 0.71 25 0.49 23Egypt 491 **, -1 42 **, -1 220 **, -1 46 **, -1 270 **, -1 **, -139Iraq ... ... ... ... ... ...Jordan ... ... ... ... 16 52Kuwait 27 55 * 15 55 12 54 *Lebanon 42 +1 55 +1 20 +1 62 +1 23 +1 48 +1Libyan Arab Jamahiriya ... ... ... ... ... ...Mauritania 3.8 **, -1 10 **, -1 1.9 13 ... ...Morocco ... ... ... ... 43 29Oman 21 ** 57 ** 13 ** 64 ** 8.1 ** 47 **Palestinian Autonomous Territories 29 49 23 50 6.7 45Qatar 6.8 56 3.3 56 3.5 55Saudi Arabia 262 * 53 ** 147 * 54 * 115 * 52 **Sudan 83 **, +1 55 **, +1 38 **, +1 61 **, +1 45 +1 50 +1Syrian Arab Republic 181 ** 60 ** 121 ** 66 ** ... ...Tunisia 83 ... ... ... ... ...United Arab Emirates 24 **, -1 55 **, -1 13 -1 57 -1 11 **, -1 **, -153Yemen ... ... ... ... ... ...Central and Eastern EuropeAlbania ... ... ... ... ... ...Belarus 102 -1 80 -1 ... ... ... ...Bosnia and Herzegovina ... ... ... ... 12 55Bulgaria 52 79 22 81 30 77Croatia 42 -1 68 -1 18 -1 72 -1 24 -1 65 -1Czech Republic 80 66 36 74 43 58Estonia 11 78 5.2 81 6.1 75Hungary 90 71 44 79 47 65Latvia 19 81 9.4 83 9.1 80Lithuania 41 82 ... ... ... ...Montenegro ... ... ... ... ... ...Poland 261 **, -2 69 **, -2 128 **, -2 73 **, -2 134 **, -2 **, -265Republic of Moldova 30 76 21 77 8.7 74Romania 152 67 84 68 68 66Russian Federation 1,183 81 ... ... ... ...Serbia 59 64 31 64 28 63Slovakia 47 74 24 78 23 70Slovenia 16 72 7.8 79 8.0 65The former Yugoslav Rep. of Macedonia 16 54 9.0 52 6.6 57Turkey ... ... ... ... ... ...Ukraine 351 -1 79 *, -1 ... ... ... ...Central AsiaArmenia 42 84 ... ... ... ...Azerbaijan 132 -1 66 -1 ... ... ... ...148
G l o b a l e d u c a t i o n d i g e s t 2 0 1 0 C o m p a r i n g e d u c a t i o n s t a t i s t i c s a r o u n d t h e w o r l dTrained teachers (%) Pupil/teacher ratio Enrolment RegionTotal secondary (ISCED 2-3)Totalsecondary(ISCED 2-3)Lowersecondary(ISCED 2)Uppersecondary(ISCED 3)Post-secondary non-tertiaryeducation (ISCED4)MF M F MF (000) % F7 8 9 10 11 12 13 14Country or territoryArab States... ... ... ... ... ... . . Algeria... ... ... ... ... ... 3.2 **, -2 35 **, -2 Bahrain... ... ... 34 42 23 0.05 14 Djibouti... ... ... ... ... ... 191 **, -2 ... Egypt... ... ... ... ... ... ... ... Iraq... ... ... ... ... 12 . . Jordan... ... ... 9 10 8 11 62 Kuwait14 +1 16 +1 13 +1 9 +1 11 +1 8 +1 . +1 . +1 Lebanon... ... ... ... ... ... ... ... Libyan Arab Jamahiriya100 *, -2 100 *, -2 100 *, -2 27 **, -1 ... ... 4.5 *, -2 42 *, -2 Mauritania... ... ... ... ... 17 7.5 38 Morocco100 **, -2 100 **, -2 100 **, -2 14 ** 12 ** 18 ** . . Oman100 -1 100 -1 100 -1 24 25 21 . . Palestinian Autonomous Territories53 53 53 10 11 9 . . Qatar... ... ... 11 * 10 * 12 * 90 20 Saudi Arabia80 **, +1 ... ... 22 **, +1 28 **, +1 17 +1 . +1 . +1 Sudan... ... ... 15 ** 18 ** ... 35 48 Syrian Arab Republic... ... ... 15 ... ... . . Tunisia... ... ... 13 **, -1 15 -1 11 **, -1 . . United Arab Emirates... ... ... ... ... ... . . Yemen... ... ... ... ... ... ... ... Albania... ... ... 8 -1 ... ... 107 39 BelarusCentral and Eastern Europe... ... ... ... ... 13 . -1 . -1 Bosnia and Herzegovina... ... ... 11 12 11 4.0 54 Bulgaria... ... ... 9 -1 11 -1 8 -1 . -1 . -1 Croatia... ... ... 11 12 11 20 40 Czech Republic... ... ... 9 9 9 8.6 67 Estonia... ... ... 10 10 10 55 47 Hungary... ... ... 10 9 11 2.9 53 Latvia... ... ... 9 ... ... 8.9 51 Lithuania... ... ... ... ... ... ... ... Montenegro... ... ... 13 **, -2 13 **, -2 13 **, -2 58 -1 60 -1 Poland... ... ... 11 11 12 2.0 30 Republic of Moldova... ... ... 13 11 15 46 74 Romania... ... ... 9 ... ... 158 49 Russian Federation100 -1 100 -1 100 -1 10 10 10 . . Serbia... ... ... 13 13 12 1.4 44 Slovakia... ... ... 9 7 11 1.6 68 Slovenia... ... ... 13 12 15 - - The former Yugoslav Rep. of Macedonia... ... ... ... ... ... . . Turkey... ... ... 11 -1 ... ... 172 47 * UkraineCentral Asia... ... ... 7 ... ... 31 -1 65 -1 Armenia... ... ... 8 -1 ... ... 72 60 Azerbaijan149
SECONDARY AND POST-SECONDARY NON-TERTIARY EDUCATION / ISCED 2, 3 and 4 /T a b l e6 Teaching staff and post-secondary non-tertiary enrolment / 2008RegionTeaching staffCountry or territoryTotal secondary (ISCED 2-3) Lower secondary (ISCED 2) Upper secondary (ISCED 3)MF (000) % F MF (000) % F MF (000) % F1 2 3 4 5 6Georgia 41 ... 24 ... 17 ...Kazakhstan 179 +1 86 +1 ... ... ... ...Kyrgyzstan 53 -1 74 -1 ... ... ... ...Mongolia 18 74 10 -1 75 -1 6.3 -1 72 -1Tajikistan 62 49 ... ... ... ...Turkmenistan ... ... ... ... ... ...Uzbekistan 358 63 ... ... ... ...East Asia and the PacificAustralia ... ... ... ... ... ...Brunei Darussalam 4.4 61 ... ... ... ...Cambodia 30 -1 32 -1 24 35 ... ...China 6,344 ... 3,628 47 2,715 ...Cook Islands 0.13 -1 78 -1 ... ... ... ...Democratic People’s Republic of Korea ... ... ... ... ... ...Fiji 5.3 71 3.4 77 1.8 60Hong Kong Special Administrative Region of China ... ... ... ... ... ...Indonesia 1,531 47 877 49 654 45Japan 607 ... 263 ... 344 ...Kiribati 0.66 48 0.41 51 0.25 42Lao People’s Democratic Republic 18 44 12 44 6.4 46Macao, China 2.3 +1 59 +1 1.2 +1 63 +1 1.1 +1 55 +1Malaysia 167 -1 65 -1 ... ... ... ...Marshall Islands ... ... ... ... ... ...Micronesia (Federated States of) ... ... ... ... ... ...Myanmar 82 84 59 85 23 81Nauru 0.03 -1 79 -1 ... ... ... ...New Zealand 36 62 17 66 18 58Niue ... ... ... ... ... ...Palau ... ... ... ... ... ...Papua New Guinea ... ... ... ... ... ...Philippines 181 -1 76 -1 127 -1 76 -1 54 -1 77 -1Republic of Korea 219 54 102 66 118 43Samoa 1.2 +1 ... 0.36 +1 ... 0.85 +1 53 +1Singapore 14 67 6.9 67 7.2 66Solomon Islands ... ... ... ... ... ...Thailand 223 55 137 56 86 54Timor-Leste 2.6 -1 23 -1 1.4 23 ... ...Tokelau ... ... ... ... ... ...Tonga ... ... ... ... ... ...Tuvalu ... ... ... ... ... ...Vanuatu ... ... ... ... ... ...Viet Nam 462 64 ** 313 67 149 56 **Latin America and the CaribbeanAnguilla 0.10 -1 69 -1 ... ... ... ...Antigua and Barbuda ... ... 0.58 68 ... ...Argentina 286 -1 69 -1 136 -1 73 -1 149 -1 65 -1150
G l o b a l e d u c a t i o n d i g e s t 2 0 1 0 C o m p a r i n g e d u c a t i o n s t a t i s t i c s a r o u n d t h e w o r l dTrained teachers (%) Pupil/teacher ratio Enrolment RegionTotal secondary (ISCED 2-3)Totalsecondary(ISCED 2-3)Lowersecondary(ISCED 2)Uppersecondary(ISCED 3)Post-secondary non-tertiaryeducation (ISCED4)MF M F MF (000) % F7 8 9 10 11 12 13 1495 ... ... 7 7 8 6.1 45 GeorgiaCountry or territory... ... ... 10 +1 ... ... 505 +1 53 +1 Kazakhstan79 -1 78 -1 80 -1 14 -1 ... ... 7.6 * 40 * Kyrgyzstan99 98 99 19 21 -1 18 -1 - - Mongolia... ... ... 17 ... ... 34 58 Tajikistan... ... ... ... ... ... ... ... Turkmenistan100 100 100 13 ... ... . . Uzbekistan... ... ... ... ... ... 163 55 AustraliaEast Asia and the Pacific91 91 90 11 ... ... 0.01 43 Brunei Darussalam99 -1 ... ... 29 -1 27 ... 15 28 Cambodia... ... ... 16 16 16 235 47 China79 -1 76 -1 80 -1 15 -1 ... ... . -1 . -1 Cook Islands... ... ... ... ... ... ... ... Democratic People’s Republic of Korea96 -1 96 -1 96 -1 19 20 17 . -1 . -1 Fiji... ... ... ... ... ... 27 -1 43 -1 Hong Kong SAR of China... ... ... 12 12 11 . . Indonesia... ... ... 12 14 11 14 66 Japan62 60 65 17 17 19 ... ... Kiribati87 87 88 23 22 24 21 44 Lao People’s Democratic Republic71 +1 59 +1 80 +1 17 +1 18 +1 17 +1 . +1 . +1 Macao, China... ... ... 15 -1 ... ... 140 -1 41 -1 Malaysia... ... ... ... ... ... ... ... Marshall Islands... ... ... ... ... ... ... ... Micronesia (Federated States of)98 98 98 34 36 30 . . Myanmar36 -1 43 -1 35 -1 21 -1 ... ... 0.02 -1 79 -1 Nauru... ... ... 14 15 14 58 47 New Zealand... ... ... ... ... ... ... ... Niue... ... ... ... ... ... ... ... Palau... ... ... ... ... ... . -2 . -2 Papua New Guinea... ... ... 35 -1 39 -1 25 -1 884 * 52 * Philippines... ... ... 18 20 16 . . Republic of Korea... ... ... 21 +1 27 +1 19 +1 ... ... Samoa97 97 97 16 16 17 107 51 Singapore... ... ... ... ... ... ... ... Solomon Islands... ... ... 21 20 23 11 70 Thailand... ... ... ... 34 ... . . Timor-Leste... ... ... ... ... ... ... ... Tokelau... ... ... ... ... ... 0.37 -2 55 -2 Tonga... ... ... ... ... ... ... ... Tuvalu... ... ... ... ... ... ... ... Vanuatu98 **, -2 ... ... 21 19 25 . . Viet Nam60 -1 57 -1 62 -1 10 -1 ... ... 0.07 65 AnguillaLatin America and the Caribbean... ... ... ... 10 ... 2.5 * 70 * Antigua and Barbuda... ... ... 12 -1 16 -1 9 -1 . -1 . -1 Argentina151
SECONDARY AND POST-SECONDARY NON-TERTIARY EDUCATION / ISCED 2, 3 and 4 /T a b l e6 Teaching staff and post-secondary non-tertiary enrolment / 2008RegionTeaching staffCountry or territoryTotal secondary (ISCED 2-3) Lower secondary (ISCED 2) Upper secondary (ISCED 3)MF (000) % F MF (000) % F MF (000) % F1 2 3 4 5 6Aruba 0.56 57 ... ... ... ...Bahamas 2.7 70 1.5 71 1.3 69Barbados 1.4 -2 59 -2 ... ... ... ...Belize 1.8 59 1.3 61 0.51 54Bermuda 0.75 -2 67 -2 0.37 -2 68 -2 0.38 -2 67 -2Bolivia 58 -1 ... 25 -1 ... 33 -1 ...Brazil 1,375 68 787 73 588 62British Virgin Islands 0.22 -1 74 -1 0.13 -1 83 -1 0.10 -1 61 -1Cayman Islands 0.36 61 0.14 -2 61 -2 0.18 -2 56 -2Chile 68 -1 63 -1 24 -1 78 -1 44 -1 55 -1Colombia 186 50 ... ... ... ...Costa Rica 24 58 17 58 7.4 60Cuba 86 +1 55 +1 43 +1 62 +1 42 +1 48 +1Dominica 0.51 68 0.29 71 0.22 65Dominican Republic 37 59 16 69 21 52Ecuador 85 ** 50 ** 49 ** 50 ** 36 ** 50 **El Salvador 20 52 14 54 6.8 48Grenada 0.75 63 0.53 63 0.22 64Guatemala 54 44 35 45 20 43Guyana 3.6 69 2.8 69 0.78 67Haiti ... ... ... ... ... ...Honduras ... ... ... ... 18 54Jamaica 13 -1 69 -1 ... ... ... ...Mexico 636 48 383 50 253 44Montserrat 0.03 -1 66 -1 ... ... ... ...Netherlands Antilles ... ... ... ... ... ...Nicaragua 16 55 11 55 5.5 55Panama 17 59 10 61 7.2 55Paraguay ... ... ... ... ... ...Peru 161 44 ... ... ... ...Saint Kitts and Nevis 0.42 57 0.26 57 0.15 58Saint Lucia 0.98 67 ... ... ... ...Saint Vincent and the Grenadines 0.60 63 0.36 63 0.24 63Suriname 3.4 -1 60 -1 2.3 73 ... ...Trinidad and Tobago 7.0 ** 63 ** 4.1 * ... 2.9 ** 65 **Turks and Caicos Islands ... ... ... ... ... ...Uruguay 21 -1 ... 14 -1 ... 7.1 -1 ...Venezuela 218 64 133 66 85 61North America and Western EuropeAndorra ... ... 0.41 -2 62 -2 ... ...Austria 73 62 42 69 31 52Belgium 82 **, -2 57 **, -2 42 61 ... ...Canada ... ... ... ... ... ...Cyprus 6.4 63 3.1 69 3.2 57Denmark ... ... ... ... ... ...Finland 43 64 19 71 24 58152
G l o b a l e d u c a t i o n d i g e s t 2 0 1 0 C o m p a r i n g e d u c a t i o n s t a t i s t i c s a r o u n d t h e w o r l dTrained teachers (%) Pupil/teacher ratio Enrolment RegionTotal secondary (ISCED 2-3)Totalsecondary(ISCED 2-3)Lowersecondary(ISCED 2)Uppersecondary(ISCED 3)Post-secondary non-tertiaryeducation (ISCED4)MF M F MF (000) % F7 8 9 10 11 12 13 1499 ... ... 13 ... ... . . Aruba87 88 87 13 13 13 2.0 **, -2 52 **, -2 Bahamas57 -2 57 -2 57 -2 15 -2 ... ... 4.9 37 Barbados35 27 40 17 18 14 2.7 60 Belize100 -2 100 -2 100 -2 6 -2 6 -2 6 -2 . -2 . -2 Bermuda... ... ... 18 -1 17 -1 19 -1 50 -1 63 -1 Bolivia... ... ... 17 18 16 . . BrazilCountry or territory... ... ... 9 -1 10 -1 6 -1 0.12 -1 69 -1 British Virgin Islands98 96 100 9 11 -2 7 -2 0.08 55 Cayman Islands... ... ... 24 -1 24 -1 23 -1 . -1 . -1 Chile97 96 98 26 ... ... . . Colombia83 84 83 16 16 15 . . Costa Rica100 +1 100 +1 100 +1 10 +1 9 +1 10 +1 1.3 +1 58 +1 Cuba31 32 30 14 18 10 2.0 -2 71 -2 Dominica86 85 86 24 22 26 . . Dominican Republic100 ** 100 ** 100 ** 15 ** 15 ** 15 ** . . Ecuador88 85 90 26 26 28 . . El Salvador29 36 26 17 14 24 1.8 31 Grenada... ... ... 17 18 14 . . Guatemala55 50 57 21 20 23 0.52 48 Guyana... ... ... ... ... ... ... ... Haiti... ... ... ... ... 11 . . Honduras... ... ... 20 -1 ... ... 122 54 Jamaica87 ... ... 18 20 15 . . Mexico59 -1 50 -1 63 -1 12 -1 ... ... 0.13 -1 67 -1 Montserrat... ... ... ... ... ... ... ... Netherlands Antilles59 52 65 29 30 26 . . Nicaragua91 89 92 15 16 14 11 -1 44 -1 Panama... ... ... ... ... ... ... ... Paraguay... ... ... 16 ... ... ... ... Peru36 ... ... 11 11 11 0.09 50 Saint Kitts and Nevis57 -2 53 -2 59 -2 16 ... ... 2.4 65 Saint Lucia56 50 59 19 22 16 1.7 70 Saint Vincent and the Grenadines... ... ... 14 -1 15 ... 0.72 **, -2 86 **, -2 Suriname... ... ... 14 ** 14 * 14 ** 10 51 Trinidad and Tobago... ... ... ... ... ... ... ... Turks and Caicos Islands... ... ... 14 -1 11 -1 19 -1 . -1 . -1 Uruguay80 73 85 10 11 9 . . Venezuela... ... ... ... 7 -2 ... 0.71 72 Andorra... ... ... 11 9 13 75 59 Austria... ... ... 10 **, -2 7 ... 27 61 Belgium... ... ... ... ... ... ... ... Canada... ... ... 10 10 10 . . Cyprus... ... ... ... ... ... 1.2 -1 34 -1 Denmark... ... ... 10 11 10 . . FinlandNorth America and Western Europe153
SECONDARY AND POST-SECONDARY NON-TERTIARY EDUCATION / ISCED 2, 3 and 4 /T a b l e6 Teaching staff and post-secondary non-tertiary enrolment / 2008RegionTeaching staffCountry or territoryTotal secondary (ISCED 2-3) Lower secondary (ISCED 2) Upper secondary (ISCED 3)MF (000) % F MF (000) % F MF (000) % F1 2 3 4 5 6France 481 59 237 65 244 53Germany 597 58 409 62 188 49Gibraltar 0.31 43 0.16 43 0.15 43Greece 87 -1 58 -1 42 -1 67 -1 44 -1 48 -1Holy See . . . . . .Iceland 3.3 **, -1 66 **, -1 1.5 **, -1 80 **, -1 1.8 -1 54 -1Ireland 30 -2 62 -2 ... ... ... ...Israel 53 72 19 79 34 69Italy 451 -1 67 -1 191 -1 76 -1 260 -1 61 -1Liechtenstein 0.33 49 0.28 52 0.05 37Luxembourg 3.9 48 ... ... ... ...Malta ... ... ... ... ... ...Monaco 0.52 68 ... ... ... ...Netherlands 108 -1 46 -1 ... ... ... ...Norway ... ... ... ... ... ...Portugal 93 -1 69 -1 51 -1 70 -1 42 -1 67 -1San Marino ... ... 0.15 76 ... ...Spain 284 55 165 -1 59 -1 120 -1 54 -1Sweden 79 59 39 67 40 52Switzerland ... ... 33 50 ... ...United Kingdom 379 *, -1 62 *, -1 189 63 ... ...United States of America 1,718 60 930 64 787 56South and West AsiaAfghanistan 33 -1 28 -1 34 29 ... ...Bangladesh 414 -1 20 -1 220 -1 20 -1 193 -1 20 -1Bhutan 2.7 +1 49 +1 1.7 +1 54 +1 1.0 +1 41 +1India ... ... ... ... ... ...Iran (Islamic Republic of) ... ... 173 51 ... ...Maldives ... ... 3.0 39 ... ...Nepal 56 15 40 +2 25 +2 ... ...Pakistan ... ... ... ... ... ...Sri Lanka ... ... 68 -1 69 -1 ... ...Sub-Saharan AfricaAngola ... ... ... ... ... ...Benin ... ... ... ... ... ...Botswana 12 -2 49 -2 ... ... ... ...Burkina Faso 18 +1 16 +1 13 +1 16 +1 5.7 +1 16 +1Burundi 8.2 ** 21 ** ... ... ... ...Cameroon 43 **, -2 26 **, -2 ... ... ... ...Cape Verde ... ... 2.0 41 ... ...Central African Republic 1.2 +1 12 +1 ... ... ... ...Chad 9.6 **, -1 ... ... ... ... ...Comoros ... ... ... ... ... ...Congo ... ... ... ... ... ...Côte d’Ivoire ... ... ... ... ... ...Democratic Republic of the Congo 189 * 11 * ... ... ... ...154
G l o b a l e d u c a t i o n d i g e s t 2 0 1 0 C o m p a r i n g e d u c a t i o n s t a t i s t i c s a r o u n d t h e w o r l dTrained teachers (%) Pupil/teacher ratio Enrolment RegionTotal secondary (ISCED 2-3)Totalsecondary(ISCED 2-3)Lowersecondary(ISCED 2)Uppersecondary(ISCED 3)Post-secondary non-tertiaryeducation (ISCED4)MF M F MF (000) % F7 8 9 10 11 12 13 14... ... ... 12 14 11 34 69 France... ... ... 13 12 16 544 47 Germany91 89 95 5 6 5 0.75 52 Gibraltar... ... ... 8 -1 8 -1 8 -1 39 -1 52 -1 Greece. . . . . . . . Holy See... ... ... 10 **, -1 9 **, -1 12 -1 0.22 35 Iceland... ... ... 11 -2 ... ... 61 36 Ireland... ... ... 12 13 11 11 45 Israel... ... ... 10 -1 9 -1 11 -1 33 -1 52 -1 ItalyCountry or territory... ... ... 10 6 28 0.12 32 Liechtenstein... ... ... 10 ... ... 0.96 24 Luxembourg... ... ... ... ... ... 0.27 -1 55 -1 Malta... ... ... 6 ... ... 0.09 +1 44 +1 Monaco... ... ... 13 -1 ... ... 6.3 24 Netherlands... ... ... ... ... ... 7.5 31 Norway... ... ... 7 -1 8 -1 7 -1 2.3 -1 32 -1 Portugal... ... ... ... 6 ... ... ... San Marino... ... ... 11 12 -1 9 -1 . . Spain... ... ... 10 10 10 21 52 Sweden... ... ... ... 9 ... 15 54 Switzerland... ... ... 14 *, -1 12 ... 4.3 65 United Kingdom... ... ... 14 14 15 423 68 United States of AmericaSouth and West Asia... ... ... 32 -1 31 ... 3.0 -1 8 -1 Afghanistan39 -1 39 -1 41 -1 25 -1 29 -1 21 -1 84 -1 23 -1 Bangladesh83 ... ... 21 +1 26 +1 12 +1 5.1 +1 35 +1 Bhutan... ... ... ... ... ... 925 -1 28 -1 India... ... ... ... 22 ... ... ... Iran (Islamic Republic of)... ... ... ... 9 ... ... ... Maldives... ... ... 41 40 +2 ... . +2 . +2 Nepal... ... ... ... ... ... 11 47 Pakistan... ... ... ... 19 -1 ... . . Sri Lanka... ... ... ... ... ... ... ... Angola... ... ... ... ... ... ... ... Benin99 -2 99 -2 99 -2 14 -2 ... ... ... ... BotswanaSub-Saharan Africa50 +1 49 +1 56 +1 26 +1 30 +1 16 +1 19 -1 28 -1 Burkina Faso56 ** 57 ** 54 ** 30 ** ... ... . . Burundi... ... ... 16 **, -2 ... ... 6.9 63 Cameroon... ... ... ... 19 ... 0.72 69 Cape Verde... ... ... 80 +1 ... ... . +1 . +1 Central African Republic... ... ... 33 **, -1 ... ... . . Chad... ... ... ... ... ... ... ... Comoros... ... ... ... ... ... 6.5 -2 68 -2 Congo... ... ... ... ... ... . . Côte d’Ivoire... ... ... 17 * ... ... . * . * Democratic Republic of the Congo155
SECONDARY AND POST-SECONDARY NON-TERTIARY EDUCATION / ISCED 2, 3 and 4 /T a b l e6 Teaching staff and post-secondary non-tertiary enrolment / 2008RegionTeaching staffCountry or territoryTotal secondary (ISCED 2-3) Lower secondary (ISCED 2) Upper secondary (ISCED 3)MF (000) % F MF (000) % F MF (000) % F1 2 3 4 5 6Equatorial Guinea ... ... ... ... ... ...Eritrea 4.4 -1 10 -1 2.6 10 ... ...Ethiopia 80 19 66 20 14 13Gabon ... ... ... ... ... ...Gambia 4.4 17 2.8 21 1.6 11Ghana 99 22 74 23 25 20Guinea 16 6 10 6 5.6 5Guinea-Bissau 1.5 -2 ... ... ... ... ...Kenya 104 ** 41 ** 49 ** 46 ** 55 37Lesotho 6.0 -1 64 -1 4.0 -1 55 -1 2.0 -1 82 -1Liberia 13 4 8.8 5 4.0 3Madagascar 35 ... 26 ... 9.1 ...Malawi ... ... ... ... 11 20Mali 26 10 12 +1 14 +1 ... ...Mauritius 8.2 +1 58 +1 ... ... ... ...Mozambique 16 17 11 17 4.7 17Namibia 6.7 ... ... ... ... ...Niger 9.3 +1 17 +1 6.8 +1 20 +1 2.5 +1 11 +1Nigeria 213 -1 34 -1 117 -1 37 -1 96 -1 30 -1Rwanda 12 -1 53 -1 ... ... ... ...Sao Tome and Principe 0.38 **, -2 13 **, -2 ... ... ... ...Senegal ... ... ... ... ... ...Seychelles 0.60 +1 61 +1 ... ... ... ...Sierra Leone 10 -1 16 -1 ... ... ... ...Somalia 4.5 **, -1 14 **, -1 2.2 **, -1 14 **, -1 2.3 **, -1 **, -113South Africa 165 **, -1 53 **, -1 ... ... ... ...Swaziland 4.4 -1 48 -1 ... ... ... ...Togo 12 **, -1 7 **, -1 ... ... ... ...Uganda 61 25 ... ... ... ...United Republic of Tanzania ... ... ... ... ... ...Zambia 29 ** 45 ** 14 ** 50 ** 15 40Zimbabwe ... ... ... ... ... ...REGIONAL AVERAGESWorld 29,651 ** 51 ** 16,205 # 53 ** 13,445 # 46 **Arab States 1,820 # 47 # 965 # 52 ** 855 # 46 #Central and Eastern Europe 2,847 ** 73 ** 1,696 # 73 ** 1,151 # 59 **Central Asia 960 70 ** 428 # 62 # 532 # 59 #East Asia and the Pacific 10,150 # 47 # 5,768 # 50 4,381 # 43 #Latin America and the Caribbean 3,484 60 2,027 ** 63 1,457 ** 57North America and Western Europe 4,855 ** 60 ** 2,603 # 65 2,252 # 56 **South and West Asia 4,091 # 35 # 1,983 # 37 # 2,109 # 30 #Sub-Saharan Africa 1,442 ** 29 # 735 # 28 # 708 # 26 #Please refer to the Reader’s Guide for more information on the data and symbols used in each table.156
G l o b a l e d u c a t i o n d i g e s t 2 0 1 0 C o m p a r i n g e d u c a t i o n s t a t i s t i c s a r o u n d t h e w o r l dTrained teachers (%) Pupil/teacher ratio Enrolment RegionTotal secondary (ISCED 2-3)Totalsecondary(ISCED 2-3)Lowersecondary(ISCED 2)Uppersecondary(ISCED 3)Post-secondary non-tertiaryeducation (ISCED4)MF M F MF (000) % F7 8 9 10 11 12 13 14Country or territory... ... ... ... ... ... . -1 . -1 Equatorial Guinea57 -1 56 -1 67 -1 49 -1 56 ... 5.8 42 Eritrea64 63 67 46 50 29 31 **, -2 39 **, -2 Ethiopia... ... ... ... ... ... ... ... Gabon... ... ... 24 25 23 ... ... Gambia69 65 82 17 17 20 29 ** 44 ** Ghana91 * 91 * 94 * 33 37 27 . . Guinea... ... ... 37 -2 ... ... ... ... Guinea-Bissau97 ** 98 ** 96 ** 30 ** 34 ** 26 77 49 Kenya... ... ... 17 **, -1 20 -1 12 **, -1 ... ... Lesotho56 56 55 12 12 14 ... ... Liberia97 ... ... 27 29 20 1.6 44 Madagascar... ... ... ... ... 20 ... ... Malawi81 80 86 24 38 +1 ... . +1 . +1 Mali... ... ... 16 **, +1 ... ... 3.3 +1 63 +1 Mauritius67 65 74 33 40 16 . . Mozambique97 ... ... 24 ... ... 3.8 ... Namibia36 +1 38 +1 25 +1 28 +1 33 +1 13 +1 1.2 +1 34 +1 Niger70 -2 66 -2 77 -2 28 -1 30 -1 26 -1 - -1 - -1 Nigeria53 -1 94 -1 17 -1 22 -1 ... ... . . Rwanda... ... ... 22 **, -2 ... ... 0.55 -1 52 -1 Sao Tome and Principe... ... ... ... ... ... ... ... Senegal93 +1 ... ... 13 +1 ... ... 2.6 ... Seychelles82 -1 81 -1 89 -1 24 -1 ... ... ... ... Sierra Leone... ... ... 19 **, -1 18 **, -1 21 **, -1 ... ... Somalia... ... ... 29 **, -1 ... ... ... ... South Africa99 -1 ... ... 19 -1 ... ... 0.74 -1 43 -1 Swaziland50 -2 ... ... 36 **, -1 ... ... - -2 - -2 Togo... ... ... 19 ... ... ... ... Uganda... ... ... ... ... ... ... ... United Republic of Tanzania... ... ... 22 ** 26 ** 19 . . Zambia... ... ... ... ... ... ... ... ZimbabweREGIONAL AVERAGES... ... ... 18 ** 19 # 16 # ... ... World... ... ... 16 # 19 # 13 # ... ... Arab States... ... ... 11 ** 11 # 12 # ... ... Central and Eastern Europe... ... ... 11 18 # 6 # ... ... Central Asia... ... ... 16 # 17 # 16 # ... ... East Asia and the Pacific... ... ... 17 18 ** 15 ** ... ... Latin America and the Caribbean... ... ... 13 ** 12 # 14 # ... ... North America and Western Europe... ... ... 32 # 38 # 26 # ... ... South and West Asia... ... ... 25 ** 31 19 # ... ... Sub-Saharan Africa157
GRADUATION AND ENTRY TO UPPER SECONDARY EDUCATION (ISCED 3)T a b l e7 AND ENTRY TO TERTIARY EDUCATION (ISCED 5) / 2008 (selected countries)RegionGross entry ratioto upper secondary educationUpper secondarygross graduation ratioCountry or territoryArab StatesUpper secondary (ISCED 3)ISCED 3A(preparation for direct entry into ISCED 5A education)ISCED 3B(preparation for direct entry into ISCED 5B education)MF M F GPI MF M F GPI MF M F GPI1 2 3 4 5 6 7 8 9 10 11 12Egypt ... ... ... ... ... ... ... ... ... ... ... ...Jordan 78 75 82 1.09 37 31 44 1.44 . . . .Tunisia 63 54 72 1.33 44 34 54 1.62 3 … … …Central and Eastern EuropeAlbania ... ... ... ... ... ... ... ... ... ... ... ...Belarus (a) ... ... ... ... 60 -1 68 -1 52 -1 0.77 -1 . -1 . -1 . -1 . -1Bosnia and Herzegovina ... ... ... ... ... ... ... ... ... ... ... ...Bulgaria 85 88 83 0.94 74 71 77 1.08 . . . .Croatia 102 -1 104 -1 100 -1 0.96 -1 61 -1 52 -1 69 -1 1.32 -1 x(5) -1 x(6) -1 x(7) -1 x(8) -1Czech Republic 107 108 105 0.97 58 50 68 1.37 - - 1 1.75Estonia 104 101 107 1.05 78 71 86 1.20 . . . .Hungary 101 100 102 1.02 64 58 71 1.23 . . . .Latvia 100 -1 … -1 … -1 … -1 74 67 82 1.22 - - - .Lithuania ... ... ... ... 82 75 89 1.18 . . . .Poland 100 -1 101 -1 98 -1 0.98 -1 78 -1 71 -1 87 -1 1.23 -1 . -1 . -1 . -1 . -1Republic of Moldova (a) ... ... ... ... 25 -1 30 -1 20 -1 0.65 -1 18 -1 17 -1 19 -1 1.12 -1Romania 81 81 82 1.01 71 68 76 1.12 . . . .Russian Federation 82 … … … 53 … … … 13 … … …Slovakia 104 101 107 1.05 78 71 86 1.20 . . . .Slovenia 111 -1 120 -1 102 -1 0.85 -1 37 29 45 1.55 41 40 43 1.09The former Yugoslav Rep. of Macedonia 81 85 77 0.90 71 70 71 1.01 . . . .Turkey 69 76 62 0.82 24 27 21 0.79 . . . .Ukraine (a) ... ... ... ... 87 -1 90 -1 84 -1 0.93 -1 . -1 . -1 . -1 . -1Central AsiaArmenia (a) ... ... ... ... 70 -1 74 -1 65 -1 0.87 -1 . -1 . -1 . -1 . -1Azerbaijan (a) ... ... ... ... 60 -1 59 -1 61 -1 1.04 -1 . -1 . -1 . -1 . -1Kazakhstan (a) ... ... ... ... 65 -1 60 -1 69 -1 1.15 -1 . -1 . -1 . -1 . -1Kyrgyzstan (a) ... ... ... ... 74 -1 72 -1 76 -1 1.05 -1 x(5) -1 x(6) -1 x(7) -1 x(8) -1Mongolia (a) ... ... ... ... 67 -1 75 -1 58 -1 0.78 -1 . -1 . -1 . -1 . -1Tajikistan (a) ... ... ... ... 44 -1 35 -1 53 -1 1.52 -1 . -1 . -1 . -1 . -1Uzbekistan (a) ... ... ... ... 84 -1 85 -1 84 -1 0.99 -1 . -1 . -1 . -1 . -1East Asia and the PacificAustralia ... ... ... ... 67 62 73 1.18 x(13) x(14) x(15) x(16)China 72 70 75 1.06 35 35 35 0.99 x(5) x(6) x(7) x(8)Hong Kong SAR of China (a) ... ... ... ... 34 -1 38 -1 30 -1 0.78 -1 - -1 - -1 - -1 . -1Indonesia 64 65 62 0.95 29 28 31 1.11 17 19 14 0.74Japan 102 102 103 1.00 71 68 74 1.09 1 1 - 0.20Macao, China (a) ... ... ... ... 69 -1 76 -1 63 -1 0.83 -1 - -1 - -1 - -1 . -1Malaysia 101 -1 93 -1 108 -1 1.16 -1 18 -1 12 -1 24 -1 2.01 -1 . -1 . -1 . -1 . -1New Zealand 99 98 100 1.02 ... ... ... ... ... ... ... ...Philippines 70 -2 63 -2 78 -2 1.23 -2 63 -1 56 -1 71 -1 1.26 -1 . -1 . -1 . -1 . -1Republic of Korea 101 103 99 0.96 63 63 63 0.99 . . . .Thailand 70 +1 66 +1 75 +1 1.14 +1 30 24 36 1.51 17 18 16 0.88158
G l o b a l e d u c a t i o n d i g e s t 2 0 1 0 C o m p a r i n g e d u c a t i o n s t a t i s t i c s a r o u n d t h e w o r l dUpper secondarygross graduation ratioGross entry ratioto tertiary educationRegionISCED 3C(no direct access to ISCED 5 education, excluding short programmes)ISCED 5AISCED 5BMF M F GPI MF M F GPI MF M F GPI13 14 15 16 17 18 19 20 21 22 23 24... ... ... ... ... ... ... ... ... ... ... ... Egypt... ... ... ... 39 35 42 1.21 11 10 13 1.35 Jordan3 . . . 37 … … … x(17) … … … TunisiaCountry or territoryArab States... ... ... ... ... ... ... ... ... ... ... ... Albania. -1 . -1 . -1 . -1 ... ... ... ... ... ... ... ... Belarus (a)Central and Eastern Europe... ... ... ... ... … ... ... ... … ... ... Bosnia and Herzegovina. . . . 51 44 58 1.31 10 9 11 1.27 Bulgaria. . . . 41 ... ... ... 28 ... ... ... Croatia25 32 19 0.58 59 51 68 1.32 9 6 13 2.18 Czech Republic. . . . 60 45 76 1.70 30 22 39 1.81 Estonia16 19 13 0.68 59 54 65 1.20 12 7 18 2.50 Hungary5 7 3 0.47 98 -1 74 -1 124 -1 1.68 -1 23 -1 16 -1 31 -1 1.92 -1 Latvia- - - . 52 -1 45 -1 59 -1 1.31 -1 35 -1 31 -1 39 -1 1.25 -1 Lithuania12 16 8 0.48 78 -1 72 -1 84 -1 1.17 -1 1 -1 0 -1 1 -1 3.70 -1 Poland10 -1 8 -1 13 -1 1.65 -1 ... ... ... ... ... ... ... ... Republic of Moldova (a)37 45 29 0.64 100 88 112 1.26 - - - . Romania22 31 12 0.39 80 … … … 35 … … … Russian Federation. . . . 73 60 87 1.44 1 1 1 2.07 Slovakia22 26 18 0.69 51 -1 38 -1 64 -1 1.67 -1 40 -1 41 -1 39 -1 0.95 -1 Slovenia. . . . 55 53 56 1.04 2 1 3 2.32 The former Yugoslav Rep. of Macedonia. . . . 28 30 26 0.85 21 24 18 0.74 Turkey. -1 . -1 . -1 . -1 ... ... ... ... ... ... ... ... Ukraine (a)Central Asia. -1 . -1 . -1 . -1 ... ... ... ... ... ... ... ... Armenia (a)- -1 - -1 - -1 . -1 ... ... ... ... ... ... ... ... Azerbaijan (a). -1 . -1 . -1 . -1 ... ... ... ... ... ... ... ... Kazakhstan (a)- -1 - -1 - -1 . -1 ... ... ... ... ... ... ... ... Kyrgyzstan (a). -1 . -1 . -1 . -1 ... ... ... ... ... ... ... ... Mongolia (a). -1 . -1 . -1 . -1 ... ... ... ... ... ... ... ... Tajikistan (a). -1 . -1 . -1 . -1 ... ... ... ... ... ... ... ... Uzbekistan (a)40 37 43 1.15 91 79 103 1.31 ... ... ... ... Australia21 20 23 1.15 15 15 16 1.08 17 15 18 1.25 ChinaEast Asia and the Pacific62 -1 56 -1 67 -1 1.20 -1 ... ... ... ... ... ... ... ... Hong Kong SAR of China (a). . . . 17 -1 17 -1 17 -1 0.95 -1 4 -1 5 -1 4 -1 0.79 -1 Indonesia22 24 20 0.83 49 55 42 0.77 30 22 38 1.71 Japan. -1 . -1 . -1 . -1 ... ... ... ... ... ... ... ... Macao, China (a)85 82 88 1.08 28 -1 23 -1 32 -1 1.40 -1 30 -1 28 -1 33 -1 1.21 -1 Malaysia... ... ... ... 70 57 85 1.49 44 38 51 1.34 New Zealand. . . . ... ... ... ... ... ... ... ... Philippines24 24 23 0.94 71 73 69 0.95 38 35 42 1.19 Republic of Korea. . . . 56 +1 48 +1 64 +1 1.33 +1 17 +1 17 +1 16 +1 0.93 +1 Thailand159
GRADUATION AND ENTRY TO UPPER SECONDARY EDUCATION (ISCED 3)T a b l e7 AND ENTRY TO TERTIARY EDUCATION (ISCED 5) / 2008 (selected countries)RegionGross entry ratioto upper secondary educationUpper secondarygross graduation ratioCountry or territoryLatin America and the CaribbeanUpper secondary (ISCED 3)ISCED 3A(preparation for direct entry into ISCED 5A education)ISCED 3B(preparation for direct entry into ISCED 5B education)MF M F GPI MF M F GPI MF M F GPI1 2 3 4 5 6 7 8 9 10 11 12Argentina 79 -1 77 -1 82 -1 1.06 -1 43 -1 37 -1 49 -1 1.32 -1 . -1 . -1 . -1 . -1Bolivia (a) ... ... ... ... 57 -1 58 -1 56 -1 0.97 -1 . -1 . -1 . -1 . -1Chile 110 -1 110 -1 110 -1 1.00 -1 70 -1 66 -1 74 -1 1.12 -1 . -1 . -1 . -1 . -1Colombia (a) ... ... ... ... 64 -1 73 -1 55 -1 0.76 -1 . -1 . -1 . -1 . -1Costa Rica (a) ... ... ... ... 32 -1 36 -1 28 -1 0.78 -1 . -1 . -1 . -1 . -1Ecuador (a) ... ... ... ... 48 -1 51 -1 45 -1 0.89 -1 . -1 . -1 . -1 . -1Guatemala (a) ... ... ... ... 39 -1 39 -1 40 -1 1.03 -1 . -1 . -1 . -1 . -1Jamaica ... ... ... ... ... ... ... ... … … … …Mexico 75 74 75 1.01 41 38 45 1.18 . . . .Panama (a) ... ... ... ... 37 -1 45 -1 29 -1 0.65 -1 5 -1 … … …Paraguay 64 -1 63 -1 65 -1 1.04 -1 50 -1 45 -1 55 -1 1.21 -1 . -1 . -1 . -1 . -1Peru 80 79 80 1.01 70 69 70 1.00 . . . .Uruguay 77 -2 69 -2 85 -2 1.23 -2 ... ... ... ... ... ... … ...North America and Western EuropeAustria ... ... ... ... 17 14 20 1.52 53 60 45 0.76Belgium 93 92 94 1.02 62 57 67 1.18 . . . .Canada ... ... ... ... 74 -2 70 -2 79 -2 1.13 -2 . -2 . -2 . -2 . -2Cyprus 88 89 88 0.99 78 76 81 1.06 . . . .Denmark 106 -1 102 -1 110 -1 1.07 -1 54 -1 44 -1 65 -1 1.46 -1 . -1 . -1 . -1 . -1Finland ... ... ... ... 134 120 149 1.25 . . . .France ... ... ... ... 55 48 63 1.32 13 15 12 0.79Germany 135 137 133 0.97 43 38 49 1.29 58 62 53 0.84Greece 123 -1 130 -1 116 -1 0.89 -1 67 -1 60 -1 74 -1 1.23 -1 . -1 . -1 . -1 . -1Iceland 113 110 116 1.06 63 49 77 1.57 1 1 2 1.86Ireland 105 -1 94 -1 118 -1 1.25 -1 93 -1 86 -1 101 -1 1.17 -1 . -1 . -1 . -1 . -1Israel 96 94 99 1.06 92 87 97 1.12 . . . .Italy 107 -1 108 -1 105 -1 0.98 -1 77 -1 72 -1 83 -1 1.15 -1 1 -1 1 -1 2 -1 1.69 -1Liechtenstein … … … … 111 132 91 0.70 - - - .Luxembourg 109 -2 109 -2 108 -2 0.99 -2 42 -1 33 -1 51 -1 1.53 -1 9 -1 11 -1 8 -1 0.75 -1Malta 136 -1 147 -1 123 -1 0.84 -1 47 -1 39 -1 55 -1 1.43 -1 8 -1 12 -1 5 -1 0.41 -1Netherlands ... ... ... ... 62 56 69 1.24 . . . .Norway ... ... ... ... 61 48 74 1.53 . . . .Portugal ... ... ... ... 67 -1 58 -1 77 -1 1.31 -1 x(5) -1 x(6) -1 x(7) -1 x(8) -1Spain ... ... ... ... 44 37 52 1.39 . . . .Sweden 105 105 104 1.00 74 72 76 1.06 - - - .Switzerland 108 109 106 0.97 26 24 29 1.21 68 72 64 0.89United Kingdom ... ... ... ... ... ... ... ... ... ... ... ...United States of America 96 99 93 0.94 … … … … … … … …South and West AsiaBhutan (a) ... ... ... ... 30 27 33 1.21 . . . .India 53 -1 58 -1 47 -1 0.81 -1 ... ... ... ... ... ... ... ...Sri Lanka ... ... ... ... ... ... ... ... ... ... ... ...(a) These countries have completed a pilot questionnaire on graduation at the upper secondary education level (ISCED 3).Please refer to the Reader’s Guide for more information on the data and symbols used in each table.160
G l o b a l e d u c a t i o n d i g e s t 2 0 1 0 C o m p a r i n g e d u c a t i o n s t a t i s t i c s a r o u n d t h e w o r l dUpper secondarygross graduation ratioGross entry ratioto tertiary educationRegionISCED 3C(no direct access to ISCED 5 education, excluding short programmes)ISCED 5AISCED 5BMF M F GPI MF M F GPI MF M F GPI13 14 15 16 17 18 19 20 21 22 23 24. . . . 51 -1 45 -1 57 -1 1.29 -1 40 -1 24 -1 56 -1 2.34 -1 Argentina. -1 . -1 . -1 . -1 ... ... ... ... ... ... ... ... Bolivia (a). . . . 43 39 47 1.20 45 47 44 0.92 ChileCountry or territory. -1 . -1 . -1 . -1 ... ... ... ... ... ... ... ... Colombia (a). -1 . -1 . -1 . -1 ... ... ... ... ... ... ... ... Costa Rica (a)- -1 - -1 - -1 0.97 -1 ... ... ... ... ... ... ... ... Ecuador (a). -1 . -1 . -1 . -1 ... ... ... ... ... ... ... ... Guatemala (a)... ... ... ... ... ... ... ... ... ... ... ... Jamaica3 3 4 1.03 33 33 33 1.00 2 3 2 0.71 Mexico. -1 . -1 . -1 . -1 ... ... ... ... ... ... ... ... Panama (a)... ... ... ... ... ... ... ... 5 -1 3 -1 7 -1 2.45 -1 Paraguay. . . . ... ... ... ... 21 19 24 1.26 Peru... ... ... ... 46 -2 33 -2 59 -2 1.78 -2 13 -2 13 -2 13 -2 1.02 -2 Uruguay2 1 2 3.30 50 44 57 1.27 10 8 12 1.45 Austria20 21 18 0.87 31 29 33 1.13 37 31 44 1.43 Belgium8 9 7 0.82 ... ... ... ... ... ... ... ... Canada. . . . 74 64 84 1.31 26 28 23 0.81 Cyprus48 44 53 1.18 59 -1 45 -1 74 -1 1.62 -1 24 -1 24 -1 23 -1 0.97 -1 Denmark. . . . 69 60 78 1.30 . . . . Finland4 3 4 1.46 ... ... ... ... ... ... ... ... France. . . . 37 36 37 1.04 14 11 17 1.54 Germany28 32 24 0.74 48 -1 37 -1 60 -1 1.61 -1 24 -1 22 -1 25 -1 1.14 -1 Greece39 43 33 0.77 72 54 92 1.69 6 6 6 1.10 Iceland5 5 5 0.99 46 43 50 1.14 20 19 21 1.14 Ireland3 5 1 0.21 61 54 68 1.24 26 24 29 1.23 Israel. . . . 54 -1 46 -1 62 -1 1.34 -1 - -1 - -1 - -1 . -1 Italy- - - . ... ... ... ... . -1 . -1 . -1 . -1 Liechtenstein20 22 18 0.82 ... ... ... ... ... ... ... ... Luxembourg41 49 33 0.67 49 -1 40 -1 58 -1 1.46 -1 15 -1 14 -1 16 -1 1.16 -1 Malta42 45 40 0.89 60 -1 55 -1 65 -1 1.18 -1 - -1 - -1 - -1 . -1 Netherlands41 46 36 0.78 70 55 85 1.54 - - - . Norwayx(5) -1 x(6) -1 x(7) -1 x(8) -1 73 -1 65 -1 81 -1 1.24 -1 1 -1 1 -1 1 -1 1.61 -1 Portugal20 20 20 1.00 45 39 52 1.36 26 24 28 1.16 Spain- 1 - 0.69 63 51 75 1.48 10 9 10 1.09 Sweden6 6 7 1.20 39 38 40 1.07 21 22 20 0.90 Switzerland... ... ... ... 56 -1 49 -1 63 -1 1.30 -1 31 -1 21 -1 42 -1 1.95 -1 United KingdomLatin America and the CaribbeanNorth America and Western Europe… … … … 63 56 70 1.25 x(17) x(18) x(19) x(20) United States of America- - - - ... ... ... ... ... ... ... ... Bhutan (a)... ... ... ... ... ... ... ... ... ... ... ... India... ... ... ... ... ... ... ... ... ... ... ... Sri LankaSouth and West Asia161
T a b l e8TERTIARY EDUCATION / ISCED 5 and 6 / Enrolment, graduation ratio and teaching staffRegion Total enrolment Gross enrolment ratio2008 1999 2008Country or territoryArab StatesMF (000) % F % Private MF M F GPI MF M F GPI1 2 3 4 5 6 7 8 9 10 11Algeria 902 -1 57 -1 ... 14 ** ... ... ... 24 -1 20 -1 28 -1 1.40 -1Bahrain 18 -2 68 -2 ... 22 16 ** 28 ** 1.75 ** 30 -2 18 -2 44 -2 2.53 -2Djibouti 2.2 -1 40 -1 ... - - - 1.05 3 -1 3 -1 2 -1 0.69 -1Egypt 2,488 ... ... 35 ** ... ... ... 28 ... ... ...Iraq ... ... ... 11 15 8 0.54 ... ... ... ...Jordan 255 51 29 27 +1 25 +1 29 +1 1.16 +1 41 39 43 1.11Kuwait ... ... ... 23 ** 14 ** 33 ** 2.40 ** ... ... ... ...Lebanon 200 +1 54 +1 56 +1 33 33 33 1.00 53 +1 48 +1 57 +1 1.19 +1Libyan Arab Jamahiriya ... ... ... 50 51 ** 50 ** 0.98 ** ... ... ... ...Mauritania 12 -1 ... ... 5 ... ... ... 4 -1 ... ... ...Morocco 401 47 11 9 11 8 0.71 12 13 12 0.89Oman 84 +1 51 +1 43 +1 ... ... ... ... 29 +1 27 +1 32 +1 1.18 +1Palestinian Autonomous Territories 181 54 58 25 26 23 0.89 47 42 52 1.23Qatar 13 64 29 24 ** 12 ** 41 ** 3.44 ** 11 5 31 6.05Saudi Arabia 667 62 6 20 16 24 1.50 30 23 37 1.65Sudan ... ... ... 6 6 6 0.92 ... ... ... ...Syrian Arab Republic ... ... ... ... ... ... ... ... ... ... ...Tunisia 351 59 2 17 ** 18 ** 17 ** 0.97 ** 34 27 40 1.49United Arab Emirates 77 60 58 18 ** 10 ** 29 ** 2.95 ** 25 17 36 2.05Yemen 237 -1 29 -1 20 -1 10 16 4 0.28 10 -1 14 -1 6 -1 0.42 -1Central and Eastern EuropeAlbania ... ... ... 16 13 18 1.40 ... ... ... ...Belarus 577 58 13 51 44 58 1.30 73 60 86 1.43Bosnia and Herzegovina 99 -1 ... ... ... ... ... ... 34 -1 ... ... ...Bulgaria 264 55 21 46 36 56 1.54 51 44 58 1.30Croatia 140 -1 54 -1 5 -1 31 28 33 1.16 47 -1 42 -1 52 -1 1.22 -1Czech Republic 395 55 14 26 26 27 1.03 59 51 67 1.32Estonia 68 62 84 50 42 59 1.40 64 48 80 1.69Hungary 414 58 16 34 30 38 1.24 65 54 77 1.43Latvia 128 64 95 50 38 63 1.65 69 48 91 1.89Lithuania 205 60 12 44 35 53 1.53 77 61 95 1.56Montenegro ... ... ... ... ... ... ... ... ... ... ...Poland 2,147 -1 57 -1 32 -1 45 38 52 1.38 67 -1 56 -1 78 -1 1.40 -1Republic of Moldova 144 58 16 33 * 29 * 37 * 1.29 * 40 * 33 * 47 * 1.45 *Romania 1,057 56 39 22 21 23 1.09 66 56 75 1.34Russian Federation 9,446 57 14 ... ... ... ... 77 66 89 1.36Serbia 238 55 18 ... ... ... ... 48 * 42 * 54 * 1.29 *Slovakia 229 60 11 26 25 28 1.11 54 42 66 1.58Slovenia 115 58 11 53 45 61 1.36 87 71 103 1.46The former Yugoslav Rep. of Macedonia 66 53 18 22 19 25 1.28 40 37 44 1.20Turkey 2,533 43 6 22 26 18 0.69 38 43 34 0.78Ukraine 2,848 54 * 15 47 44 50 1.15 79 71 * 88 * 1.25 *Central AsiaArmenia 107 -1 55 -1 23 -1 24 22 25 1.11 34 -1 31 -1 37 -1 1.20 -1Azerbaijan 180 +1 50 +1 12 +1 16 * 19 * 12 * 0.62 * … … … …162
G l o b a l e d u c a t i o n d i g e s t 2 0 1 0 C o m p a r i n g e d u c a t i o n s t a t i s t i c s a r o u n d t h e w o r l dDistribution of studentsby ISCED level (%)Female studentsby ISCED level (%)Gross graduation ratio,ISCED 5A, first degreeTeaching staffRegion2008 2008 2008 20085A 5B 6 5A 5B 6 MF M F GPI MF (000) % F12 13 14 15 16 17 18 19 20 21 22 2386 -1 10 -1 5 -1 59 -1 47 -1 46 -1 ... ... ... ... 32 -1 35 **, -1 AlgeriaCountry or territoryArab States92 -2 8 -2 - -2 70 -2 51 -2 - -2 15 -2 7 -2 24 -2 3.57 -2 ... ... Bahrain... ... . -1 ... ... . -1 ... ... ... ... 0.12 -1 17 -1 Djibouti... ... ... ... ... ... ... ... ... ... ... ... Egypt... ... ... ... ... ... ... ... ... ... ... ... Iraq88 11 1 51 57 30 33 -1 30 -1 36 -1 1.20 -1 9.7 24 Jordan... ... ... ... ... ... ... ... ... ... ... ... Kuwait87 +1 13 +1 1 +1 53 +1 55 +1 43 +1 32 +1 28 +1 36 +1 1.29 +1 24 +1 38 +1 Lebanon... ... ... ... ... ... ... ... ... ... ... ... Libyan Arab Jamahiriya... ... ... ... ... ... ... ... ... ... 0.35 -2 4 -2 Mauritania71 21 7 48 49 38 6 6 5 0.80 19 18 Morocco70 +1 30 +1 - +1 54 +1 44 +1 50 +1 13 +1 10 +1 18 +1 1.77 +1 5.0 +1 34 +1 Oman89 11 - 55 42 - 25 20 31 1.55 5.1 18 Palestinian Autonomous Territories81 19 . 71 33 . 4 2 16 9.43 1.1 37 Qatar... ... ... ... ... ... 16 -2 10 -2 24 -2 2.47 -2 28 -2 33 -2 Saudi Arabia... ... ... ... ... ... ... ... ... ... ... ... Sudan... ... ... ... ... ... ... ... ... ... ... ... Syrian Arab Republic60 ** 31 ** 9 ** ... ... ... ... ... ... ... 19 42 Tunisia72 28 . 61 57 . 13 -1 7 -1 23 -1 3.30 -1 4.7 31 United Arab Emirates... ... - -1 ... ... 19 -1 ... ... ... ... 7.4 -1 17 -1 Yemen... ... ... ... ... ... ... ... ... ... ... ... Albania72 27 1 59 54 55 41 ... ... ... 43 57 BelarusCentral and Eastern Europe96 -1 4 -1 - -1 ... ... ... ... ... ... ... 5.2 38 Bosnia and Herzegovina88 10 2 56 54 50 26 20 33 1.61 21 47 Bulgaria69 -1 30 -1 1 -1 56 -1 49 -1 45 -1 18 -1 15 -1 22 -1 1.51 -1 13 -1 41 -1 Croatia86 8 6 55 69 40 38 32 46 1.45 23 -2 38 -2 Czech Republic63 34 3 62 62 56 23 14 31 2.24 6.4 **, -2 48 **, -2 Estonia91 7 2 57 70 49 39 26 52 2.02 24 38 Hungary82 16 2 64 65 60 33 19 47 2.54 7.3 57 Latvia69 29 1 60 59 58 40 26 55 2.09 15 55 Lithuania... ... ... ... ... ... ... ... ... ... ... ... Montenegro97 -1 1 -1 1 -1 57 -1 80 -1 50 -1 48 -1 35 -1 61 -1 1.74 -1 99 -1 42 -1 Poland87 12 1 59 57 55 ... ... ... ... 7.5 56 Republic of Moldova97 - 3 57 62 46 68 47 90 1.92 32 43 Romania79 19 2 58 52 43 52 ... ... ... 692 55 Russian Federation77 22 - 56 52 52 15 12 19 1.67 13 -1 43 -1 Serbia94 1 5 61 65 46 57 39 77 1.99 12 44 Slovakia62 37 1 62 52 49 25 17 35 2.09 5.9 37 Slovenia96 3 - 53 71 53 32 25 39 1.54 3.5 44 The former Yugoslav Rep. of Macedonia69 30 1 44 41 43 17 -1 18 -1 16 -1 0.88 -1 99 40 Turkey83 15 1 55 * 52 * 57 ... ... ... ... 201 ... UkraineCentral Asia99 -1 . -1 1 -1 55 -1 . -1 37 -1 25 -1 21 -1 29 -1 1.36 -1 13 -1 47 -1 Armenia79 +1 20 +1 1 +1 45 +1 71 +1 40 +1 … … … … 26 +1 52 +1 Azerbaijan163
T a b l e8TERTIARY EDUCATION / ISCED 5 and 6 / Enrolment, graduation ratio and teaching staffRegion Total enrolment Gross enrolment ratioCountry or territory2008 1999 2008MF (000) % F % Private MF M F GPI MF M F GPI1 2 3 4 5 6 7 8 9 10 11Georgia 130 54 * 30 36 35 37 1.07 34 31 * 37 * 1.19 *Kazakhstan 635 +1 58 +1 47 +1 24 23 26 1.15 41 +1 34 +1 49 +1 1.45 +1Kyrgyzstan 296 57 10 29 28 30 1.04 52 44 60 1.36Mongolia 152 61 34 27 19 35 1.86 50 39 61 1.57Tajikistan 155 28 - 14 20 7 0.35 20 29 11 0.40Turkmenistan ... ... ... ... ... ... ... ... ... ... ...Uzbekistan 299 40 - 13 14 12 0.82 10 12 8 0.68East Asia and the PacificAustralia 1,118 55 5 65 59 72 1.22 77 67 87 1.30Brunei Darussalam 5.6 66 1 12 8 16 1.98 16 11 21 1.99Cambodia 123 34 ... 2 +1 3 +1 1 +1 0.34 +1 7 9 5 0.54China 26,692 49 ... 7 ... ... ... 23 22 23 1.04Cook Islands . . . . . . . . . . .Democratic People’s Republic of Korea ... ... ... ... ... ... ... ... ... ... ...Fiji ... ... ... ... ... ... ... ... ... ... ...Hong Kong SAR of China 158 -1 50 -1 6 -1 ... ... ... ... 34 -1 34 -1 35 -1 1.02 -1Indonesia 4,420 47 ... ... ... ... ... 21 22 20 0.92Japan 3,939 46 79 45 49 41 0.85 58 62 54 0.88Kiribati . . . . * . * . * . * . . . .Lao People’s Democratic Republic 89 43 34 2 3 2 0.49 13 15 12 0.78Macao, China 25 50 62 28 32 24 0.76 57 59 54 0.91Malaysia 805 -1 56 -1 36 -1 23 23 23 1.02 32 -1 28 -1 36 -1 1.29 -1Marshall Islands ... ... ... ... ... ... ... ... ... ... ...Micronesia (Federated States of) ... ... ... 14 ... ... ... ... ... ... ...Myanmar 508 -1 58 -1 - -1 7 -1 5 -1 8 -1 1.58 -1 11 -1 9 -1 12 -1 1.37 -1Nauru . -2 . -2 . -2 . . . . . -2 . -2 . -2 . -2New Zealand 244 58 12 64 52 76 1.47 78 64 94 1.48Niue . . . . . . . . . . .Palau ... ... ... 41 **, +1 25 **, +1 58 **, +1 2.35 **, +1 ... ... ... ...Papua New Guinea ... ... ... 2 ** 3 ** 1 ** 0.55 ** ... ... ... ...Philippines 2,651 54 66 28 25 32 1.26 29 26 32 1.24Republic of Korea 3,204 38 80 73 91 53 0.59 98 115 79 0.69Samoa ... ... ... 12 11 12 1.04 ... ... ... ...Singapore 199 +1 49 +1 61 +1 ... ... ... ... ... ... ... ...Solomon Islands . . . . . . . . . . .Thailand 2,417 +1 54 +1 17 +1 34 32 36 1.14 45 +1 40 +1 49 +1 1.24 +1Timor-Leste 17 +1 40 +1 ... ... ... ... ... 15 +1 18 +1 13 +1 0.71 +1Tokelau . . . . . . . . . . .Tonga ... ... ... 3 3 4 1.30 ... ... ... ...Tuvalu . . . . . . . . . . .Vanuatu ... ... ... 4 ** ... ... ... ... ... ... ...Viet Nam 1,655 49 11 11 12 9 0.76 ... ... ... ...Latin America and the CaribbeanAnguilla 0.05 83 81 . . . . 5 ** 2 ** 8 ** 5.01 **Antigua and Barbuda ... ... ... . . . . ... ... ... ...Argentina 2,208 -1 60 -1 26 -1 49 37 61 1.65 68 -1 54 -1 82 -1 1.52 -1164
G l o b a l e d u c a t i o n d i g e s t 2 0 1 0 C o m p a r i n g e d u c a t i o n s t a t i s t i c s a r o u n d t h e w o r l dDistribution of studentsby ISCED level (%)Female studentsby ISCED level (%)Gross graduation ratio,ISCED 5A, first degreeTeaching staffRegion2008 2008 2008 20085A 5B 6 5A 5B 6 MF M F GPI MF (000) % F12 13 14 15 16 17 18 19 20 21 22 2384 16 1 55 48 * 60 55 50 59 1.18 18 55 GeorgiaCountry or territory100 +1 . +1 - +1 58 +1 . +1 56 +1 61 +1 51 +1 71 +1 1.38 +1 38 +1 64 +1 Kazakhstan85 15 1 56 62 59 23 19 27 1.40 18 58 Kyrgyzstan96 2 1 60 81 60 42 30 55 1.85 8.7 57 Mongolia99 . 1 28 . 33 ... ... ... ... 8.8 30 Tajikistan... ... ... ... ... ... ... ... ... ... ... ... Turkmenistan99 . 1 40 . 42 12 14 9 0.66 24 39 Uzbekistan80 16 4 56 53 51 61 49 73 1.50 ... ... AustraliaEast Asia and the Pacific67 33 - 67 63 32 9 5 13 2.65 0.70 42 Brunei Darussalam... ... ... ... ... ... 4 -1 6 -1 3 -1 0.49 -1 3.3 -2 11 -2 Cambodia... 45 ... ... 51 ... 11 -1 12 -1 10 -1 0.87 -1 1,595 43 China. . . . . . . . . . . . Cook Islands... ... ... ... ... ... ... ... ... ... ... ... Democratic People’s Republic of Korea... ... ... ... ... ... ... ... ... ... 0.94 36 Fiji50 -1 46 -1 4 -1 53 -1 48 -1 42 -1 21 20 22 1.10 ... ... Hong Kong SAR of China79 20 2 * 49 44 36 * 7 ... ... ... 286 40 Indonesia76 22 2 42 62 31 41 46 36 0.79 516 ... Japan. . . . . . . . . . . . Kiribati39 61 . 41 45 . 3 -2 3 -2 2 -2 0.65 -2 3.0 34 Lao People’s Democratic Republic85 13 2 49 62 26 31 26 35 1.36 1.8 31 Macao, China55 -1 44 -1 1 -1 58 -1 53 -1 40 -1 17 -1 12 -1 21 -1 1.71 -1 42 -1 50 -1 Malaysia... ... ... ... ... ... ... ... ... ... ... ... Marshall Islands... ... ... ... ... ... ... ... ... ... ... ... Micronesia (Federated States of)99 -1 - -1 1 -1 58 -1 74 -1 84 -1 10 -1 6 -1 14 -1 2.21 -1 11 -1 82 -1 Myanmar. -2 . -2 . -2 . -2 . -2 . -2 . -2 . -2 . -2 . -2 . -2 . -2 Nauru70 27 3 59 57 52 48 36 61 1.68 14 50 New Zealand. . . . . . . . . . . . Niue... ... ... ... ... ... ... ... ... ... ... ... Palau... ... ... ... ... ... ... ... ... ... ... ... Papua New Guinea90 10 - 55 53 61 19 -2 14 -2 24 -2 1.68 -2 ... ... Philippines74 24 2 38 40 36 48 49 48 0.97 208 32 Republic of Korea... ... ... ... ... ... ... ... ... ... ... ... Samoa52 +1 45 +1 3 +1 51 +1 48 +1 36 +1 ... ... ... ... 15 +1 34 +1 Singapore. . . . . . . . . . . . Solomon Islands85 +1 15 +1 1 +1 56 +1 47 +1 50 +1 27 -2 20 -2 34 -2 1.70 -2 76 ** 68 ** Thailand100 +1 - +1 . +1 40 +1 - +1 . +1 ... ... ... ... 1.2 +1 25 +1 Timor-Leste. . . . . . . . . . . . Tokelau... ... ... ... ... ... ... ... ... ... ... ... Tonga. . . . . . . . . . . . Tuvalu... ... ... ... ... ... ... ... ... ... ... ... Vanuatu63 34 3 59 30 42 ... ... ... ... 56 45 Viet Nam81 19 . 82 90 . - **, -1 - **, -1 - **, -1 - **, -1 0.01 43 AnguillaLatin America and the Caribbean... ... ... ... ... ... ... ... ... ... ... ... Antigua and Barbuda69 -1 31 -1 1 -1 57 -1 67 -1 54 -1 11 -1 9 -1 14 -1 1.57 -1 177 -1 52 -1 Argentina165
T a b l e8TERTIARY EDUCATION / ISCED 5 and 6 / Enrolment, graduation ratio and teaching staffRegion Total enrolment Gross enrolment ratioCountry or territory2008 1999 2008MF (000) % F % Private MF M F GPI MF M F GPI1 2 3 4 5 6 7 8 9 10 11Aruba 2.2 58 15 27 25 29 1.15 33 27 38 1.39Bahamas ... ... ... ... ... ... ... ... ... ... ...Barbados 11 -1 68 -1 ... ... ... ... ... ... ... ... ...Belize 3.6 +1 64 +1 100 +1 ... ... ... ... 11 +1 8 +1 15 +1 1.85 +1Bermuda 0.89 -1 71 -1 - -1 ... ... ... ... 25 **, -1 15 **, -1 35 **, -1 **, -12.38Bolivia 353 *, -1 45 *, -1 20 *, -1 33 ... ... ... 38 *, -1 42 *, -1 35 *, -1 *, -10.84Brazil 5,958 56 72 14 13 16 1.26 34 30 39 1.29British Virgin Islands 0.02 90 ... 60 * 36 * 86 * 2.40 * 1 ** - ** 2 ** 8.30 **Cayman Islands 0.91 69 1 19 **, +1 10 **, +1 28 **, +1 2.79 **, +1 36 * 24 * 47 * 1.98 *Chile 753 -1 49 -1 77 -1 38 39 36 0.91 52 -1 52 -1 52 -1 1.01 -1Colombia 1,487 49 45 23 22 24 1.11 35 36 35 0.99Costa Rica ... ... ... 16 **, -1 15 **, -1 18 **, -1 1.18 **, -1 ... ... ... ...Cuba 971 +1 61 +1 . +1 21 19 22 1.19 118 +1 88 +1 149 +1 1.68 +1Dominica 0.23 76 ... . . . . 4 2 6 3.26Dominican Republic ... ... ... ... ... ... ... ... ... ... ...Ecuador 535 53 35 ... ... ... ... 42 39 45 1.15El Salvador 139 55 66 22 21 24 1.15 25 23 26 1.09Grenada 7.4 +1 57 +1 100 +1 . . . . 59 +1 51 +1 68 +1 1.34 +1Guatemala 234 -1 51 -1 49 -1 ... ... ... ... 18 -1 18 -1 18 -1 1.00 -1Guyana 7.3 59 - ... ... ... ... 12 10 13 1.42Haiti ... ... ... ... ... ... ... ... ... ... ...Honduras 148 * 60 * 33 * 14 ** 13 ** 16 ** 1.24 ** 19 * 15 * 22 * 1.51 *Jamaica 61 69 39 15 +1 11 +1 20 +1 1.82 +1 24 15 33 2.22Mexico 2,623 50 33 18 19 18 0.92 27 28 27 0.98Montserrat 0.05 80 ... ... ... ... ... 17 ** 6 ** 31 ** 4.99 **Netherlands Antilles ... ... ... 20 18 21 1.11 ... ... ... ...Nicaragua ... ... ... ... ... ... ... ... ... ... ...Panama 133 -1 61 -1 28 -1 41 31 50 1.59 45 -1 35 -1 56 -1 1.59 -1Paraguay 181 -1 57 -1 63 -1 13 11 15 1.38 29 -1 24 -1 33 -1 1.35 -1Peru 952 **, -2 51 **, -2 54 **, -2 ... ... ... ... 34 **, -2 33 **, -2 36 **, -2 **, -21.06Saint Kitts and Nevis 0.86 84 ... . . . . ... ... ... ...Saint Lucia 2.6 70 10 ... ... ... ... 15 9 20 2.25Saint Vincent and the Grenadines ... ... ... . . . . ... ... ... ...Suriname ... ... ... ... ... ... ... ... ... ... ...Trinidad and Tobago ... ... ... 6 5 7 1.38 ... ... ... ...Turks and Caicos Islands 0.002 50 100 . . . . - ** - ** - ** 0.90 **Uruguay 159 -1 63 -1 11 -1 34 ** 25 ** 44 ** 1.76 ** 64 -1 47 -1 82 -1 1.75 -1Venezuela 2,109 62 * 28 28 +1 23 +1 34 +1 1.46 +1 79 59 * 99 * 1.69 *North America and Western EuropeAndorra 0.46 58 ... ... ... ... ... 11 * 9 * 13 * 1.45 *Austria 285 53 ... 54 53 54 1.03 55 50 59 1.19Belgium 402 55 57 57 53 61 1.15 63 56 70 1.26Canada ... ... ... 60 52 69 1.34 ... ... ... ...Cyprus 26 49 70 21 * 19 * 23 * 1.25 * 43 * 44 * 42 * 0.96 *Denmark 232 -1 58 -1 2 -1 56 48 64 1.33 80 -1 67 -1 94 -1 1.41 -1Finland 310 54 11 82 74 91 1.22 94 85 105 1.24166
G l o b a l e d u c a t i o n d i g e s t 2 0 1 0 C o m p a r i n g e d u c a t i o n s t a t i s t i c s a r o u n d t h e w o r l dDistribution of studentsby ISCED level (%)Female studentsby ISCED level (%)Gross graduation ratio,ISCED 5A, first degreeTeaching staffRegion2008 2008 2008 20085A 5B 6 5A 5B 6 MF M F GPI MF (000) % F12 13 14 15 16 17 18 19 20 21 22 2327 73 . 69 54 . 5 3 7 2.56 0.21 54 Aruba... ... ... ... ... ... ... ... ... ... ... ... Bahamas51 -1 49 -1 1 -1 68 -1 68 -1 55 -1 ... ... ... ... 0.79 -1 49 -1 Barbados... ... . +1 ... ... . +1 ... ... ... ... ... ... Belize. -1 100 -1 . -1 . -1 71 -1 . -1 . **, -1 . **, -1 . **, -1 . **, -1 0.09 -1 55 -1 Bermuda88 *, -1 12 *, -1 ... 45 -1 43 *, -1 ... ... ... ... ... 16 -1 29 -1 Bolivia90 9 1 57 42 51 21 ** 16 ** 27 ** 1.72 ** 375 44 BrazilCountry or territory... ... ... ... ... ... ... ... ... ... ... ... British Virgin Islands11 89 . 73 68 . 3 * 2 * 4 * 2.31 * 0.03 59 Cayman Islands59 -1 40 -1 - -1 53 -1 44 -1 43 -1 15 -1 12 -1 18 -1 1.44 -1 55 -1 39 -1 Chile69 31 - 53 41 36 13 15 12 0.82 88 **, -1 35 **, -1 Colombia... ... ... ... ... ... ... ... ... ... ... ... Costa Rica99 +1 . +1 1 +1 61 +1 . +1 47 +1 43 +1 27 +1 61 +1 2.24 +1 155 +1 59 +1 Cuba... ... ... ... ... ... ... ... ... ... ... ... Dominica... ... ... ... ... ... ... ... ... ... ... ... Dominican Republic... ... ... ... ... ... ... ... ... ... 27 31 Ecuador85 15 - 55 53 38 10 9 11 1.30 8.6 34 El Salvador... ... - +1 ... ... - +1 ... ... ... ... ... ... Grenada... ... ... ... ... ... 2 -1 2 -1 1 -1 0.76 -1 3.8 -2 31 -2 Guatemala67 33 . 55 66 . 9 5 13 2.85 0.82 55 Guyana... ... ... ... ... ... ... ... ... ... ... ... Haiti... ... ... ... ... ... ... ... ... ... 5.3 * ... Honduras95 5 - * 69 67 - * ... ... ... ... ... ... Jamaica96 3 1 51 43 43 18 17 20 1.19 286 ... Mexico... ... ... ... ... ... . **, -1 . **, -1 . **, -1 . **, -1 . -1 . -1 Montserrat... ... ... ... ... ... ... ... ... ... ... ... Netherlands Antilles... ... ... ... ... ... ... ... ... ... ... ... Nicaragua93 -1 7 -1 - -1 61 -1 56 -1 51 -1 22 -1 14 -1 30 -1 2.15 -1 12 -1 47 -1 Panama89 -1 11 -1 - **, -1 55 -1 69 -1 - **, -1 ... ... ... ... ... ... Paraguay60 **, -2 40 **, -2 ... 47 -2 57 -2 ... ... ... ... ... ... ... Peru100 - - 84 - - ... ... ... ... ... ... Saint Kitts and Nevis90 10 . 71 55 . ... ... ... ... 0.19 ... Saint Lucia... ... ... ... ... ... ... ... ... ... ... ... Saint Vincent and the Grenadines... ... ... ... ... ... ... ... ... ... ... ... Suriname... ... ... ... ... ... ... ... ... ... ... ... Trinidad and Tobago100 - . 50 - . ... ... ... ... ... ... Turks and Caicos Islands91 -1 9 -1 - -1 63 -1 61 -1 42 -1 ... ... ... ... 16 -1 ... Uruguay73 27 - 64 * 58 * 58 * ... ... ... ... 123 * 34 ** Venezuela33 67 . 62 55 . 1 * 1 * 1 * 0.86 * 0.09 43 Andorra87 7 6 54 57 46 26 23 30 1.30 33 32 Austria48 50 2 52 58 44 28 25 31 1.26 27 42 Belgium... ... ... ... ... ... 36 -2 27 -2 45 -2 1.65 -2 ... ... Canada53 46 1 59 37 47 10 6 15 2.47 2.3 40 Cyprus85 -1 13 -1 2 -1 59 -1 47 -1 46 -1 52 -1 39 -1 65 -1 1.66 -1 ... ... Denmark93 - 7 54 5 53 88 61 116 1.89 14 51 FinlandNorth America and Western Europe167
T a b l e8TERTIARY EDUCATION / ISCED 5 and 6 / Enrolment, graduation ratio and teaching staffRegion Total enrolment Gross enrolment ratioCountry or territory2008 1999 2008MF (000) % F % Private MF M F GPI MF M F GPI1 2 3 4 5 6 7 8 9 10 11France 2,165 55 18 53 47 58 1.23 55 48 61 1.28Germany ... ... ... ... ... ... ... ... ... ... ...Gibraltar . . . . . . . . . . .Greece 603 -1 50 -1 - -1 47 45 49 1.11 91 -1 87 -1 95 -1 1.10 -1Holy See ... ... ... ... ... ... ... ... ... ... ...Iceland 17 64 21 40 30 50 1.69 75 52 99 1.91Ireland 179 54 5 46 42 50 1.20 58 53 64 1.22Israel 325 56 86 48 40 57 1.44 60 52 68 1.31Italy 2,034 -1 57 -1 8 -1 47 42 53 1.27 67 -1 56 -1 79 -1 1.41 -1Liechtenstein 0.80 33 100 ... ... ... ... 37 * 48 * 25 * 0.52 *Luxembourg 2.7 -2 52 -2 ... 11 10 11 1.10 10 -2 9 -2 11 -2 1.12 -2Malta 9.8 -1 57 -1 ... 20 18 21 1.13 33 -1 27 -1 39 -1 1.42 -1Monaco . . . . . . . . . . .Netherlands 602 52 ... 49 49 50 1.01 61 58 64 1.11Norway 213 61 14 66 55 77 1.40 73 56 91 1.62Portugal 367 -1 54 -1 25 -1 45 39 51 1.30 57 -1 51 -1 63 -1 1.22 -1San Marino 0.93 57 ... ... ... ... ... ... ... ... ...Spain 1,781 54 14 57 52 62 1.18 71 63 78 1.24Sweden 407 60 9 64 53 75 1.42 71 55 88 1.59Switzerland 224 49 17 37 43 31 0.73 49 49 49 1.00United Kingdom 2,329 57 100 60 55 64 1.16 57 48 67 1.40United States of America 18,248 57 26 71 62 ** 81 ** 1.32 ** 83 69 97 1.40South and West AsiaAfghanistan ... ... ... ... ... ... ... ... ... ... ...Bangladesh 1,145 -1 35 -1 49 -1 5 7 3 0.49 7 -1 9 -1 5 -1 0.55 -1Bhutan 5.1 35 - 3 ** 3 ** 2 ** 0.58 ** 7 8 5 0.59India 14,863 -1 39 -1 ... 10 +1 11 +1 8 +1 0.66 +1 13 -1 16 -1 11 -1 0.70 -1Iran (Islamic Republic of) 3,392 53 46 18 20 15 0.78 36 34 39 1.14Maldives - **, -2 - **, -2 ... . . . . - **, -2 - **, -2 - **, -2 **, -2-Nepal 255 -1 ... ... 4 +1 6 +1 2 +1 0.40 +1 ... ... ... ...Pakistan 974 * 45 * 33 * ... ... ... ... 5 * 6 * 5 * 0.85 *Sri Lanka ... ... ... ... ... ... ... ... ... ... ...Sub-Saharan AfricaAngola 49 -2 ... 34 -2 1 1 - 0.63 3 -2 ... ... ...Benin 43 -2 ... ... 3 5 ** 1 ** 0.25 ** 6 -2 ... ... ...Botswana 16 -2 53 -2 ... 5 6 5 0.92 8 -2 7 -2 8 -2 1.15 -2Burkina Faso 48 +1 32 +1 18 +1 1 1 - 0.30 3 +1 5 +1 2 +1 0.49 +1Burundi 24 +1 ... 53 +1 1 1 1 0.41 3 +1 ... ... ...Cameroon 174 +1 44 +1 13 +1 5 ... ... ... 9 +1 10 +1 8 +1 0.79 +1Cape Verde 6.7 56 56 2 ... ... ... 12 11 13 1.24Central African Republic 10 +1 31 +1 8 +1 2 3 1 0.19 2 +1 3 +1 1 +1 0.43 +1Chad 19 13 ... 1 +1 1 +1 - +1 0.18 +1 2 3 - 0.15Comoros ... ... ... 1 1 1 0.75 ... ... ... ...Congo ... ... ... 4 6 2 0.27 ... ... ... ...Côte d’Ivoire 157 -1 33 -1 36 -1 6 9 3 0.37 8 -1 11 -1 6 -1 0.50 -1Democratic Republic of the Congo 306 ... ... 1 ** ... ... ... 5 ... ... ...168
G l o b a l e d u c a t i o n d i g e s t 2 0 1 0 C o m p a r i n g e d u c a t i o n s t a t i s t i c s a r o u n d t h e w o r l dDistribution of studentsby ISCED level (%)Female studentsby ISCED level (%)Gross graduation ratio,ISCED 5A, first degreeTeaching staffRegion2008 2008 2008 20085A 5B 6 5A 5B 6 MF M F GPI MF (000) % F12 13 14 15 16 17 18 19 20 21 22 2372 25 3 56 55 47 36 32 40 1.27 ... ... France... ... ... 48 61 ... 32 27 38 1.37 305 37 Germany. . . . . . . . . . . . Gibraltar61 -1 35 -1 4 -1 54 -1 45 -1 42 -1 22 -1 15 -1 30 -1 2.01 -1 29 -1 35 -1 Greece... ... ... ... ... ... ... ... ... ... ... ... Holy See96 3 2 65 47 57 59 36 83 2.34 2.1 49 Iceland69 27 3 58 46 48 46 37 55 1.48 14 38 Ireland79 17 3 56 56 53 36 29 44 1.50 ... ... Israel98 -1 1 -1 2 -1 57 -1 57 -1 52 -1 41 -1 33 -1 50 -1 1.49 -1 104 -1 35 -1 ItalyCountry or territory93 . 7 33 . 28 32 * 40 * 24 * 0.61 * ... ... Liechtenstein68 -2 ... ... ... ... ... ... ... ... ... ... ... Luxembourg85 -1 14 -1 1 -1 58 -1 57 -1 35 -1 ... ... ... ... ... ... Malta. . . . . . . . . . . . Monaco99 . 1 52 . 42 45 38 51 1.33 47 38 Netherlands96 1 3 61 64 48 46 34 59 1.73 20 41 Norway94 -1 1 -1 5 -1 54 -1 62 -1 56 -1 ... ... ... ... 36 -1 43 -1 Portugal27 73 . 56 58 . ... ... ... ... ... ... San Marino83 13 4 54 52 52 37 28 46 1.63 146 38 Spain89 6 5 61 52 49 40 27 53 1.94 37 44 Sweden71 21 8 50 50 42 32 30 34 1.13 34 35 Switzerland74 22 3 55 65 46 39 -1 33 -1 45 -1 1.37 -1 134 42 United Kingdom74 24 3 56 60 50 35 30 42 1.40 1,371 46 United States of AmericaSouth and West Asia... ... ... ... ... ... ... ... ... ... ... ... Afghanistan90 -1 9 -1 1 -1 36 -1 25 -1 25 -1 ... ... ... ... 61 -1 18 -1 Bangladesh... ... ... ... ... ... ... ... ... ... 0.38 -2 ... Bhutan… … … … … … ... ... ... ... ... ... India77 23 1 57 41 33 10 -1 8 -1 11 -1 1.25 -1 144 19 Iran (Islamic Republic of)- **, -2 - **, -2 - **, -2 - **, -2 - **, -2 - **, -2 ... ... ... ... - **, -2 - **, -2 Maldives… … … ... ... ... ... ... ... ... 9.9 -1 ... Nepal94 * 5 * 1 * 45 * 45 * 27 * ... ... ... ... 53 * 37 * Pakistan... ... ... ... ... ... ... ... ... ... ... ... Sri Lanka100 -2 . -2 - -2 ... . -2 - -2 ... ... ... ... 1.3 -2 ... Angola... ... ... ... ... ... ... ... ... ... ... ... Benin... ... ... ... ... ... ... ... ... ... ... ... BotswanaSub-Saharan Africa80 +1 18 +1 2 +1 30 +1 43 +1 23 +1 2 3 1 0.39 2.5 +1 8 +1 Burkina Faso... ... ... ... ... ... ... ... ... ... 1.5 +1 ... Burundi83 +1 16 +1 - +1 43 +1 47 +1 35 +1 ... ... ... ... 3.8 18 Cameroon96 . 4 56 . 39 ... ... ... ... 0.79 43 Cape Verde77 +1 23 +1 - +1 27 +1 44 +1 ... ... ... ... ... 0.34 +1 ... Central African Republic... ... ... ... ... ... ... ... ... ... ... ... Chad... ... ... ... ... ... ... ... ... ... ... ... Comoros... ... ... ... ... ... ... ... ... ... ... ... Congo54 -1 39 -1 7 -1 30 -1 39 -1 26 -1 ... ... ... ... ... ... Côte d’Ivoire... ... ... ... ... ... ... ... ... ... 20 6 Democratic Republic of the Congo169
T a b l e8TERTIARY EDUCATION / ISCED 5 and 6 / Enrolment, graduation ratio and teaching staffRegion Total enrolment Gross enrolment ratioCountry or territory2008 1999 2008MF (000) % F % Private MF M F GPI MF M F GPI1 2 3 4 5 6 7 8 9 10 11Equatorial Guinea ... ... ... 3 +1 5 +1 2 +1 0.43 +1 ... ... ... ...Eritrea 9.9 +1 25 +1 - +1 1 2 - 0.16 2 +1 3 +1 1 +1 0.32 +1Ethiopia 265 24 18 1 2 - 0.23 4 5 2 0.31Gabon ... ... ... 7 9 5 0.54 ... ... ... ...Gambia ... ... ... 1 2 1 0.29 ... ... ... ...Ghana 140 -1 34 -1 ... ... ... ... ... 6 -1 8 -1 4 -1 0.54 -1Guinea 80 24 10 ... ... ... ... 9 14 5 0.34Guinea-Bissau 3.7 -2 ... ... - ** 1 ** - ** 0.18 ** 3 -2 ... ... ...Kenya 168 +1 41 +1 13 +1 3 +1 4 +1 2 +1 0.54 +1 4 +1 5 +1 3 +1 0.70 +1Lesotho 8.5 -2 55 -2 - -2 2 2 3 1.65 4 -2 3 -2 4 -2 1.19 -2Liberia ... ... ... 9 15 3 0.24 ... ... ... ...Madagascar 62 47 18 2 2 ** 2 ** 0.84 ** 3 4 3 0.89Malawi 6.5 -1 34 -1 - -1 - - - 0.38 - -1 1 -1 - -1 0.51 -1Mali 77 +1 29 +1 12 +1 2 3 1 0.46 5 +1 8 +1 3 +1 0.41 +1Mauritius 26 ** 53 ** 38 ** 10 ** 11 ** 10 ** 0.87 ** 26 ** 24 ** 28 ** 1.17 **Mozambique ... ... ... 1 ... ... ... ... ... ... ...Namibia 20 57 88 6 -1 6 -1 7 -1 1.13 -1 9 8 10 1.32Niger 16 +1 29 +1 29 +1 ... ... ... ... 1 +1 2 +1 1 +1 0.34 +1Nigeria ... ... ... 6 7 5 0.77 ... ... ... ...Rwanda 45 ... 54 1 ... ... ... 4 ... ... ...Sao Tome and Principe 0.70 +1 48 +1 ... . . . . 4 +1 4 +1 4 +1 0.93 +1Senegal 91 * 35 * ... 3 ... ... ... 8 * 10 * 6 * 0.54 *Seychelles . +1 . +1 . +1 . . . . . +1 . +1 . +1 . +1Sierra Leone ... ... ... ... ... ... ... ... ... ... ...Somalia ... ... ... ... ... ... ... ... ... ... ...South Africa ... ... ... ... ... ... ... ... ... ... ...Swaziland 5.7 -2 50 -2 - -2 5 5 4 0.87 4 -2 4 -2 4 -2 0.97 -2Togo 33 -1 ... ... ... ... ... ... 5 -1 ... ... ...Uganda 108 44 40 2 2 1 0.53 4 4 3 0.80United Republic of Tanzania 55 -1 32 -1 9 -1 1 1 - 0.27 1 -1 2 -1 1 -1 0.48 -1Zambia ... ... ... 2 ** 3 ** 1 ** 0.46 ** ... ... ... ...Zimbabwe ... ... ... 3 ** ... ... ... ... ... ... ...REGIONAL AVERAGESWorld 158,713 ** 51 ** ... 18 ** 18 ** 18 ** 0.98 ** 26 ** 25 ** 27 ** 1.08 **Arab States 7,308 ** 48 # ... 19 22 ** 17 ** 0.78 ** 21 ** 22 # 21 # 0.97 #Central and Eastern Europe 21,137 55 ... 38 ** 35 ** 42 ** 1.19 ** 64 57 72 1.28Central Asia 2,108 52 ... 19 20 19 0.95 25 24 27 1.10East Asia and the Pacific 48,608 49 # ... 14 15 # 13 # 0.81 # 26 # 26 # 26 # 1.01 #Latin America and the Caribbean 19,723 55 ** ... 21 19 22 1.15 38 ** 34 ** 42 ** 1.25 **North America and Western Europe 34,423 56 ... 60 54 67 1.23 70 61 80 1.32South and West Asia 20,889 41 # ... 8 # 9 # 6 # 0.65 # 13 # 14 # 11 # 0.76 #Sub-Saharan Africa 4,517 40 # ... 4 5 ** 3 ** 0.70 ** 6 ** 7 # 5 # 0.66 #Please refer to the Reader’s Guide for more information on the data and symbols used in each table.170
G l o b a l e d u c a t i o n d i g e s t 2 0 1 0 C o m p a r i n g e d u c a t i o n s t a t i s t i c s a r o u n d t h e w o r l dDistribution of studentsby ISCED level (%)Female studentsby ISCED level (%)Gross graduation ratio,ISCED 5A, first degreeTeaching staffRegion2008 2008 2008 20085A 5B 6 5A 5B 6 MF M F GPI MF (000) % F12 13 14 15 16 17 18 19 20 21 22 23Country or territory... ... ... ... ... ... ... ... ... ... ... ... Equatorial Guinea... ... . +1 ... ... . +1 ... ... ... ... 0.62 +1 ... Eritrea100 . - 24 . 3 3 5 1 0.25 8.4 8 Ethiopia... ... ... ... ... ... ... ... ... ... ... ... Gabon... ... ... ... ... ... ... ... ... ... ... ... Gambia73 -1 26 -1 - -1 35 -1 33 -1 26 -1 ... ... ... ... 4.0 -1 11 -1 Ghana92 8 . 23 38 . ... ... ... ... 2.2 5 Guinea... ... ... ... ... ... ... ... ... ... 0.03 -2 ... Guinea-Bissau69 +1 27 +1 4 +1 40 +1 44 +1 40 +1 ... ... ... ... ... ... Kenya79 -2 21 -2 . -2 51 -2 70 -2 . -2 ... ... ... ... 0.64 -2 47 -2 Lesotho... ... ... ... ... ... ... ... ... ... ... ... Liberia67 30 3 48 47 40 1 1 1 0.99 3.5 31 Madagascar100 -1 . -1 . -1 34 -1 . -1 . -1 1 -1 1 -1 - -1 0.53 -1 0.86 -1 34 **, -1 Malawi86 +1 14 +1 - +1 26 +1 48 +1 10 +1 ... ... ... ... ... ... Mali73 ** 26 ** 2 ** 54 ** 53 ** 39 ** ... ... ... ... ... ... Mauritius... ... ... ... ... ... ... ... ... ... ... ... Mozambique64 35 2 57 57 48 6 5 8 1.54 1.2 41 Namibia78 +1 20 +1 2 +1 23 +1 51 +1 42 +1 ... ... ... ... 1.2 +1 14 +1 Niger... ... ... ... ... ... ... ... ... ... ... ... Nigeria... ... ... ... ... ... ... ... ... ... ... ... Rwanda... ... ... ... ... ... . -1 . -1 . -1 . -1 . . Sao Tome and Principe... ... ... ... ... ... ... ... ... ... ... ... Senegal. +1 . +1 . +1 . +1 . +1 . +1 . +1 . +1 . +1 . +1 . +1 . +1 Seychelles... ... ... ... ... ... ... ... ... ... ... ... Sierra Leone... ... ... ... ... ... ... ... ... ... ... ... Somalia... ... ... ... ... ... ... ... ... ... ... ... South Africa99 -2 . -2 1 -2 50 -2 . -2 50 -2 8 -2 7 -2 8 -2 1.15 -2 0.46 -2 40 -2 Swaziland88 -1 12 -1 - -1 ... ... - -1 ... ... ... ... 0.47 -1 11 **, -1 Togo... ... ... ... ... ... ... ... ... ... 3.6 ... Uganda... ... ... ... ... ... ... ... ... ... 3.0 -1 18 -1 United Republic of Tanzania... ... ... ... ... ... ... ... ... ... ... ... Zambia... ... ... ... ... ... ... ... ... ... ... ... ZimbabweREGIONAL AVERAGES77 ** 21 ** 1 ** 50 ** 51 44 ** ... ... ... ... 10,110 # 40 # World85 # 12 # 3 # 32 # 27 # 39 # ... ... ... ... 302 # 31 # Arab States82 17 2 56 51 46 ... ... ... ... 1,324 50 # Central and Eastern Europe96 3 1 52 59 50 ... ... ... ... 154 52 Central Asia65 # 34 1 # 48 ** 50 36 ** ... ... ... ... 3,010 # 39 # East Asia and the Pacific83 # 17 # 1 # 55 ** 52 ** 47 # ... ... ... ... 1,475 # 39 # Latin America and the Caribbean76 21 3 56 59 49 ... ... ... ... 2,701 ** 42 ** North America and Western Europe95 # 5 # 0 # 41 # 40 # 35 # ... ... ... ... 961 # 35 # South and West Asia67 # 31 # 1 # 33 # 43 # 29 # ... ... ... ... 185 # 20 # Sub-Saharan Africa171
TERTIARY EDUCATION / ISCED 5 and 6 / Internationally mobile students by host countryT a b l e9 and region of origin / 2008 (countries with more than 1,000 mobile students)172RegionStudents from abroad studying in given country(inbound mobile students)Mobile students by region of originInbound mobilityCentral and EasternHost country or territory MF % Frate (%)Arab StatesEuropeCentral Asia1 2 3 4 5 6Arab StatesAlgeria 5,709 -1 ... 0.6 -1 x(12) x(12) x(12)Egypt 35,031 -1 ... 1.4 **, -1 x(12) x(12) x(12)Jordan 26,637 33 10.5 21,015 215 11Kuwait (m) 2,472 ... ... 1,812 24 5Lebanon 22,674 -1 54 -1 12.1 -1 x(12) x(12) x(12)Morocco 7,598 ... 1.9 2,054 27 11Qatar 3,393 ... 27.0 2,366 31 21Saudi Arabia 15,759 42 2.4 x(12) x(12) x(12)Tunisia 2,480 ... 0.7 x(12) x(12) x(12)Yemen 6,423 -1 28 -1 2.7 -1 x(12) x(12) x(12)Central and Eastern EuropeBelarus 5,909 ... 1.0 605 3,231 318Bulgaria 9,268 39 3.5 194 7,332 115Croatia 3,488 -1 52 -1 2.5 -1 2 -1 3,372 -1 x(12)Czech Republic 27,958 51 7.1 414 22,385 821Estonia 1,032 54 1.5 1 247 10Hungary 15,459 50 3.7 120 8,737 132Latvia 1,475 ... 1.2 39 942 120Lithuania 2,955 53 1.4 94 2,122 26Poland 13,021 -1 50 -1 0.6 -1 353 -1 6,471 -1 795 -1Republic of Moldova 1,613 ... 1.1 256 1,085 21Romania 13,857 45 1.3 1,866 8,418 48Russian Federation 60,288 -1 ... 0.6 -1 x(12) 19,249 -1 34,522 -1Serbia 11,259 ... 4.7 18 11,060 x(12)Slovakia 5,197 43 2.3 545 3,221 30Slovenia 1,361 59 1.2 2 1,138 2The former Yugoslav Rep. of Macedonia 1,338 38 2.0 3 1,317 1Turkey 20,219 33 0.8 1,066 3,829 6,184Ukraine 32,573 ... 1.1 5,965 6,628 1,136Central AsiaArmenia 4,239 -1 42 -1 3.9 -1 341 -1 860 -1 1,184 -1Azerbaijan 6,316 +1 20 +1 3.5 +1 153 +1 4,249 +1 292 +1Kazakhstan 10,458 +1 ... 1.6 +1 5 +1 2,634 +1 5,097 +1Kyrgyzstan 25,603 59 8.6 624 1,930 22,177Mongolia 1,207 45 0.8 x(12) 593 10Tajikistan 3,001 ... 1.9 9 174 2,351East Asia and the PacificAustralia 230,635 47 20.6 5,172 1,641 238China 51,038 45 0.2 x(12) x(12) x(12)Fiji 7,444 55 ... 2 x(12) x(12)Hong Kong SAR of China 7,362 52 ... x(12) 1 x(12)Indonesia 3,023 ... 0.1 17 36 2Japan 126,568 49 3.2 597 1,221 1,362Macao, China 12,648 40 49.8 x(12) 2 1Malaysia 30,581 -1 ... 3.8 -1 5,166 -1 248 -1 252 -1New Zealand 31,565 48 12.9 454 428 46Philippines 2,665 ... 0.1 35 19 1Republic of Korea 40,322 49 1.3 160 412 1,646Thailand 16,361 +1 47 +1 0.7 +1 49 +1 103 +1 35 +1
G l o b a l e d u c a t i o n d i g e s t 2 0 1 0 C o m p a r i n g e d u c a t i o n s t a t i s t i c s a r o u n d t h e w o r l dMobile students by region of originRegionEast Asia and Latin America and North America and South andthe Pacificthe Caribbean Western EuropeWest Asia Sub-Saharan Africa Unspecified Host country or territory7 8 9 10 11 12Arab Statesx(12) x(12) x(12) x(12) x(12) 5,709 -1 Algeriax(12) x(12) x(12) x(12) x(12) 35,031 -1 Egypt931 449 3,222 207 253 334 Jordan38 4 83 218 172 116 Kuwait (m)x(12) x(12) x(12) x(12) x(12) 22,674 -1 Lebanon118 3 59 26 4,541 759 Morocco46 12 177 608 132 - Qatarx(12) x(12) x(12) x(12) x(12) 15,759 Saudi Arabiax(12) x(12) x(12) x(12) x(12) 2,480 Tunisiax(12) x(12) x(12) x(12) x(12) 6,423 -1 Yemen649 15 81 827 164 19 Belarus66 9 1,352 118 82 - Bulgaria1 -1 x(12) 43 -1 x(12) 4 -1 66 -1 CroatiaCentral and Eastern Europe1,007 217 2,473 218 316 107 Czech Republic58 4 696 8 8 - Estonia566 40 4,946 645 272 1 Hungary11 2 240 104 16 1 Latvia27 9 622 46 9 - Lithuania744 -1 97 -1 3,479 -1 597 -1 485 -1 - -1 Poland8 x(12) 220 18 5 - Republic of Moldova294 103 2,372 350 360 46 Romaniax(12) x(12) x(12) x(12) x(12) 6,517 -1 Russian Federation14 15 118 5 20 9 Serbia59 29 1,246 21 46 - Slovakia4 7 175 6 6 21 Sloveniax(12) x(12) 9 x(12) x(12) 8 The former Yugoslav Rep. of Macedonia291 10 1,632 1,507 380 5,320 Turkey6,915 x(12) x(12) 3,787 x(12) 8,142 UkraineCentral Asia17 -1 1 -1 51 -1 1,749 -1 x(12) 36 -1 Armenia194 +1 x(12) 20 +1 1,383 +1 25 +1 - +1 Azerbaijan2,164 +1 2 +1 45 +1 505 +1 6 +1 - +1 Kazakhstan303 x(12) x(12) 569 x(12) - Kyrgyzstan577 2 16 5 x(12) 4 Mongolia10 x(12) 1 456 x(12) - Tajikistan136,843 2,741 16,483 40,390 6,926 20,201 Australiax(12) x(12) x(12) x(12) x(12) 51,038 China7,281 1 51 14 2 93 FijiEast Asia and the Pacific7,086 x(12) 101 42 x(12) 132 Hong Kong SAR of China2,891 6 25 11 28 7 Indonesia111,949 1,312 4,588 4,960 566 13 Japan12,494 5 92 3 51 - Macao, China15,138 -1 25 -1 313 -1 6,751 -1 1,947 -1 741 -1 Malaysia19,755 350 5,554 4,679 302 - New Zealand1,559 46 335 438 80 152 Philippines34,353 176 1,041 1,399 243 892 Republic of Korea12,794 +1 44 +1 1,875 +1 1,242 +1 159 +1 60 +1 Thailand173
TERTIARY EDUCATION / ISCED 5 and 6 / Internationally mobile students by host countryT a b l e9 and region of origin / 2008 (countries with more than 1,000 mobile students)RegionStudents from abroad studying in given country(inbound mobile students)Mobile students by region of originInbound mobilityCentral and EasternHost country or territory MF % Frate (%)Arab StatesEuropeCentral Asia1 2 3 4 5 6Viet Nam 3,362 ... 0.2 x(12) 26 13Latin America and the CaribbeanChile 7,946 -1 ... 1.1 -1 10 -1 32 -1 1 -1Costa Rica (m) 1,480 ... ... 1 20 x(12)Cuba 30,961 +1 ... 3.2 +1 183 +1 10 +1 29 +1Grenada 4,240 +1 ... 57.5 +1 10 +1 17 +1 5 +1Venezuela 1,913 ... 0.1 x(12) x(12) x(12)North America and Western EuropeAustria 53,396 53 18.7 541 18,183 477Belgium 29,844 58 7.4 107 53 23Canada (m) 68,520 -2 44 -2 ... 9,282 -2 3,198 -2 123 -2Cyprus 7,176 23 27.9 261 577 49Denmark 12,695 -1 59 -1 5.5 -1 66 -1 703 -1 49 -1Finland 11,303 43 3.7 176 3,065 80France 243,436 51 11.2 69,133 21,330 1,593Germany (m) 189,347 ... ... 11,563 62,878 5,874Greece 21,160 -1 ... 3.5 -1 1,186 -1 5,984 -1 423 -1Ireland (m) 12,794 72 7.2 420 620 19Italy 57,271 -1 59 -1 2.8 -1 3,236 -1 23,675 -1 217 -1Luxembourg 1,137 -2 ... 42.2 -2 20 -2 85 -2 5 -2Netherlands 30,052 58 5.0 308 1,978 48Norway 16,104 57 7.6 348 2,485 89Portugal 17,950 -1 48 -1 4.9 -1 30 -1 676 -1 9 -1Spain 37,726 55 2.1 3,037 2,666 75Sweden 22,653 41 5.6 275 1,407 127Switzerland 31,706 48 14.1 1,160 3,810 210United Kingdom 341,791 48 14.7 17,706 25,002 1,991United States of America 624,474 ... 3.4 22,636 34,994 5,200South and West AsiaIndia (m) 12,374 -2 39 -2 0.1 -2 3,453 -2 52 -2 137 -2Iran (Islamic Republic of) 1,233 42 - 266 34 33Sub-Saharan AfricaCameroon 1,417 -1 ... 1.1 -1 x(12) x(12) x(12)Ghana 1,899 -1 52 -1 1.4 -1 3 -1 x(12) x(12)Madagascar 1,066 26 1.7 x(12) x(12) x(12)Namibia 2,004 ... 10.2 1 1 x(12)Niger 1,026 +1 8 +1 6.4 +1 5 +1 3 +1 x(12)South Africa (m) 63,964 ... ... 42 x(12) x(12)REGIONAL AVERAGESWORLD 2,965,840 49 ** 1.9 ** 206,549 330,563 96,314Arab States 132,752 … 1.8 ** 36,481 652 299Central and Eastern Europe 228,753 … 1.1 11,543 106,683 44,281Central Asia 51,375 … 2.4 1,105 10,229 31,205East Asia and the Pacific 559,236 47 1.2 # 11,630 4,070 3,607Latin America and the Caribbean 57,709 ... 0.3 ** 177 86 42North America and Western Europe 1,841,933 50 ** 5.4 141,639 208,689 16,707South and West Asia 14,665 40 0.1 # 3,823 103 173Sub-Saharan Africa 79,417 ... 1.8 ** 152 52 -174(m) Incomplete data. For details see technical note E (student mobility) in the Reader’s Guide.Please refer to the Reader’s Guide for more information on the data and symbols used in each table.
G l o b a l e d u c a t i o n d i g e s t 2 0 1 0 C o m p a r i n g e d u c a t i o n s t a t i s t i c s a r o u n d t h e w o r l dMobile students by region of originRegionEast Asia and Latin America and North America and South andthe Pacificthe Caribbean Western EuropeWest Asia Sub-Saharan Africa Unspecified Host country or territory7 8 9 10 11 123,310 - 11 1 1 - Viet Nam100 -1 4,331 -1 367 -1 4 -1 9 -1 3,092 -1 Chile63 1,058 316 1 1 20 Costa Rica (m)3,009 +1 24,172 +1 115 +1 1,015 +1 2,056 +1 372 +1 Cuba51 +1 352 +1 3,510 +1 114 +1 179 +1 2 +1 Grenadax(12) 1,853 x(12) x(12) 55 5 Venezuela2,651 633 29,018 1,344 489 62 Austria16 30 2,373 7 365 26,870 Belgium18,267 -2 6,315 -2 15,768 -2 5,760 -2 5,181 -2 4,626 -2 Canada (m)1,035 18 654 4,160 422 - Cyprus1,496 -1 203 -1 9,383 -1 373 -1 234 -1 188 -1 Denmark2,394 305 2,378 1,118 1,745 42 Finland33,202 12,769 37,240 3,789 45,919 18,461 France33,687 7,356 35,319 7,456 8,517 16,697 Germany (m)89 -1 57 -1 12,571 -1 79 -1 602 -1 169 -1 Greece2,563 110 6,675 602 523 1,262 Ireland (m)2,879 -1 5,217 -1 14,312 -1 2,110 -1 3,422 -1 2,203 -1 Italy17 -2 8 -2 933 -2 2 -2 61 -2 6 -2 Luxembourg2,450 529 15,281 306 386 8,766 Netherlands1,227 403 5,139 1,120 1,540 3,753 Norway226 -1 2,805 -1 2,543 -1 49 -1 11,603 -1 9 -1 Portugal464 18,406 9,057 148 1,085 2,788 Spain2,419 352 3,780 3,413 897 9,983 Sweden1,463 1,686 20,013 759 1,284 1,321 Switzerland89,944 7,809 118,357 44,509 28,246 8,227 United KingdomLatin America and the CaribbeanNorth America and Western Europe267,367 64,768 79,685 117,397 31,748 679 United States of America1,735 -2 40 -2 761 -2 3,767 -2 1,898 -2 531 -2 India (m)South and West Asia39 x(12) 37 619 10 195 Iran (Islamic Republic of)Sub-Saharan Africax(12) x(12) x(12) x(12) 1,415 -1 2 -1 Cameroon2 -1 x(12) 7 -1 4 -1 1,583 -1 300 -1 Ghanax(12) x(12) x(12) x(12) 923 143 Madagascar15 1 33 4 1,218 731 Namibiax(12) x(12) x(12) x(12) 1,018 +1 - +1 Nigerx(12) x(12) x(12) x(12) 46,857 17,065 South Africa (m)REGIONAL AVERAGES846,618 177,995 486,981 275,840 223,181 321,799 WORLD2,089 524 4,015 2,448 7,138 79,107 Arab States10,714 557 19,705 8,257 2,173 24,840 Central and Eastern Europe3,040 6 130 5,207 34 419 Central Asia361,733 4,702 30,037 59,868 10,288 73,301 East Asia and the Pacific2,656 40,908 5,136 579 1,744 6,381 Latin America and the Caribbean464,479 131,257 427,079 194,937 145,189 111,959 North America and Western Europe1,796 40 812 4,524 1,997 1,397 South and West Asia111 - 67 20 54,618 24,396 Sub-Saharan Africa175
T a b l e10 TERTIARY EDUCATION / ISCED 5 and 6 / International flows of mobile students / 2008RegionCountry or territoryStudents from a given countrystudying abroad(outbound mobile students)Top five destinations (host countries) for outbound mobile students(The number of students from given country studying in the host countries is shown in brackets)Numberof studentsfrom abroadstudying ingiven country(inbound mobilestudents)Net flowof mobile students(Inbound – outbound)MFOutboundmobilityratio(%)GrossoutboundenrolmentratioMFNet flowratio(%)1 2 3 4 5 6 7Arab StatesAlgeria 21,726 2.6 -1 0.6 France (18,780), Canada (1,197) -2 , U.K. (335), U.S.A. (179), Germany (158) 5,709 -1 -17,444 -1 -1.9 -1Bahrain 3,374 16.2 -2 5.1 U.K. (980), Jordan (634), India (435) -2 , U.S.A. (394), Australia (253) 672 -2 -2,316 -2 -12.6 -2Djibouti 1,390 67.0 -1 1.6 France (911), Morocco (150), Cuba (76) +1 , India (54) -2 , Malaysia (51) -1 - -2 ... ...Egypt 8,709 0.3 0.1 U.S.A. (1,768), U.K. (1,395), France (1,032), Germany (1,017), Canada (498) -2 35,031 **, -1 26,993 **, -1 **, -11.1Iraq 6,243 ... 0.2 Jordan (2,283), Malaysia (738) -1 , U.K. (557), Germany (324), U.S.A. (307) ... ... ...Jordan 9,692 3.8 1.5 Ukraine (2,215), U.S.A. (1,801), U.K. (1,286), Malaysia (529) -1 , Germany (464) 26,637 16,945 6.7Kuwait 6,691 ... 3.1 Jordan (1,954), U.S.A. (1,825), U.K. (1,265), Slovakia (413), Australia (240) 2,472 -4,219 ...Lebanon 12,839 6.5 3.4 France (5,609), U.S.A. (1,809), Canada (1,056) -2 , Germany (680), Italy (649) -1 22,674 -1 9,910 -1 5.3 -1Libyan Arab Jamahiriya 3,558 ** ... 0.5 ** U.K. (1,623), Malaysia (621) -1 , France (235), Germany (195), U.S.A. (155) ... ... ...Mauritania 2,921 24.2 -1 0.9 France (1,119), Morocco (931), Germany (142), Jordan (76), Canada (60) -2 ... ... ...Morocco 41,254 10.3 1.3 France (26,998), Germany (3,699), Spain (2,735), Canada (2,652) -2 , U.S.A. (1,133) 7,598 -33,656 -8.4Oman 5,641 7.6 2.0 U.K. (1,762), Jordan (1,217), Australia (522), Malaysia (456) -1 , India (432) -2 165 -1 -4,720 -1 -7.7 -1Palestinian A.T. 9,733 5.4 2.5 Jordan (6,846), Qatar (426), U.S.A. (249), Malaysia (206) -1 , Turkey (192) - -9,733 -5.4Qatar 1,919 15.3 1.7 U.K. (704), U.S.A. (345), Jordan (267), India (231) -2 , Australia (122) 3,393 1,474 11.7Saudi Arabia 21,737 3.3 1.0 U.S.A. (9,884), U.K. (3,535), Jordan (3,008), Australia (1,929), Kuwait (698) 15,759 -5,978 -0.9Sudan 2,792 ** ... 0.1 ** Malaysia (634) -1 , U.K. (347), U.S.A. (224), Germany (209), Qatar (137) ... ... ...Syrian Arab Republic 14,122 ... 0.6 Jordan (2,788), France (2,334), Ukraine (1,809), Germany (1,664), Kyrgyzstan (624) ... ... ...Tunisia 17,954 5.1 1.7 France (10,812), Germany (2,491), Canada (1,137) -2 , Romania (868), Ukraine (611) 2,480 -15,474 -4.4United Arab Emirates 6,959 ** 9.0 ** 2.3 ** U.K. (2,309), Australia (1,184), India (1,110) -2 , U.S.A. (984), Canada (573) -2 ... ... ...Yemen 7,388 -2 3.7 -2 0.3 -2 Malaysia (1,271) -1 , Jordan (954), Germany (299), U.S.A. (233), India (214) -2 6,423 -1 ... ...Central and Eastern EuropeAlbania 19,930 -1 ... 6.7 -1 Italy (11,883) -1 , Greece (4,253) -1 , U.S.A. (690), Turkey (590), Germany (449) ... ... ...Belarus 14,804 -1 2.7 -1 1.8 -1 Russian Fed. (8,405) -1 , Germany (1,831), Poland (1,780) -1 , Lithuania (1,507), France (517) 5,909 ... ...Bosnia and Herzegovina 15,157 14.9 -1 5.2 Serbia (6,149), Croatia (2,974) -1 , Austria (2,742), Germany (1,018), Turkey (495) ... ... ...Bulgaria 23,077 8.7 4.5 Germany (9,794), U.S.A. (3,208), France (2,322), U.K. (1,251), Turkey (1,179) 9,268 -13,809 -5.2Croatia 6,577 4.2 -1 2.3 Austria (1,440), Italy (1,353) -1 , Germany (950), Slovenia (647), U.S.A. (603) 3,488 -1 -2,457 -1 -1.8 -1Czech Republic 9,351 2.4 1.4 Slovakia (2,584), Germany (1,698), U.K. (1,301), U.S.A. (923), France (751) 27,958 18,607 4.7Estonia 3,460 5.1 3.2 Finland (681), U.K. (658), Germany (594), Russian Fed. (558) -1 , U.S.A. (245) 1,032 -2,428 -3.6Hungary 7,050 1.7 1.1 Germany (1,837), Austria (1,391), U.K. (1,026), U.S.A. (711), France (584) 15,459 8,409 2.0Latvia 4,059 3.2 2.2 U.K. (1,145), Russian Fed. (788) -1 , Germany (684), U.S.A. (363), France (165) 1,475 -2,584 -2.0Lithuania 6,928 3.4 2.6 U.K. (1,968), Germany (1,302), Russian Fed. (869) -1 , U.S.A. (496), Poland (397) -1 2,955 -3,973 -1.9Montenegro 4,474 ... 8.9 Serbia (4,095), U.S.A. (107), Germany (104), Romania (42), Austria (25) ... ... ...Poland 32,599 1.5 -1 1.0 Germany (10,797), U.K. (8,572), France (3,260), U.S.A. (2,734), Austria (1,637) 13,021 -1 -19,868 -1 -0.9 -1Republic of Moldova 12,476 8.7 3.5 Romania (6,315), Russian Fed. (1,443) -1 , Ukraine (1,038), France (794), Germany (577) 1,613 -10,863 -7.6Romania 22,432 2.1 1.4 France (3,844), Germany (3,380), Hungary (3,134), U.S.A. (2,905), Italy (2,456) -1 13,857 -8,575 -0.8Russian Federation 43,982 0.5 0.4 Germany (9,795), U.S.A. (4,911), Ukraine (4,734), France (3,347), U.K. (2,646) 60,288 -1 17,411 -1 0.2 -1Serbia 9,318 ** 3.9 ** 1.9 ** Australia (1497), Hungary (1310), U.S.A.(1194), Germany (902), The FYR of Macedonia (898) 11,259 ... ...Slovakia 26,395 11.5 6.2 Czech Rep. (18,659), Hungary (2,178), Austria (1,470), U.K. (1,116), Germany (1,072) 5,197 -21,198 -9.2Slovenia 2,412 2.1 1.8 Austria (653), Italy (387) -1 , Germany (324), U.K. (285), U.S.A. (210) 1,361 -1,051 -0.9176
G l o b a l e d u c a t i o n d i g e s t 2 0 1 0 C o m p a r i n g e d u c a t i o n s t a t i s t i c s a r o u n d t h e w o r l dRegionCountry or territoryStudents from a given countrystudying abroad(outbound mobile students)Top five destinations (host countries) for outbound mobile students(The number of students from given country studying in the host countries is shown in brackets)Numberof studentsfrom abroadstudying ingiven country(inbound mobilestudents)Net flowof mobile students(Inbound – outbound)MFOutboundmobilityratio(%)GrossoutboundenrolmentratioMFNet flowratio(%)1 2 3 4 5 6 7The former Yugoslav Rep. of Macedonia 5,742 8.8 3.5 Bulgaria (3,023), Germany (435), Austria (343), Turkey (332), Italy (305) -1 1,338 -4,404 -6.7Turkey 41,120 1.6 0.6 U.S.A. (12,043), Germany (8,899), Azerbaijan (4,010) +1 , Bulgaria (2,812), U.K. (2,370) 20,219 -20,901 -0.8Ukraine 27,214 ** 1.0 ** 0.8 ** Russian Fed. (7,186) -1 , Germany (6,436), Poland (2,672) -1 , U.S.A. (1,716), Hungary (1,372) 32,573 5,359 0.2Central AsiaArmenia 3,920 -1 3.6 -1 1.2 -1 Russian Fed. (2,174) -1 , France (482), U.S.A. (403), Germany (291), Greece (175) -1 4,239 -1 319 -1 0.3 -1Azerbaijan 5,061 ** 3.6 ** 0.6 ** Turkey (2,014), Russian Fed. (1,607) -1 , U.S.A. (318), Germany (312), U.K. (178) 6,316 +1 ... ...Georgia 8,158 ** 6.3 ** 2.2 ** Germany (2,504), Russian Fed. (2,440) -1 , Armenia (1,096) -1 , France (409), U.S.A. (378) 621 -7,537 -5.8Kazakhstan 30,077 -1 3.9 -1 2.0 -1 Russian Fed. (19,627) -1 , Kyrgyzstan (4,653), U.S.A. (1,458), U.K. (1,178), Turkey (709) 10,458 +1 ... ...Kyrgyzstan 3,240 ** 1.1 ** 0.6 ** Russian Fed. (765) -1 , Turkey (596), Kazakhstan (526) +1 , Germany (425), U.S.A. (264) 25,603 22,363 7.5Mongolia 7,046 4.6 2.3 U.S.A. (1,309), Korea, Rep. (1,236), Japan (1,073), Germany (866), Turkey (839) 1,207 -5,839 -3.9Tajikistan 3,477 ** 2.2 ** 0.5 ** Russian Fed. (1,283) -1 , Kyrgyzstan (1,105), U.S.A. (364), Kazakhstan (253) +1 , Turkey (162) 3,001 -476 -0.3Turkmenistan 5,654 ... 1.0 Turkey (1,535), Ukraine (1,136), Russian Fed. (1,060) -1 , Kyrgyzstan (929), Kazakhstan (251) +1 ... ... ...Uzbekistan 29,228 9.8 1.0 Kyrgyzstan (15,424), Russian Fed. (5,566) -1 , Kazakhstan (3,427) +1 , Tajikistan (1,924), Germany (678) 312 -28,916 -9.7East Asia and the PacificAustralia 9,864 0.9 0.7 U.S.A. (3,091), New Zealand (2,809), U.K. (1,610), Japan (337), Germany (328) 230,635 220,771 19.8Brunei Darussalam 2,731 48.7 7.8 U.K. (1,501), Australia (820), Malaysia (236) -1 , New Zealand (67), U.S.A. (34) 190 -2,541 -45.3Cambodia 2,894 2.4 0.2 Thailand (984) +1 , France (512), Viet Nam (388), U.S.A. (369), Australia (311) 68 -2 -2,672 -2 -3.5 -2China 441,186 1.7 0.4 U.S.A. (110,246), Japan (77,916), Australia (57,596), U.K. (45,356), Korea, Rep. (30,552) 51,038 -390,148 -1.5Cook Islands 227 . ... Fiji (184), Papua New Guinea (19) -10 , Spain (9), Australia (6), U.S.A. (5) . -227 ...DPR of Korea 5,110 ** ... 0.3 ** Canada (1,779) -2 , New Zealand (1,458), Australia (988), India (168) -2 , France (160) ... ... ...Fiji 1,709 ... 2.2 Australia (782), New Zealand (566), U.S.A. (177), India (37) -2 , Japan (36) 7,444 5,735 ...Hong Kong SAR of China 33,107 20.7 -1 7.3 Australia (13,334), U.K. (9,701), U.S.A. (8,295), Canada (1,110) -2 , Macao (404) 7,362 -25,745 ...Indonesia 30,286 0.7 0.1 Australia (10,242), U.S.A. (7,700), Malaysia (5,704) -1 , Germany (1,603), Japan (1,578) 3,023 -27,263 -0.6Japan 50,380 1.3 0.7 U.S.A. (34,010), U.K. (4,465), Australia (2,974), France (1,908), Germany (1,858) 126,568 76,189 1.9Kiribati 987 ... ... Fiji (850), U.S.A. (36), New Zealand (26), Australia (23), Cuba (20) +1 . -987 ...Lao PDR 3,870 4.3 0.6 Viet Nam (2,435), Thailand (1,301) +1 , Japan (251), Australia (162), France (104) 332 -3,538 -4.0Macao, China 1,324 5.2 2.9 Australia (566), U.S.A. (421), U.K. (165), China, Hong Kong (85), Canada (51) -2 12,648 11,324 44.6Malaysia 47,395 5.7 -1 1.9 Australia (18,576), U.K. (11,727), U.S.A. (5,434), Japan (2,012), New Zealand (1,942) 30,581 -1 -15,371 -1 -1.9 -1Marshall Islands 232 ... 3.4 ** Fiji (132), U.S.A. (85), Papua New Guinea (6) -10 ... ... ...Micronesia (Federated States of) 171 ... 1.3 U.S.A. (140), Fiji (22) ... ... ...Myanmar 3,646 0.7 -1 0.1 Thailand (999) +1 , Japan (829), U.S.A. (605), Malaysia (463) -1 , Australia (356) 57 -1 -3,374 -1 -0.7 -1Nauru 123 ... 13.2 ** Fiji (102), Thailand (8) +1 . -1 ... ...New Zealand 4,188 1.7 1.3 Australia (2,085), U.S.A. (1,022), U.K. (508), Japan (88), Denmark (85) -1 31,565 27,377 11.2Niue 41 ... ... Fiji (31) . -41 ...Palau 51 ... 4.0 ** U.S.A. (44) ... ... ...Papua New Guinea 860 ... 0.1 Australia (644), New Zealand (83), U.S.A. (35), Fiji (30), Japan (25) ... ... ...Philippines 8,443 0.3 0.1 U.S.A. (4,174), Australia (1,019), U.K. (663), Japan (594), Korea, Rep. (266) 2,665 -5,778 -0.2Republic of Korea 112,588 3.5 3.4 U.S.A. (69,198), Japan (23,290), Australia (6,270), U.K. (4,031), Germany (3,929) 40,322 -72,266 -2.3Samoa 694 ... 3.8 Fiji (427), Australia (80), New Zealand (79), U.S.A. (72), Japan (14) ... ... ...Singapore 18,642 ... ... Australia (9,654), U.S.A. (3,980), U.K. (2,898), Malaysia (729) -1 , Canada (330) -2 ... ... ...177
T a b l e10 TERTIARY EDUCATION / ISCED 5 and 6 / International flows of mobile students / 2008RegionCountry or territoryStudents from a given countrystudying abroad(outbound mobile students)Top five destinations (host countries) for outbound mobile students(The number of students from given country studying in the host countries is shown in brackets)Numberof studentsfrom abroadstudying ingiven country(inbound mobilestudents)Net flowof mobile students(Inbound – outbound)MFOutboundmobilityratio(%)GrossoutboundenrolmentratioMFNet flowratio(%)1 2 3 4 5 6 7Solomon Islands 3,119 . 6.3 Fiji (2,747), Australia (115), Papua New Guinea (104) -10 , New Zealand (58), Cuba (50) +1 . -3,119 ...Thailand 24,272 1.0 0.4 U.S.A. (9,014), Australia (4,573), U.K. (4,181), Japan (1,975), Malaysia (1,023) -1 16,361 +1 ... ...Timor-Leste 2,363 ... 2.2 Indonesia (1,421), Cuba (697) +1 , Australia (80), Portugal (74) -1 , U.S.A. (37) ... ... ...Tokelau 65 ... ... Fiji (63) . -65 ...Tonga 1,251 ... 12.6 Fiji (750), U.S.A. (201), New Zealand (160), Australia (58), Japan (27) ... ... ...Tuvalu 411 ... ... Fiji (348), Australia (17), New Zealand (16), Cuba (10) +1 , U.S.A. (5) . -411 ...Vanuatu 1,733 ... 7.4 Fiji (1,539), Papua New Guinea (68) -10 , Australia (56), New Zealand (37), Cuba (17) +1 ... ... ...Viet Nam 32,727 ... ... U.S.A. (8,778), Australia (5,446), France (5,133), Japan (2,541), Germany (1,854) 3,362 -29,365 -1.8Latin America and the CaribbeanAnguilla 142 263.0 ** 13.1 ** U.S.A. (93), U.K. (30), Canada (9) -2 , Barbados (8) -1 - -142 -263.0Antigua and Barbuda 572 ... 8.3 Cuba (191) +1 , U.S.A. (174), U.K. (53), Canada (45) -2 , Jordan (45) ... ... ...Argentina 9,060 0.4 -1 0.3 U.S.A. (2,538), Spain (1,947), Cuba (864) +1 , France (768), Italy (560) -1 ... ... ...Aruba 82 3.7 1.2 U.S.A. (68), Canada (9) -2 51 -31 -1.4Bahamas 2,311 ... 8.0 U.S.A. (1,544), Canada (276) -2 , U.K. (232), Trinidad&Tobago (85) -4 , Jamaica (77) -8 ... ... ...Barbados 1,357 ** ... ... U.S.A. (403), U.K. (342), Trinidad&Tobago (200) -4 , Canada (186) -2 , Jamaica (115) -8 890 -1 -579 -1 -5.1 -1Belize 798 ... 2.6 U.S.A. (491), Cuba (190) +1 , Jamaica (33) -8 , Canada (27) -2 , U.K. (25) ... ... ...Bermuda 1,098 ** 124.8 **, -1 30.8 ** U.S.A. (421), Canada (324) -2 , U.K. (236), Romania (85), Australia (17) ... ... ...Bolivia 9,749 **, +1 2.5 -1 1.0 **, +1 Cuba (5,349) +1 , U.S.A. (965), Venezuela (796), Spain (637), Argentina (491) -8 ... ... ...Brazil 23,410 0.4 0.1 U.S.A. (7,586), France (2,941), Portugal (2,204) -1 , Germany (1,878), Spain (1,337) ... ... ...British Virgin Islands 299 1,495.0 ** 16.4 ** U.K. (133), U.S.A. (93), Philippines (25), Barbados (22) -1 , Canada (9) -2 ... ... ...Cayman Islands 335 36.7 13.3 U.S.A. (161), U.K. (141), Canada (21) -2 , Barbados (5) -1 346 11 1.2Chile 6,664 0.8 -1 0.5 U.S.A. (1,687), Spain (1,016), France (738), Argentina (656) -8 , Germany (597) 7,946 -1 2,200 -1 0.3 -1Colombia 18,082 1.2 0.4 U.S.A. (6,669), Spain (3,014), France (2,281), Germany (1,074), Australia (740) ... ... ...Costa Rica 1,849 ... 0.4 U.S.A. (928), Cuba (224) +1 , Spain (116), Germany (112), France (96) 1,480 -369 ...Cuba 1,378 0.1 0.2 Spain (583), Italy (126) -1 , Germany (110), France (96), U.S.A. (82) 30,961 +1 ... ...Dominica 602 262.9 10.0 U.S.A. (228), Cuba (96) +1 , Venezuela (66), U.K. (51), France (40) ... ... ...Dominican Republic 2,317 ... 0.2 U.S.A. (1,160), Spain (360), Cuba (358) +1 , Canada (99) -2 , France (71) ... ... ...Ecuador 8,434 1.6 0.7 U.S.A. (2,154), Spain (1,882), Cuba (1,825) +1 , Chile (459) -1 , Italy (421) -1 ... ... ...El Salvador 2,647 1.9 0.5 U.S.A. (941), Cuba (800) +1 , France (151), Spain (125), Honduras (100) -5 870 -1,777 -1.3Grenada 497 ** ... 3.9 ** U.S.A. (238), Cuba (96) +1 , U.K. (42), Trinidad&Tobago (40) -4 , Barbados (39) -1 4,240 +1 ... ...Guatemala 2,735 1.1 -1 0.2 U.S.A. (1,020), Cuba (603) +1 , El Salvador (274), Spain (119), Honduras (102) -5 ... ... ...Guyana 1,413 **, +1 18.1 2.2 **, +1 Cuba (797) +1 , U.S.A. (300), U.K. (99), Canada (57) -2 , France (45) 34 -1 -1,340 -1 -17.8 -1Haiti 3,969 ... 0.4 France (1,289), U.S.A. (873), Canada (867) -2 , Cuba (624) +1 , Venezuela (62) ... ... ...Honduras 2,508 1.7 0.3 U.S.A. (1,069), Cuba (862) +1 , Spain (126), El Salvador (86), Germany (46) ... ... ...Jamaica 5,913 9.7 2.3 U.S.A. (3,875), U.K. (631), Cuba (274) +1 , Canada (237) -2 , Jordan (235) ... ... ...Mexico 25,444 1.0 0.3 U.S.A. (14,853), Spain (2,103), France (1,751), U.K. (1,303), Germany (1,299) ... ... ...Montserrat 47 ** 92.2 ** 15.8 ** U.S.A. (16), U.K. (14), Barbados (13) -1 . -1 -57 -1 ...Netherlands Antilles 337 ... 2.9 U.S.A. (233), Jordan (38), U.K. (17), Canada (15) -2 , Aruba (13) ... ... ...Nicaragua 2,328 ... 0.4 Cuba (892) +1 , Costa Rica (402), U.S.A. (389), Venezuela (173), Honduras (117) -5 ... ... ...Panama 2,263 1.5 -1 0.8 U.S.A. (1,131), Cuba (541) +1 , Spain (122), Chile (93) -1 , Venezuela (55) ... ... ...178
G l o b a l e d u c a t i o n d i g e s t 2 0 1 0 C o m p a r i n g e d u c a t i o n s t a t i s t i c s a r o u n d t h e w o r l dRegionCountry or territoryStudents from a given countrystudying abroad(outbound mobile students)Top five destinations (host countries) for outbound mobile students(The number of students from given country studying in the host countries is shown in brackets)Numberof studentsfrom abroadstudying ingiven country(inbound mobilestudents)Net flowof mobile students(Inbound – outbound)MFOutboundmobilityratio(%)GrossoutboundenrolmentratioMFNet flowratio(%)1 2 3 4 5 6 7Paraguay 2,243 1.2 -1 0.4 Cuba (746) +1 , Argentina (392) -8 , U.S.A. (377), Spain (163), France (90) ... ... ...Peru 14,719 ** 1.2 **, -2 0.5 ** U.S.A. (3,676), Spain (2,861), Chile (1,523) -1 , Cuba (1,422) +1 , Italy (1,243) -1 ... ... ...Saint Kitts and Nevis 465 ** ... ... U.S.A. (239), Cuba (53) +1 , Barbados (47) -1 , U.K. (36), Jamaica (30) -8 - -465 -54.1Saint Lucia 1,133 ** 44.0 ** 6.5 ** U.S.A. (319), Cuba (281) +1 , U.K. (148), Trinidad&Tobago (136) -4 , Canada (69) -2 234 -899 -34.9St. Vincent and the Grenadines 722 ** ... 6.9 ** Barbados (154) -1 , Cuba (132) +1 , U.S.A. (126), U.K. (79), Trinidad&Tobago (72) -4 ... ... ...Suriname 559 ... 1.2 Netherlands (315), U.S.A. (88), France (75), Serbia (10), Aruba (7) ... ... ...Trinidad and Tobago 4,837 ... 3.6 U.S.A. (2,643), U.K. (834), Canada (573) -2 , Grenada (229) +1 , Barbados (197) -1 ... ... ...Turks and Caicos Islands 253 . 9.6 ** U.S.A. (169), U.K. (54), Canada (9) -2 , Jamaica (8) -8 , Cayman Islands (7) - -253 …Uruguay 2,207 ** 1.6 **, -1 0.9 ** Argentina (500) -8 , U.S.A. (458), Cuba (367) +1 , Spain (308), France (140) ... ... ...Venezuela 12,428 0.6 0.5 U.S.A. (4,451), Cuba (3,520) +1 , Spain (1,517), France (492), Portugal (452) -1 1,913 -10,515 -0.5North America and Western EuropeAndorra 1,206 262.7 28.9 Spain (1,028), France (143), U.K. (10), U.S.A. (9), Brazil (9) -4 ... ... ...Austria 10,241 3.6 2.0 Germany (4,911), U.K. (1,416), U.S.A. (887), Switzerland (712), France (492) 53,396 43,155 15.2Belgium 10,068 2.5 1.6 France (2,763), U.K. (2,475), Netherlands (974), Germany (886), U.S.A. (813) 29,844 19,776 4.9Canada 44,883 ... 2.0 U.S.A. (29,082), U.K. (5,003), Australia (4,321), France (1,378), Ireland (575) 68,520 -2 24,638 -2 ...Cyprus 23,784 ** 92.6 ** 39.5 ** Greece (11,449) -1 , U.K. (9,795), U.S.A. (783), Bulgaria (391), Hungary (307) 7,176 -16,608 -64.7Denmark 4,924 2.2 -1 1.7 U.K. (1,516), U.S.A. (899), Norway (838), Germany (379), France (200) 12,695 -1 7,660 -1 3.3 -1Finland 6,502 2.1 2.0 U.K. (1,666), Sweden (1,124), U.S.A. (673), Germany (604), Estonia (586) 11,303 4,801 1.6France 45,191 2.1 1.1 U.K. (12,685), U.S.A. (7,058), Germany (5,102), Switzerland (4,895), Canada (4,698) -2 243,436 198,245 9.2Germany 83,524 ... 1.7 Austria (17,464), U.K. (13,625), Netherlands (12,313), U.S.A. (8,917), Switzerland (8,341) 189,347 105,823 ...Gibraltar 637 ... ... U.K. (618), U.S.A. (15) . -637 ...Greece 29,616 5.4 -1 4.6 U.K. (12,626), Italy (5,054) -1 , Germany (2,479), U.S.A. (1,983), France (1,926) 21,160 -1 -11,501 -1 -1.9 -1Holy See 16 ... ... Spain (7) ... ... ...Iceland 2,508 ** 15.1 ** 11.3 ** Denmark (963) -1 , U.S.A. (402), U.K. (340), Norway (267), Sweden (138) 720 -1,788 -10.8Ireland 18,064 10.1 5.9 U.K. (15,261), U.S.A. (1,019), France (392), Germany (290), Australia (193) 12,794 -5,270 -3.0Israel 12,789 3.9 2.3 Jordan (3,086), U.S.A. (3,007), Germany (1,295), Italy (1,121) -1 , Hungary (791) ... ... ...Italy 35,500 1.7 -1 1.2 Austria (6,733), U.K. (5,607), France (5,009), Holy See (4,103) -9 , Germany (4,086) 57,271 -1 22,142 -1 1.1 -1Liechtenstein 876 109.5 40.3 Switzerland (644), Austria (163), Germany (19), U.K. (14), U.S.A. (13) 653 -223 -27.9Luxembourg 6,348 261.6 -2 22.5 Germany (2,505), France (1,551), U.K. (834), Austria (537), Switzerland (300) 1,137 -2 -5,906 -2 -219.4 -2Malta 1,009 10.5 -1 3.4 U.K. (820), Italy (44) -1 , Germany (25), U.S.A. (24), Spain (19) ... ... ...Monaco 411 ... ... France (306), U.K. (47), U.S.A. (28), Italy (9) -1 , Switzerland (9) ... ... ...Netherlands 8,285 1.4 0.8 U.K. (3,024), U.S.A. (1,682), Germany (807), France (652), Australia (249) 30,052 21,767 3.6Norway 11,747 ** 5.5 ** 4.0 ** U.K. (2,797), Denmark (1,935) -1 , Australia (1,426), U.S.A. (1,265), Poland (911) -1 16,104 4,357 2.0Portugal 10,785 3.0 -1 1.7 U.K. (2,828), France (2,612), Spain (2,157), U.S.A. (903), Germany (606) 17,950 -1 6,789 -1 1.9 -1San Marino 897 -1 ... ... Italy (741) -1 , Malta (47) -3 , U.K. (13), Germany (6) ... ... ...Spain 21,607 1.2 0.9 U.K. (5,739), France (3,905), Germany (3,676), U.S.A. (3,664), Portugal (648) -1 37,726 16,119 0.9Sweden 13,782 3.4 2.4 U.S.A. (3,296), U.K. (3,194), Norway (1,290), Denmark (1,127) -1 , Australia (853) 22,653 8,871 2.2Switzerland 10,601 4.7 2.3 U.K. (1,892), Germany (1,883), France (1,613), Italy (1,371) -1 , U.S.A. (1,297) 31,706 21,105 9.4U.K. 21,992 0.9 0.5 U.S.A. (8,376), France (2,519), Australia (1,696), Denmark (1,485) -1 , Ireland (1,421) 341,791 319,799 13.7United States of America 50,728 ** 0.3 ** 0.2 ** U.K. (13,895), Canada (7,935) -2 , France (3,228), Australia (3,055), Germany (2,928) 624,474 573,746 3.1179
T a b l e10 TERTIARY EDUCATION / ISCED 5 and 6 / International flows of mobile students / 2008RegionCountry or territoryStudents from a given countrystudying abroad(outbound mobile students)Top five destinations (host countries) for outbound mobile students(The number of students from given country studying in the host countries is shown in brackets)Numberof studentsfrom abroadstudying ingiven country(inbound mobilestudents)Net flowof mobile students(Inbound – outbound)MFOutboundmobilityratio(%)GrossoutboundenrolmentratioMFNet flowratio(%)1 2 3 4 5 6 7South and West AsiaAfghanistan 3,034 ... 0.1 Iran, Isl.Rep. (577), Turkey (509), U.S.A. (338), Germany (146), U.K. (136) ... ... ...Bangladesh 15,301 1.3 -1 0.1 U.K. (2,817), Australia (2,355), U.S.A. (2,307), Cyprus (1,520), Japan (1,515) 669 -1 -14,163 -1 -1.2 -1Bhutan 955 ** 18.9 ** 1.2 ** India (365) -2 , Thailand (214) +1 , Australia (195), U.S.A. (96), Canada (66) -2 - -1 ... ...India 170,256 1.0 -1 0.2 U.S.A. (94,664), Australia (26,520), U.K. (25,901), New Zealand (4,094), Germany (3,257) 12,374 -2 -126,779 -2 -1.0 -2Iran (Islamic Republic of) 26,927 ** 0.8 ** 0.3 ** U.S.A. (3,063), Malaysia (2,442) -1 , U.K. (2,400), Germany (2,231), Ukraine (1,780) 1,233 -25,694 -0.8Maldives 1,256 -1 - **, -2 3.3 -1 Malaysia (632) -1 , Australia (250), U.K. (146), New Zealand (59), India (42) -2 ... ... ...Nepal 17,689 ... ... U.S.A. (8,946), Australia (3,314), Japan (1,311), India (1,252) -2 , U.K. (646) ... ... ...Pakistan 26,608 2.7 0.1 U.K. (9,303), U.S.A. (5,351), Australia (2,482), Sweden (1,303), Germany (1,133) ... ... ...Sri Lanka 13,854 ... 0.8 Australia (4,073), U.K. (3,141), U.S.A. (2,594), Japan (1,197), India (431) -2 ... ... ...Sub-Saharan AfricaAngola 7,344 -1 13.5 -2 0.4 -1 Portugal (4,794) -1 , South Africa (1,101), U.S.A. (504), U.K. (286), France (204) ... ... ...Benin 3,521 8.8 -2 0.5 France (2,258), U.S.A. (319), Canada (225) -2 , Morocco (200), Germany (117) ... ... ...Botswana 7,315 49.8 -2 3.4 South Africa (5,194), U.K. (591), Australia (511), U.S.A. (236), Namibia (198) ... ... ...Burkina Faso 2,487 6.0 0.2 France (1,127), U.S.A. (515), Morocco (229), Canada (177) -2 , Germany (84) ... ... ...Burundi 1,063 ** 4.9 ** 0.1 ** France (300), Canada (159) -2 , U.S.A. (87), Morocco (78), Norway (76) ... ... ...Cameroon 17,488 11.8 0.9 France (5,655), Germany (5,002), U.S.A. (1,893), Italy (1,614) -1 , U.K. (530) 1,417 -1 -15,545 -1 -11.8 -1Cape Verde 4,848 -1 91.7 -1 8.8 -1 Portugal (4,342) -1 , France (187), Spain (65), Cuba (47) +1 , U.S.A. (43) ... ... ...Central African Republic 860 9.1 0.2 France (588), Morocco (103), U.S.A. (47), Cameroon (31) -1 , Gabon (11) -9 485 -2 -378 -2 -8.5 -2Chad 2,692 -1 ... 0.3 -1 Cameroon (1,229) -1 , France (465), Cent. Afr. Rep. (397) -2 , Morocco (206), U.S.A. (127) 40 ... ...Comoros 2,649 ... 3.9 France (1,319), Madagascar (923), Morocco (237), U.S.A. (42), Malaysia (33) -1 ... ... ...Congo 4,322 ... 1.2 France (2,704), Morocco (270), Italy (222) -1 , Canada (171) -2 , U.S.A. (150) ... ... ...Côte d’Ivoire 5,639 3.7 -1 0.3 France (3,526), U.S.A. (712), Morocco (352), Canada (315) -2 , Germany (220) ... ... ...Democratic Rep. of the Congo 3,924 1.3 0.1 South Africa (1,579), France (741), U.S.A. (282), Burundi (276) -6 , Canada (150) -2 914 -3,010 -1.0Equatorial Guinea 920 ... 1.6 Spain (574), U.S.A. (98), Cuba (92) +1 , Morocco (56), France (35) ... ... ...Eritrea 814 ** ... 0.2 ** U.S.A. (163), Jordan (98), Italy (97) -1 , U.K. (87), Malaysia (48) -1 ... ... ...Ethiopia 3,872 1.5 0.1 U.S.A. (1,317), Norway (293), India (290) -2 , Germany (287), France (258) ... ... ...Gabon 4,798 ... 3.4 France (3,585), U.S.A. (303), Canada (237) -2 , Germany (177), South Africa (161) ... ... ...Gambia 968 ... 0.7 U.K. (332), U.S.A. (330), Venezuela (55), Cuba (34) +1 , France (25) ... ... ...Ghana 7,201 5.4 -1 0.3 U.S.A. (2,898), U.K. (2,237), Finland (285), Germany (275), Canada (216) -2 1,899 -1 -5,609 -1 -4.0 -1Guinea 4,376 5.5 0.5 France (2,751), Morocco (477), U.S.A. (167), Portugal (159) -1 , Canada (144) -2 748 -3,628 -4.5Guinea-Bissau 653 -1 15.3 -2 0.5 -1 Portugal (426) -1 , France (55), Morocco (55), Cuba (42) +1 , Spain (29) ... ... ...Kenya 12,562 ... 0.3 U.S.A. (5,844), U.K. (2,428), Australia (1,417), India (508) -2 , Finland (340) ... ... ...Lesotho 4,300 45.0 -2 1.8 South Africa (4,098), U.S.A. (45), U.K. (33), Cuba (24) +1 , Morocco (17) 53 -2 -3,770 -2 -44.4 -2Liberia 621 ... 0.2 U.S.A. (298), Morocco (111), Norway (43), Ghana (43) -1 , France (19) ... ... ...Madagascar 4,076 6.6 0.2 France (3,456), U.S.A. (130), Canada (87) -2 , Morocco (71), Switzerland (59) 1,066 -3,010 -4.8Malawi 1,945 29.1 -1 0.1 South Africa (802), U.K. (533), U.S.A. (297), Australia (83), Namibia (54) ... ... ...Mali 3,094 4.6 0.2 France (1,766), U.S.A. (435), Morocco (378), Niger (220) +1 , Canada (132) -2 ... ... ...Mauritius 7,401 28.9 ** 7.5 France (1,826), U.K. (1,702), Australia (1,273), South Africa (1,165), India (497) -2 56 -2 -7,551 -2 -34.6 -2Mozambique 2,441 ** ... 0.1 ** Portugal (1,006) -1 , South Africa (892), U.S.A. (78), Cuba (61) +1 , U.K. (56) ... ... ...180
G l o b a l e d u c a t i o n d i g e s t 2 0 1 0 C o m p a r i n g e d u c a t i o n s t a t i s t i c s a r o u n d t h e w o r l dRegionCountry or territoryStudents from a given countrystudying abroad(outbound mobile students)Top five destinations (host countries) for outbound mobile students(The number of students from given country studying in the host countries is shown in brackets)Numberof studentsfrom abroadstudying ingiven country(inbound mobilestudents)Net flowof mobile students(Inbound – outbound)MFOutboundmobilityratio(%)GrossoutboundenrolmentratioMFNet flowratio(%)1 2 3 4 5 6 7Namibia 8,252 41.9 3.7 South Africa (7,813), Cuba (130) +1 , U.K. (91), U.S.A. (66), Germany (26) 2,004 -6,248 -31.7Niger 2,094 ** 16.3 ** 0.2 ** France (777), Morocco (316), U.S.A. (289), Greece (180) -1 , Canada (78) -2 1,026 +1 ... ...Nigeria 24,953 ... 0.2 U.K. (11,783), U.S.A. (6,229), Ghana (1,349) -1 , South Africa (649), Malaysia (497) -1 ... ... ...Rwanda 2,013 ** 4.5 ** 0.2 ** France (561), U.S.A. (270), Burundi (217) -6 , Canada (210) -2 , South Africa (133) ... ... ...Sao Tome and Principe 792 -1 . 4.6 -1 Portugal (644) -1 , Cuba (270) +1 , France (42), Morocco (29), Macao (5) . ... ...Senegal 11,684 12.8 1.0 France (9,298), U.S.A. (659), Morocco (489), Canada (420) -2 , Germany (188) ... ... ...Seychelles 462 . +1 6.2 Australia (139), U.K. (129), France (45), South Africa (42), Mauritius (23) +2 . +1 ... ...Sierra Leone 714 ... 0.1 U.K. (243), U.S.A. (230), Gambia (43) -8 , Germany (31), Greece (18) -1 ... ... ...Somalia 1,408 **, -1 ... 0.2 **, -1 Malaysia (424) -1 , U.K. (110), Jordan (92), Norway (90), Pakistan (80) -5 ... ... ...South Africa 5,500 0.7 0.1 U.S.A. (1,622), U.K. (1,539), Australia (763), Cuba (387) +1 , Portugal (168) -1 63,964 58,464 ...Swaziland 3,518 51.7 -2 2.5 South Africa (3,278), U.S.A. (128), U.K. (52), Cuba (16) +1 , Namibia (12) 122 -2 -2,818 -2 -49.5 -2Togo 3,025 9.5 -1 0.5 France (1,584), U.S.A. (439), Germany (335), Morocco (155), Canada (123) -2 459 -1 -2,616 -1 -8.0 -1Uganda 2,707 2.5 0.1 U.K. (921), U.S.A. (770), Norway (111), Germany (107), Australia (99) ... ... ...United Rep. of Tanzania 4,149 7.8 -1 0.1 U.S.A. (1,193), U.K. (989), South Africa (598), India (171) -2 , Australia (155) ... ... ...Zambia 4,250 ... 0.4 South Africa (1,523), U.S.A. (788), U.K. (629), Australia (551), Namibia (419) ... ... ...Zimbabwe 23,512 ... 1.5 South Africa (17,766), U.K. (2,027), Australia (1,464), U.S.A. (1,423), Namibia (297) ... ... ...REGIONAL AVERAGESWORLD 2,965,840 ** 1.9 ** …Arab States 206,549 ** 2.8 ** …Central and Eastern Europe 330,563 ** 1.6 ** …Central Asia 96,314 ** 4.6 ** …East Asia and the Pacific 846,618 ** 1.7 ** …Latin Americaand the Caribbean 177,995 ** 0.9 ** …North Americaand Western Europe 486,981 ** 1.4 ** …South and West Asia 275,840 ** 1.3 ** …Sub-Saharan Africa 223,181 ** 4.9 ** …North America and Western Europe (62.1%) East Asia and the Pacific (18.9%), Central andEastern Europe (7.7%), Arab States (4.5%), Sub-Saharan Africa (2.7%), Latin America and theCaribbean (1.9%), Central Asia(1.7%), South and West Asia (0.5%) . . .North America and Western Europe (68.6%), Arab States (17.7%), East Asia and the Pacific(5.6%), Central and Eastern Europe (5.6%), South and West Asia (1.9%), Central Asia(0.5%),Latin America and the Caribbean (0.1%), Sub-Saharan Africa (0.1%) 132,752 -73,797 ** -1.0 **North America and Western Europe (63.1%), Central and Eastern Europe (32.3%), CentralAsia(3.1%), East Asia and the Pacific (1.2%), Arab States (0.2%), South and West Asia (0.03%),Latin America and the Caribbean (0.03%), Sub-Saharan Africa (0.02%) 228,753 -101,810 ** -0.5 **Central and Eastern Europe (46.0%), Central Asia(32.4%), North America and Western Europe(17.3%), East Asia and the Pacific (3.7%), Arab States (0.3%), South and West Asia (0.2%), LatinAmerica and the Caribbean (0.04%), Sub-Saharan Africa (-) 51,375 -44,939 ** -2.1 **North America and Western Europe (54.9%) East Asia and the Pacific (42.7%), Central andEastern Europe (1.3%), Central Asia(0.4%), Latin America and the Caribbean (0.3%),Arab States (0.2%), South and West Asia (0.2%), Sub-Saharan Africa (0.01%) 559,236 -287,382 ** -0.6 **North America and Western Europe (73.7%), Latin America and the Caribbean (23.0%),East Asia and the Pacific (2.6%), Central and Eastern Europe (0.3%), Arab States (0.3%),South and West Asia (0.02%), Central Asia(-), Sub-Saharan Africa (-) 57,709 -120,286 ** -0.6 **North America and Western Europe (87.7%), East Asia and the Pacific (6.2%), Central andEastern Europe (4.0%), Latin America and the Caribbean (1.1%), Arab States (0.8%), South andWest Asia (0.2%), Central Asia(0.03%), Sub-Saharan Africa (0.01%) 1,841,933 1,354,952 ** 3.9 **North America and Western Europe (70.7%), East Asia and the Pacific (21.7%), Central andEastern Europe (3.0%), Central Asia (1.9%), South and West Asia (1.6%), Arab States (0.9%),Latin America and the Caribbean (0.2%), Sub-Saharan Africa (0.01%) 14,665 -261,175 ** -1.3 **North America and Western Europe (65.1%), Sub-Saharan Africa (24.5%), East Asia and thePacific (4.6%), Arab States (3.2%), Central and Eastern Europe (1.0%), South and West Asia(0.9%), Latin America and the Caribbean (0.8%), Central Asia(0.02%) 79,417 -143,765 ** -3.2 **World (not specified) 321,799 ** . . . . . .Note: “World (not specified)” denotes host countries that reported numbers of mobile students hosted without specifying their country of origin.Please refer to the Reader’s Guide for more information on the data and symbols used in each table.181
T a b l e11 TERTIARY EDUCATION / ISCED 5 and 6 / Graduates by broad fields of education / 2008RegionTotal numberof graduatesTotalGraduates by field of education as a % of totalScience and technology fieldsOther fieldsCountry or territory MF (000) % F MF % F MF % F MF % F MF % F MF % F1 2 3 4 5 6 7 8 9 10 11 12Arab StatesScienceEngineering, manufacturingand construction Total EducationAlgeria 120 -1 59 -1 25 -1 47 -1 12 -1 61 -1 13 -1 33 -1 74 -1 64 -1 1 -1 68 -1Bahrain 2.9 -2 68 -2 18 -2 46 -2 8 -2 73 -2 10 -2 26 -2 70 -2 72 -2 5 -2 48 -2Djibouti ... ... ... ... ... ... ... ... ... ... ... ...Egypt (w) 416 52 ... ... ... ... ... ... ... ... ... ...Iraq ... ... ... ... ... ... ... ... ... ... ... ...Jordan (w) 50 -1 55 -1 25 -1 40 -1 14 -1 52 -1 11 -1 25 -1 73 -1 60 -1 18 -1 84 -1Kuwait ... ... ... ... ... ... ... ... ... ... ... ...Lebanon 35 +1 57 +1 25 +1 44 +1 14 +1 58 +1 11 +1 25 +1 75 +1 62 +1 5 +1 92 +1Libyan Arab Jamahiriya ... ... ... ... ... ... ... ... ... ... ... ...Mauritania 2.7 -2 26 -2 ... ... ... ... ... ... ... ... ... ...Morocco 63 32 34 17 23 18 11 15 66 40 5 38Oman 11 +1 60 +1 27 +1 48 +1 16 +1 64 +1 11 +1 25 +1 68 +1 66 +1 30 +1 65 +1Palestinian Autonomous Territories 25 58 17 43 10 51 7 31 83 61 31 75Qatar 1.8 67 23 54 10 75 13 37 77 71 8 86Saudi Arabia 87 61 ... ... ... ... ... ... ... ... ... ...Sudan ... ... ... ... ... ... ... ... ... ... ... ...Syrian Arab Republic ... ... ... ... ... ... ... ... ... ... ... ...Tunisia (w) 59 -1 ... ... ... ... ... ... ... ... ... ... ...United Arab Emirates 13 -1 65 -1 33 -1 50 -1 23 -1 63 -1 9 -1 19 -1 67 -1 73 -1 12 -1 92 -1Yemen 27 -1 33 -1 ... ... ... ... ... ... ... ... ... ...Central and Eastern EuropeAlbania (u) ... ... ... ... ... ... ... ... ... ... ... ...Belarus 113 ... 26 ... 2 ... 24 ... 74 ... 13 ...Bosnia and Herzegovina (u) 16 59 ... ... ... ... ... ... ... ... ... ...Bulgaria (u) 55 61 18 37 4 55 14 32 82 67 6 74Croatia (u) 22 -1 58 -1 19 -1 35 -1 7 -1 47 -1 12 -1 28 -1 81 -1 63 -1 7 -1 94 -1Czech Republic (u) 89 58 25 30 9 38 16 25 70 69 15 77Estonia (u) 11 69 21 42 10 49 10 36 79 76 8 94Hungary (u) 63 67 13 26 6 28 8 24 87 73 17 80Latvia (u) 24 72 13 32 5 37 8 29 87 77 10 88Lithuania (u) 43 67 21 33 5 39 16 31 79 76 14 82Montenegro ... ... ... ... ... ... ... ... ... ... ... ...Poland (u) 533 -1 65 -1 17 -1 39 -1 8 -1 45 -1 9 -1 33 -1 83 -1 70 -1 16 -1 77 -1Republic of Moldova 27 58 ... ... ... ... ... ... ... ... ... ...Romania (u) 311 64 17 43 6 60 10 32 83 68 3 92Russian Federation (w) 1,985 -1 ... 27 -1 ... 6 -1 ... 22 -1 ... 71 -1 ... 10 -1 ...Serbia 36 60 22 42 8 49 14 39 78 65 10 90Slovakia (u) 65 64 21 37 7 43 13 33 79 71 17 81Slovenia (u) 17 63 18 27 4 39 14 23 82 71 8 86The former Yugoslav Rep. of Macedonia (u) 11 60 18 43 8 48 9 38 82 63 14 76Turkey (u) 445 46 22 31 8 44 14 23 78 50 15 57Ukraine 610 ... 24 ... 4 ... 20 ... 74 ... 9 ...Central AsiaArmenia 16 -1 57 -1 7 -1 31 -1 1 -1 35 -1 7 -1 31 -1 67 -1 63 -1 16 -1 94 -1Azerbaijan 50 +1 54 +1 16 +1 40 +1 10 +1 53 +1 6 +1 20 +1 84 +1 56 +1 19 +1 90 +1182
G l o b a l e d u c a t i o n d i g e s t 2 0 1 0 C o m p a r i n g e d u c a t i o n s t a t i s t i c s a r o u n d t h e w o r l dGraduates by field of education as a % of totalRegionHumanities and artsSocial science,business and lawOther fieldsAgriculture Health and welfare ServicesNot known orunspecifiedMF % F MF % F MF % F MF % F MF % F MF % F13 14 15 16 17 18 19 20 21 22 23 2418 -1 75 -1 47 -1 62 -1 2 -1 48 -1 5 -1 58 -1 1 -1 37 -1 1 -1 9 -1 AlgeriaCountry or territoryArab States9 -2 85 -2 41 -2 71 -2 . -2 . -2 9 -2 83 -2 5 -2 68 -2 12 -2 75 -2 Bahrain... ... ... ... ... ... ... ... ... ... ... ... Djibouti... ... ... ... ... ... ... ... ... ... ... ... Egypt (w)... ... ... ... ... ... ... ... ... ... ... ... Iraq15 -1 67 -1 25 -1 42 -1 1 -1 54 -1 13 -1 52 -1 - -1 100 -1 2 -1 64 -1 Jordan (w)... ... ... ... ... ... ... ... ... ... ... ... Kuwait11 +1 73 +1 44 +1 53 +1 - +1 50 +1 13 +1 70 +1 1 +1 55 +1 - +1 50 +1 Lebanon... ... ... ... ... ... ... ... ... ... ... ... Libyan Arab Jamahiriya... ... ... ... ... ... ... ... ... ... ... ... Mauritania14 49 36 36 1 14 7 52 3 15 - 35 Morocco5 +1 88 +1 23 +1 59 +1 1 +1 51 +1 9 +1 78 +1 - +1 - +1 6 +1 43 +1 Oman11 70 32 46 - 18 8 57 1 32 - - Palestinian Autonomous Territories15 90 40 69 - - 7 77 7 9 - - Qatar... ... ... ... ... ... ... ... ... ... ... ... Saudi Arabia... ... ... ... ... ... ... ... ... ... ... ... Sudan... ... ... ... ... ... ... ... ... ... ... ... Syrian Arab Republic... ... ... ... ... ... ... ... ... ... ... ... Tunisia (w)13 -1 85 -1 35 -1 61 -1 - -1 83 -1 5 -1 80 -1 1 -1 55 -1 - -1 - -1 United Arab Emirates... ... ... ... ... ... ... ... ... ... ... ... Yemen... ... ... ... ... ... ... ... ... ... ... ... Albania (u)5 ... 41 ... 7 ... 4 ... 4 ... - ... BelarusCentral and Eastern Europe... ... ... ... ... ... ... ... ... ... ... ... Bosnia and Herzegovina (u)6 70 53 67 2 46 7 74 9 54 - - Bulgaria (u)8 -1 72 -1 38 -1 67 -1 3 -1 48 -1 9 -1 75 -1 16 -1 29 -1 - -1 - -1 Croatia (u)7 67 31 66 4 59 9 83 5 46 4 45 Czech Republic (u)11 79 38 73 2 56 10 93 10 57 - - Estonia (u)8 72 40 72 2 49 10 81 8 62 - - Hungary (u)7 82 55 75 1 61 8 92 6 58 - 88 Latvia (u)7 75 43 74 2 53 10 87 4 50 - - Lithuania (u)... ... ... ... ... ... ... ... ... ... ... ... Montenegro9 -1 77 -1 43 -1 69 -1 2 -1 58 -1 8 -1 71 -1 5 -1 55 -1 - -1 - -1 Poland (u)... ... ... ... ... ... ... ... ... ... ... ... Republic of Moldova10 71 58 67 1 37 7 71 3 46 - - Romania (u)3 -1 ... 46 -1 ... 4 -1 ... 6 -1 ... 2 -1 ... 2 -1 ... Russian Federation (w)9 75 39 61 2 44 10 75 8 40 - - Serbia6 63 31 67 2 45 17 85 5 45 - - Slovakia (u)6 69 50 71 2 62 8 83 8 44 - - Slovenia (u)13 67 34 62 2 43 11 69 9 40 - - The former Yugoslav Rep. of Macedonia (u)6 54 41 47 5 57 6 66 5 27 - - Turkey (u)5 ... 45 ... 4 ... 7 ... 5 ... 2 ... UkraineCentral Asia4 -1 57 -1 30 -1 51 -1 3 -1 38 -1 12 -1 71 -1 3 -1 27 -1 26 -1 49 -1 Armenia20 +1 75 +1 30 +1 29 +1 - +1 26 +1 8 +1 76 +1 8 +1 15 +1 - +1 100 +1 Azerbaijan183
T a b l e11 TERTIARY EDUCATION / ISCED 5 and 6 / Graduates by broad fields of education / 2008RegionTotal numberof graduatesTotalGraduates by field of education as a % of totalScience and technology fieldsOther fieldsCountry or territory MF (000) % F MF % F MF % F MF % F MF % F MF % F1 2 3 4 5 6 7 8 9 10 11 12ScienceEngineering, manufacturingand construction Total EducationGeorgia 55 57 ... ... ... ... ... ... ... ... ... ...Kazakhstan ... ... ... ... ... ... ... ... ... ... ... ...Kyrgyzstan 36 61 14 42 5 56 9 34 85 64 20 86Mongolia 30 66 16 48 6 51 11 46 84 69 13 81Tajikistan 20 ... 25 ... 16 ... 8 ... 75 ... 6 ...Turkmenistan ... ... ... ... ... ... ... ... ... ... ... ...Uzbekistan 74 39 21 24 6 55 15 12 79 43 35 55East Asia and the PacificAustralia (u) 296 56 18 31 11 36 8 24 81 62 9 74Brunei Darussalam 1.5 67 15 49 6 64 9 39 81 69 56 71Cambodia 17 27 12 10 9 11 3 5 88 30 2 24China (w) 7,071 48 ... ... ... ... ... ... ... ... ... ...Cook Islands . . . . . . . . . . . .Democratic People’s Republic of Korea ... ... ... ... ... ... ... ... ... ... ... ...Fiji ... ... ... ... ... ... ... ... ... ... ... ...Hong Kong SAR of China 39 50 33 * 25 * 14 * 29 * 19 * 23 * 60 * 64 * 9 * 68 *Indonesia (w) 425 ... … ... … ... … ... ... ... … ...Japan (u) 1,034 48 21 14 3 26 18 12 73 57 7 75Kiribati . . . . . . . . . . . .Lao People’s Democratic Republic 7.4 -2 38 -2 13 -2 15 -2 1 -2 46 -2 12 -2 11 -2 74 -2 40 -2 20 -2 48 -2Macao, China 6.8 49 4 11 3 11 1 11 96 50 5 65Malaysia (w) 181 -1 57 -1 45 -1 42 -1 17 -1 60 -1 28 -1 31 -1 54 -1 69 -1 10 -1 71 -1Marshall Islands ... ... ... ... ... ... ... ... ... ... ... ...Micronesia (Federated States of) ... ... ... ... ... ... ... ... ... ... ... ...Myanmar 105 -1 70 -1 38 -1 ... -1 38 -1 70 -1 - -1 ... 62 -1 ... -1 4 -1 84 -1Nauru ... ... ... ... ... ... ... ... ... ... ... ...New Zealand (u) 54 61 19 38 13 42 6 29 81 66 13 83Niue . . . . . . . . . . . .Palau ... ... ... ... ... ... ... ... ... ... ... ...Papua New Guinea ... ... ... ... ... ... ... ... ... ... ... ...Philippines (w) 410 -2 61 -2 ... ... ... ... ... ... ... ... ... ...Republic of Korea (u) 605 49 32 26 8 36 25 23 68 60 8 77Samoa ... ... ... ... ... ... ... ... ... ... ... ...Singapore ... ... ... ... ... ... ... ... ... ... ... ...Solomon Islands . . . . . . . . . . . .Thailand (w) 542 55 ... ... ... ... ... ... ... ... ... ...Timor-Leste ... ... ... ... ... ... ... ... ... ... ... ...Tokelau . . . . . . . . . . . .Tonga ... ... ... ... ... ... ... ... ... ... ... ...Tuvalu . . . . . . . . . . . .Vanuatu ... ... ... ... ... ... ... ... ... ... ... ...Viet Nam 244 43 20 22 - - 20 22 77 48 33 53Latin America and the CaribbeanAnguilla 0.01 -1 91 -1 - -1 ... -1 - -1 - -1 - -1 - -1 100 -1 91 -1 100 -1 91 -1Antigua and Barbuda ... ... ... ... ... ... ... ... ... ... ... ...Argentina (w) 236 -1 66 -1 13 -1 47 -1 7 -1 54 -1 5 -1 38 -1 87 -1 69 -1 21 -1 83 -1184
G l o b a l e d u c a t i o n d i g e s t 2 0 1 0 C o m p a r i n g e d u c a t i o n s t a t i s t i c s a r o u n d t h e w o r l dGraduates by field of education as a % of totalRegionHumanities and artsSocial science,business and lawOther fieldsAgriculture Health and welfare ServicesNot known orunspecifiedMF % F MF % F MF % F MF % F MF % F MF % F13 14 15 16 17 18 19 20 21 22 23 24... ... ... ... ... ... ... ... ... ... ... ... GeorgiaCountry or territory... ... ... ... ... ... ... ... ... ... ... ... Kazakhstan8 53 38 56 2 28 12 81 6 28 1 71 Kyrgyzstan10 75 45 66 3 67 7 84 6 38 - 50 Mongolia34 ... 29 ... 3 ... 3 ... 1 ... - ... Tajikistan... ... ... ... ... ... ... ... ... ... ... ... Turkmenistan12 60 23 21 4 15 4 43 2 29 - - Uzbekistan10 64 44 54 1 51 14 77 3 52 - 67 Australia (u)East Asia and the Pacific5 55 11 64 . . 8 67 . . 4 81 Brunei Darussalam14 31 66 31 2 20 3 23 - 56 - - Cambodia... ... ... ... ... ... ... ... ... ... ... ... China (w). . . . . . . . . . . . Cook Islands... ... ... ... ... ... ... ... ... ... ... ... Democratic People’s Republic of Korea... ... ... ... ... ... ... ... ... ... ... ... Fiji9 * 69 * 34 * 61 * - - 6 * 71 * 2 * 61 * 8 * 46 * Hong Kong SAR of China… ... … ... … ... … ... ... ... … ... Indonesia (w)15 69 26 38 2 39 13 63 10 77 6 58 Japan (u). . . . . . . . . . . . Kiribati26 -2 43 -2 10 -2 44 -2 11 -2 21 -2 2 -2 56 -2 4 -2 20 -2 13 -2 47 -2 Lao People’s Democratic Republic7 73 67 41 - - 6 79 10 68 - - Macao, China3 -1 65 -1 31 -1 68 -1 - -1 61 -1 9 -1 77 -1 1 -1 42 -1 1 -1 60 -1 Malaysia (w)... ... ... ... ... ... ... ... ... ... ... ... Marshall Islands... ... ... ... ... ... ... ... ... ... ... ... Micronesia (Federated States of)39 -1 70 -1 19 -1 68 -1 - -1 ... - -1 ... - -1 ... - -1 ... Myanmar... ... ... ... ... ... ... ... ... ... ... ... Nauru16 64 35 56 1 65 15 79 2 68 - 64 New Zealand (u). . . . . . . . . . . . Niue... ... ... ... ... ... ... ... ... ... ... ... Palau... ... ... ... ... ... ... ... ... ... ... ... Papua New Guinea... ... ... ... ... ... ... ... ... ... 100 -2 61 -2 Philippines (w)18 67 20 46 1 41 13 70 6 44 - - Republic of Korea (u)... ... ... ... ... ... ... ... ... ... ... ... Samoa... ... ... ... ... ... ... ... ... ... ... ... Singapore. . . . . . . . . . . . Solomon Islands... ... ... ... ... ... ... ... ... ... ... ... Thailand (w)... ... ... ... ... ... ... ... ... ... ... ... Timor-Leste. . . . . . . . . . . . Tokelau... ... ... ... ... ... ... ... ... ... ... ... Tonga. . . . . . . . . . . . Tuvalu... ... ... ... ... ... ... ... ... ... ... ... Vanuatu4 31 27 53 5 39 3 39 4 18 4 45 Viet Nam- -1 - -1 - -1 - -1 - -1 - -1 - -1 - -1 - -1 - -1 - -1 - -1 AnguillaLatin America and the Caribbean... ... ... ... ... ... ... ... ... ... ... ... Antigua and Barbuda11 -1 71 -1 31 -1 61 -1 2 -1 40 -1 16 -1 75 -1 6 -1 52 -1 ... ... Argentina (w)185
T a b l e11 TERTIARY EDUCATION / ISCED 5 and 6 / Graduates by broad fields of education / 2008RegionTotal numberof graduatesTotalGraduates by field of education as a % of totalScience and technology fieldsOther fieldsCountry or territory MF (000) % F MF % F MF % F MF % F MF % F MF % F1 2 3 4 5 6 7 8 9 10 11 12ScienceEngineering, manufacturingand construction Total EducationAruba 0.29 58 24 13 . . 24 13 76 72 16 78Bahamas ... ... ... ... ... ... ... ... ... ... ... ...Barbados 1.7 -1 74 -1 12 -1 54 -1 12 -1 54 -1 - -1 - -1 88 -1 77 -1 16 -1 84 -1Belize ... ... ... ... ... ... ... ... ... ... ... ...Bermuda 0.17 -1 63 -1 22 -1 19 -1 7 -1 64 -1 16 -1 - -1 78 -1 75 -1 3 -1 100 -1Bolivia ... ... ... ... ... ... ... ... ... ... ... ...Brazil (w) 917 60 12 34 7 37 5 29 83 65 23 78British Virgin Islands ... ... ... ... ... ... ... ... ... ... ... ...Cayman Islands 0.22 62 35 33 17 28 18 38 65 77 - -Chile (w) 87 -1 53 -1 24 -1 22 -1 7 -1 28 -1 17 -1 20 -1 76 -1 62 -1 16 -1 79 -1Colombia 135 43 27 27 2 39 26 26 73 49 8 57Costa Rica ... ... ... ... ... ... ... ... ... ... ... ...Cuba 104 48 4 37 2 48 2 23 40 68 22 70Dominica ... ... ... ... ... ... ... ... ... ... ... ...Dominican Republic ... ... ... ... ... ... ... ... ... ... ... ...Ecuador 70 59 13 32 6 41 7 25 87 63 22 70El Salvador 16 58 28 34 17 41 11 24 72 67 11 77Grenada ... ... ... ... ... ... ... ... ... ... ... ...Guatemala 6.1 -1 50 -1 17 -1 34 -1 3 -1 75 -1 14 -1 26 -1 83 -1 53 -1 25 -1 63 -1Guyana 1.7 70 12 29 6 46 7 14 88 76 36 84Haiti ... ... ... ... ... ... ... ... ... ... ... ...Honduras 14 60 ... ... ... ... ... ... ... ... ... ...Jamaica (w) ... ... ... ... ... ... ... ... ... ... ... ...Mexico (u) 420 54 26 34 11 43 15 28 73 62 13 72Montserrat . -1 . -1 . -1 . -1 . -1 . -1 . -1 . -1 . -1 . -1 . -1 . -1Netherlands Antilles ... ... ... ... ... ... ... ... ... ... ... ...Nicaragua ... ... ... ... ... ... ... ... ... ... ... ...Panama 20 -1 67 -1 20 -1 40 -1 5 -1 53 -1 16 -1 37 -1 80 -1 73 -1 26 -1 80 -1Paraguay (w) ... ... ... ... ... ... ... ... ... ... ... ...Peru (w) ... ... ... ... ... ... ... ... ... ... ... ...Saint Kitts and Nevis ... ... ... ... ... ... ... ... ... ... ... ...Saint Lucia ... ... ... ... ... ... ... ... ... ... ... ...Saint Vincent and the Grenadines ... ... ... ... ... ... ... ... ... ... ... ...Suriname ... ... ... ... ... ... ... ... ... ... ... ...Trinidad and Tobago ... ... ... ... ... ... ... ... ... ... ... ...Turks and Caicos Islands ... ... ... ... ... ... ... ... ... ... ... ...Uruguay (u) 8.9 -1 69 -1 12 -1 49 -1 6 -1 50 -1 6 -1 49 -1 88 -1 71 -1 29 -1 85 -1Venezuela ... ... ... ... ... ... ... ... ... ... ... ...North America and Western EuropeAndorra 0.04 48 24 10 24 10 - - 76 59 - -Austria (u) 44 52 28 24 11 33 18 19 71 63 11 78Belgium (u) 97 59 16 26 6 29 10 24 80 65 13 76Canada (u) ... ... ... ... ... ... ... ... ... ... ... ...Cyprus (u) 4.2 62 13 37 9 43 3 21 87 65 11 87Denmark (u) 51 -1 57 -1 20 -1 36 -1 7 -1 36 -1 13 -1 36 -1 80 -1 63 -1 8 -1 73 -1Finland (u) 60 64 27 33 12 47 15 22 73 75 8 85186
G l o b a l e d u c a t i o n d i g e s t 2 0 1 0 C o m p a r i n g e d u c a t i o n s t a t i s t i c s a r o u n d t h e w o r l dGraduates by field of education as a % of totalRegionHumanities and artsSocial science,business and lawOther fieldsAgriculture Health and welfare ServicesNot known orunspecifiedMF % F MF % F MF % F MF % F MF % F MF % F13 14 15 16 17 18 19 20 21 22 23 24. . 42 61 . . 19 89 . . . . Aruba... ... ... ... ... ... ... ... ... ... ... ... Bahamas10 -1 85 -1 61 -1 74 -1 - -1 - -1 1 -1 75 -1 - -1 - -1 - -1 - -1 Barbados... ... ... ... ... ... ... ... ... ... ... ... Belize6 -1 70 -1 35 -1 73 -1 - -1 - -1 24 -1 88 -1 10 -1 50 -1 - -1 - -1 Bermuda... ... ... ... ... ... ... ... ... ... ... ... Bolivia3 58 39 55 2 39 14 74 2 65 5 53 Brazil (w)Country or territory... ... ... ... ... ... ... ... ... ... ... ... British Virgin Islands- - 56 77 - - - - 9 80 - - Cayman Islands5 -1 55 -1 30 -1 54 -1 3 -1 38 -1 15 -1 77 -1 7 -1 45 -1 - -1 100 -1 Chile (w)4 39 50 47 2 30 8 60 - - - - Colombia... ... ... ... ... ... ... ... ... ... ... ... Costa Rica1 60 5 68 1 35 8 74 2 30 56 35 Cuba... ... ... ... ... ... ... ... ... ... ... ... Dominica... ... ... ... ... ... ... ... ... ... ... ... Dominican Republic1 58 48 60 3 30 10 69 3 66 - - Ecuador2 58 39 61 1 35 19 78 - 50 - - El Salvador... ... ... ... ... ... ... ... ... ... ... ... Grenada1 -1 74 -1 37 -1 48 -1 7 -1 20 -1 13 -1 64 -1 - -1 - -1 - -1 - -1 Guatemala3 70 42 73 2 29 5 66 1 56 - - Guyana... ... ... ... ... ... ... ... ... ... ... ... Haiti... ... ... ... ... ... ... ... ... ... ... ... Honduras... ... ... ... ... ... ... ... ... ... ... ... Jamaica (w)4 59 42 59 2 34 9 65 3 62 ... ... Mexico (u). -1 . -1 . -1 . -1 . -1 . -1 . -1 . -1 . -1 . -1 . -1 . -1 Montserrat... ... ... ... ... ... ... ... ... ... ... ... Netherlands Antilles... ... ... ... ... ... ... ... ... ... ... ... Nicaragua6 -1 63 -1 37 -1 72 -1 - -1 36 -1 7 -1 75 -1 3 -1 57 -1 - -1 - -1 Panama... ... ... ... ... ... ... ... ... ... ... ... Paraguay (w)... ... ... ... ... ... ... ... ... ... ... ... Peru (w)... ... ... ... ... ... ... ... ... ... ... ... Saint Kitts and Nevis... ... ... ... ... ... ... ... ... ... ... ... Saint Lucia... ... ... ... ... ... ... ... ... ... ... ... Saint Vincent and the Grenadines... ... ... ... ... ... ... ... ... ... ... ... Suriname... ... ... ... ... ... ... ... ... ... ... ... Trinidad and Tobago... ... ... ... ... ... ... ... ... ... ... ... Turks and Caicos Islands3 -1 66 -1 31 -1 66 -1 2 -1 29 -1 20 -1 76 -1 4 -1 24 -1 - -1 - -1 Uruguay (u)... ... ... ... ... ... ... ... ... ... ... ... Venezuela- - 40 59 - - 36 60 - - - - Andorra9 66 35 57 2 41 11 68 4 59 - 42 Austria (u)11 61 31 58 3 55 21 75 1 56 5 56 Belgium (u)... ... ... ... ... ... ... ... ... ... ... ... Canada (u)10 76 46 60 - 25 7 66 12 58 - - Cyprus (u)13 -1 65 -1 32 -1 52 -1 2 -1 39 -1 22 -1 81 -1 3 -1 19 -1 - -1 - -1 Denmark (u)17 76 26 67 2 54 15 88 5 75 - - Finland (u)North America and Western Europe187
T a b l e11 TERTIARY EDUCATION / ISCED 5 and 6 / Graduates by broad fields of education / 2008RegionTotal numberof graduatesTotalGraduates by field of education as a % of totalScience and technology fieldsOther fieldsCountry or territory MF (000) % F MF % F MF % F MF % F MF % F MF % F1 2 3 4 5 6 7 8 9 10 11 12ScienceEngineering, manufacturingand construction Total EducationFrance (u) 621 55 26 28 11 36 16 23 74 65 2 71Germany (u) 467 57 26 31 13 44 13 19 73 66 9 76Gibraltar . . . . . . . . . . . .Greece (u) 60 -1 59 -1 22 -1 44 -1 9 -1 50 -1 12 -1 39 -1 78 -1 64 -1 7 -1 77 -1Holy See ... ... ... ... ... ... ... ... ... ... ... ...Iceland (u) 3.6 66 14 35 7 39 7 31 86 71 23 84Ireland (u) 60 56 24 30 14 41 10 16 75 65 7 76Israel (u) ... ... ... ... ... ... ... ... ... ... ... ...Italy (u) 400 -1 60 -1 20 -1 38 -1 7 -1 54 -1 14 -1 31 -1 79 -1 66 -1 12 -1 83 -1Liechtenstein (u) 0.14 38 22 26 - - 22 26 78 41 - -Luxembourg (u) ... ... ... ... ... ... ... ... ... ... ... ...Malta (u) 2.7 -1 57 -1 15 -1 38 -1 8 -1 46 -1 7 -1 29 -1 85 -1 61 -1 10 -1 78 -1Monaco . . . . . . . . . . . .Netherlands (u) 124 57 14 19 6 20 8 18 86 63 15 81Norway (u) 35 61 15 30 8 35 8 25 85 66 18 73Portugal (u) 72 -2 65 -2 ... ... ... ... ... ... ... ... ... ...San Marino ... ... ... ... ... ... ... ... ... ... ... ...Spain (u) 291 58 26 30 9 36 16 27 74 68 13 82Sweden (u) 60 64 24 33 7 42 17 30 76 73 18 78Switzerland (u) 79 49 21 19 9 28 12 13 79 56 10 71United Kingdom (u) 651 -1 58 -1 22 -1 31 -1 13 -1 38 -1 8 -1 21 -1 77 -1 66 -1 11 -1 75 -1United States of America (u) 2,782 58 15 31 8 41 7 19 85 63 11 78South and West AsiaAfghanistan ... ... ... ... ... ... ... ... ... ... ... ...Bangladesh ... ... ... ... ... ... ... ... ... ... ... ...Bhutan ... ... ... ... ... ... ... ... ... ... ... ...India (w) ... ... ... ... ... ... ... ... ... ... ... ...Iran (Islamic Republic of) 340 -1 50 -1 41 -1 37 -1 10 -1 69 -1 31 -1 27 -1 59 -1 60 -1 7 -1 70 -1Maldives ... ... ... ... ... ... ... ... ... ... ... ...Nepal ... ... ... ... ... ... ... ... ... ... ... ...Pakistan ... ... ... ... ... ... ... ... ... ... ... ...Sri Lanka (w) ... ... ... ... ... ... ... ... ... ... ... ...Sub-Saharan AfricaAngola ... ... ... ... ... ... ... ... ... ... ... ...Benin ... ... ... ... ... ... ... ... ... ... ... ...Botswana ... ... ... ... ... ... ... ... ... ... ... ...Burkina Faso 10 +1 20 +1 ... ... ... ... ... ... ... ... ... ...Burundi ... ... ... ... ... ... ... ... ... ... ... ...Cameroon 34 ... 18 ... 14 ... 4 ... 80 ... 8 ...Cape Verde ... ... ... ... ... ... ... ... ... ... ... ...Central African Republic ... ... ... ... ... ... ... ... ... ... ... ...Chad … ... ... ... … ... ... ... ... ... ... ...Comoros ... ... ... ... ... ... ... ... ... ... ... ...Congo ... ... ... ... ... ... ... ... ... ... ... ...Côte d’Ivoire ... ... ... ... ... ... ... ... ... ... ... ...Democratic Republic of the Congo ... ... ... ... ... ... ... ... ... ... ... ...188
G l o b a l e d u c a t i o n d i g e s t 2 0 1 0 C o m p a r i n g e d u c a t i o n s t a t i s t i c s a r o u n d t h e w o r l dGraduates by field of education as a % of totalRegionHumanities and artsSocial science,business and lawOther fieldsAgriculture Health and welfare ServicesNot known orunspecifiedMF % F MF % F MF % F MF % F MF % F MF % F13 14 15 16 17 18 19 20 21 22 23 2411 71 41 63 1 38 15 73 4 47 - - France (u)Country or territory17 74 23 53 2 39 18 75 3 56 1 58 Germany (u). . . . . . . . . . . . Gibraltar16 -1 69 -1 25 -1 65 -1 4 -1 53 -1 16 -1 65 -1 10 -1 43 -1 ... ... Greece (u)... ... ... ... ... ... ... ... ... ... ... ... Holy See11 65 37 58 - 50 14 88 2 75 - - Iceland (u)22 66 32 57 1 64 11 82 2 43 - 66 Ireland (u)... ... ... ... ... ... ... ... ... ... ... ... Israel (u)15 -1 74 -1 32 -1 57 -1 2 -1 46 -1 15 -1 67 -1 2 -1 51 -1 1 -1 61 -1 Italy (u)- - 78 41 - - - - - - - - Liechtenstein (u)... ... ... ... ... ... ... ... ... ... ... ... Luxembourg (u)16 -1 61 -1 47 -1 56 -1 - -1 - -1 10 -1 67 -1 1 -1 60 -1 - -1 - -1 Malta (u). . . . . . . . . . . . Monaco9 57 37 52 1 52 18 75 5 56 - 56 Netherlands (u)9 61 29 54 1 59 24 82 4 45 - 58 Norway (u)... ... ... ... ... ... ... ... ... ... ... ... Portugal (u)... ... ... ... ... ... ... ... ... ... ... ... San Marino9 61 27 63 2 48 15 78 8 55 - 52 Spain (u)6 61 24 63 1 67 25 83 3 66 - 73 Sweden (u)8 61 38 47 2 46 14 78 6 42 - 57 Switzerland (u)16 -1 62 -1 30 -1 56 -1 1 -1 62 -1 18 -1 80 -1 1 -1 63 -1 ... ... United Kingdom (w)13 59 38 56 1 48 15 82 7 55 - 69 United States of America (u)South and West Asia... ... ... ... ... ... ... ... ... ... ... ... Afghanistan... ... ... ... ... ... ... ... ... ... ... ... Bangladesh... ... ... ... ... ... ... ... ... ... ... ... Bhutan... ... ... ... ... ... ... ... ... ... ... ... India (w)14 -1 68 -1 23 -1 53 -1 5 -1 38 -1 8 -1 72 -1 3 -1 54 -1 - -1 - -1 Iran (Islamic Republic of)... ... ... ... ... ... ... ... ... ... ... ... Maldives... ... ... ... ... ... ... ... ... ... ... ... Nepal... ... ... ... ... ... ... ... ... ... ... ... Pakistan... ... ... ... ... ... ... ... ... ... ... ... Sri Lanka (w)... ... ... ... ... ... ... ... ... ... ... ... Angola... ... ... ... ... ... ... ... ... ... ... ... Benin... ... ... ... ... ... ... ... ... ... ... ... BotswanaSub-Saharan Africa... ... ... ... ... ... ... ... ... ... ... ... Burkina Faso... ... ... ... ... ... ... ... ... ... ... ... Burundi7 ... 64 ... - ... 1 ... - ... 2 ... Cameroon... ... ... ... ... - ... ... ... ... ... ... Cape Verde... ... ... ... ... ... ... ... ... ... ... ... Central African Republic… ... … ... ... ... … ... ... ... ... ... Chad... ... ... ... ... ... ... ... ... ... ... ... Comoros... ... ... ... ... ... ... ... ... ... ... ... Congo... ... ... ... ... ... ... ... ... ... ... ... Côte d’Ivoire... ... ... ... ... ... ... ... ... ... ... ... Democratic Republic of the Congo189
T a b l e11 TERTIARY EDUCATION / ISCED 5 and 6 / Graduates by broad fields of education / 2008RegionTotal numberof graduatesTotalGraduates by field of education as a % of totalScience and technology fieldsOther fieldsCountry or territory MF (000) % F MF % F MF % F MF % F MF % F MF % F1 2 3 4 5 6 7 8 9 10 11 12ScienceEngineering, manufacturingand construction Total EducationEquatorial Guinea ... ... ... ... ... ... ... ... ... ... ... ...Eritrea ... ... ... ... ... ... ... ... ... ... ... ...Ethiopia 49 19 15 16 9 18 6 14 85 20 24 15Gabon ... ... ... ... ... ... ... ... ... ... ... ...Gambia ... ... ... ... ... ... ... ... ... ... ... ...Ghana ... ... ... ... ... ... ... ... ... ... ... ...Guinea ... ... ... ... ... ... ... ... ... ... ... ...Guinea-Bissau ... ... ... ... ... ... ... ... ... ... ... ...Kenya ... ... ... ... ... ... ... ... ... ... ... ...Lesotho ... ... ... ... ... ... ... ... ... ... ... ...Liberia ... ... ... ... ... ... ... ... ... ... ... ...Madagascar 16 47 20 31 13 38 7 16 79 52 1 39Malawi 1.3 -1 34 -1 13 -1 19 -1 7 -1 25 -1 6 -1 11 -1 68 -1 38 -1 15 -1 26 -1Mali ... ... ... ... ... ... ... ... ... ... ... ...Mauritius ... ... ... ... ... ... ... ... ... ... ... ...Mozambique ... ... ... ... ... ... ... ... ... ... ... ...Namibia 5.5 58 3 38 1 60 1 18 96 59 48 57Niger 1.9 ... 4 ... 4 ... - ... 96 ... 12 ...Nigeria ... ... ... ... ... ... ... ... ... ... ... ...Rwanda ... ... ... ... ... ... ... ... ... ... ... ...Sao Tome and Principe . . . . . . . . . . . .Senegal ... ... ... ... ... ... ... ... ... ... ... ...Seychelles . +1 . +1 . +1 . +1 . +1 . +1 . +1 . +1 . +1 . +1 . +1 . +1Sierra Leone ... ... ... ... ... ... ... ... ... ... ... ...Somalia ... ... ... ... ... ... ... ... ... ... ... ...South Africa ... ... ... ... ... ... ... ... ... ... ... ...Swaziland 1.8 -2 54 -2 3 -2 30 -2 2 -2 30 -2 - -2 33 -2 97 -2 55 -2 42 -2 56 -2Togo ... ... ... ... ... ... ... ... ... ... ... ...Uganda ... ... ... ... ... ... ... ... ... ... ... ...United Republic of Tanzania ... ... ... ... ... ... ... ... ... ... ... ...Zambia ... ... ... ... ... ... ... ... ... ... ... ...Zimbabwe ... ... ... ... ... ... ... ... ... ... ... ...(w) These countries are part of the World Education Indicators programme (WEI) and are not required to provide graduates by field of study.(u) These countries have completed the UOE questionnaires. Data by field of study refer to graduations rather than graduates.Please refer to the Reader’s Guide for more information on the data and symbols used in each table.190
G l o b a l e d u c a t i o n d i g e s t 2 0 1 0 C o m p a r i n g e d u c a t i o n s t a t i s t i c s a r o u n d t h e w o r l dGraduates by field of education as a % of totalRegionHumanities and artsSocial science,business and lawOther fieldsAgriculture Health and welfare ServicesNot known orunspecifiedMF % F MF % F MF % F MF % F MF % F MF % F13 14 15 16 17 18 19 20 21 22 23 24Country or territory... ... ... ... ... ... ... ... ... ... ... ... Equatorial Guinea... ... ... ... ... ... ... ... ... ... ... ... Eritrea3 22 43 23 8 15 7 24 - - - - Ethiopia... ... ... ... ... ... ... ... ... ... ... ... Gabon... ... ... ... ... ... ... ... ... ... ... ... Gambia... ... ... ... ... ... ... ... ... ... ... ... Ghana... ... ... ... ... ... ... ... ... ... ... ... Guinea... ... ... ... ... ... ... ... ... ... ... ... Guinea-Bissau... ... ... ... ... ... ... ... ... ... ... ... Kenya... ... ... ... ... ... ... ... ... ... ... ... Lesotho... ... ... ... ... ... ... ... ... ... ... ... Liberia11 59 63 51 1 43 3 51 - 43 1 68 Madagascar18 -1 33 -1 14 -1 35 -1 11 -1 35 -1 8 -1 79 -1 2 -1 33 -1 19 -1 34 -1 Malawi... ... ... ... ... ... ... ... ... ... ... ... Mali... ... ... ... ... ... ... ... ... ... ... ... Mauritius... ... ... ... ... ... ... ... ... ... ... ... Mozambique7 65 35 59 3 49 3 84 - 43 1 72 Namibia29 ... 36 ... 14 ... 5 ... - ... - ... Niger... ... ... ... ... ... ... ... ... ... ... ... Nigeria... ... ... ... ... ... ... ... ... ... ... ... Rwanda. . . . . . . . . . . . Sao Tome and Principe... ... ... ... ... ... ... ... ... ... ... ... Senegal. +1 . +1 . +1 . +1 . +1 . +1 . +1 . +1 . +1 . +1 . +1 . +1 Seychelles... ... ... ... ... ... ... ... ... ... ... ... Sierra Leone... ... ... ... ... ... ... ... ... ... ... ... Somalia... ... ... ... ... ... ... ... ... ... ... ... South Africa6 -2 65 -2 36 -2 52 -2 6 -2 35 -2 6 -2 78 -2 1 -2 36 -2 . -2 . -2 Swaziland... ... ... ... ... ... ... ... ... ... ... ... Togo... ... ... ... ... ... ... ... ... ... ... ... Uganda... ... ... ... ... ... ... ... ... ... ... ... United Republic of Tanzania... ... ... ... ... ... ... ... ... ... ... ... Zambia... ... ... ... ... ... ... ... ... ... ... ... Zimbabwe191
T a b l e12 SCHOOL LIFE EXPECTANCYRegionSchool life expectancy (approximation method) in yearsCountry or territoryArab StatesPre-primary (ISCED 0) Primary and secondary (ISCED 1-3) Tertiary (ISCED 5-6)2008 2008 2008MF M F MF M F GPI MF M F GPI1 2 3 4 5 6 7 8 9 10 11Algeria 0.2 0.2 0.2 ... ... ... ... ... ... ... ...Bahrain 1.6 1.6 1.6 12.1 12.1 12.2 1.01 ... ... ... ...Djibouti 0.1 0.1 0.1 4.9 5.4 4.3 0.80 ... ... ... ...Egypt 0.3 -1 0.3 -1 0.3 -1 ... ... ... ... 1.4 ** ... ... ...Iraq ... ... ... ... ... ... ... ... ... ... ...Jordan 0.7 0.8 0.7 11.1 11.0 11.2 1.02 2.0 ** 1.9 ** 2.1 ** 1.11 **Kuwait 1.5 1.5 1.5 11.0 10.9 11.1 1.01 ... ... ... ...Lebanon 2.3 +1 2.3 +1 2.3 +1 11.1 +1 10.9 +1 11.3 +1 1.04 +1 2.6 **, +1 2.4 **, +1 2.9 **, +1 **, +11.19Libyan Arab Jamahiriya 0.2 -2 0.2 -2 0.2 -2 13.2 -2 12.8 -2 13.5 -2 1.05 -2 ... ... ... ...Mauritania ... ... ... 7.8 **, -1 7.7 **, -1 7.9 **, -1 1.02 **, -1 0.2 **, -1 ... ... ...Morocco 1.1 1.3 1.0 9.7 -1 10.3 **, -1 9.1 **, -1 0.88 **, -1 0.6 **, -1 0.6 **, -1 0.5 **, -1 **, -10.89Oman 0.7 0.6 0.7 9.8 9.9 9.7 0.99 1.3 ** 1.3 ** 1.4 ** 1.15 **Palestinian Autonomous Territories 0.6 0.6 0.6 10.4 10.1 10.6 1.05 2.7 2.5 3.0 1.20Qatar 1.5 1.5 1.6 12.2 11.6 13.3 1.14 0.5 0.3 1.5 5.98Saudi Arabia 0.3 ** 0.3 ** 0.3 ** 11.8 12.4 ** 11.2 ** 0.90 ** 1.5 ** 1.1 ** 1.9 ** 1.65 **Sudan 0.6 **, +1 0.6 **, +1 0.6 **, +1 6.3 **, +1 6.7 **, +1 6.0 **, +1 0.89 **, +1 ... ... ... ...Syrian Arab Republic 0.3 0.3 0.3 10.9 11.0 10.7 0.97 ... ... ... ...Tunisia ... ... ... 12.8 12.6 13.0 1.03 1.7 ** 1.4 ** 2.0 ** 1.49 **United Arab Emirates 1.7 -1 1.7 -1 1.7 -1 11.8 **, -1 11.8 **, -1 11.9 **, -1 1.01 **, -1 ... ... ... ...Yemen ... ... ... ... ... ... ... ... ... ... ...Central and Eastern EuropeAlbania ... ... ... ... ... ... ... ... ... ... ...Belarus 3.1 -1 3.1 -1 3.0 -1 10.5 -1 10.4 -1 10.5 -1 1.01 -1 3.5 -1 2.9 -1 4.0 -1 1.40 -1Bosnia and Herzegovina 0.4 ** 0.4 ** 0.4 ** 11.6 ** 11.5 ** 11.7 ** 1.02 ** ... ... ... ...Bulgaria 3.2 3.2 3.2 11.1 11.2 11.0 0.98 2.5 2.2 2.8 1.30Croatia 2.0 -1 2.1 -1 2.0 -1 11.5 -1 11.4 -1 11.6 -1 1.02 -1 2.4 -1 2.1 -1 2.6 -1 1.22 -1Czech Republic 3.4 3.4 3.3 12.5 12.5 12.5 1.01 2.8 2.4 3.2 1.33Estonia 3.8 3.8 3.8 11.9 11.9 12.0 1.01 3.4 2.5 4.2 1.67Hungary 3.5 3.5 3.5 11.8 11.9 11.7 0.99 3.1 2.5 3.6 1.43Latvia 3.6 3.6 3.5 11.6 11.6 11.6 1.00 3.7 2.6 4.8 1.87Lithuania 2.9 2.9 2.9 11.8 11.8 11.7 1.00 4.0 3.2 4.9 1.56Montenegro ... ... ... ... ... ... ... ... ... ... ...Poland 2.4 -1 2.4 -1 2.4 -1 11.8 -1 11.8 -1 11.7 -1 1.00 -1 3.4 -1 2.8 -1 4.0 -1 1.40 -1Republic of Moldova 2.9 * 2.9 * 2.9 * 9.9 * 9.8 * 10.0 * 1.01 * 2.1 * 1.7 * 2.5 * 1.44 *Romania 2.9 2.9 2.9 11.5 11.5 11.5 1.00 3.2 2.7 3.7 1.35Russian Federation 3.6 3.6 3.5 10.2 10.3 10.1 0.98 3.9 ** 3.3 ** 4.5 ** 1.36 **Serbia 2.4 * 2.4 * 2.4 * 11.1 * 11.0 * 11.2 * 1.02 * 2.4 * 2.1 * 2.7 * 1.29 *Slovakia 2.8 2.8 2.8 12.2 12.1 12.2 1.01 2.7 2.1 3.3 1.59Slovenia 2.5 2.5 2.4 12.6 12.6 12.6 0.99 4.2 3.4 5.0 1.46The former Yugoslav Rep. of Macedonia 1.5 -1 1.5 -1 1.5 -1 10.5 -1 10.6 -1 10.4 -1 0.99 -1 1.8 -1 1.6 -1 2.0 -1 1.27 -1Turkey 0.5 0.5 0.5 9.9 10.2 9.5 0.93 1.9 2.2 1.7 0.78Ukraine 2.9 ** 3.0 ** 2.9 ** 10.4 10.5 * 10.4 * 0.99 * 4.0 3.6 * 4.4 * 1.24 *Central AsiaArmenia 1.3 **, -1 1.2 **, -1 1.5 **, -1 9.4 ** 9.2 ** 9.6 ** 1.04 ** ... ... ... ...Azerbaijan 0.8 * 0.8 * 0.8 * 11.8 * 11.9 * 11.7 * 0.98 * 0.8 * 0.9 * 0.7 * 0.82 *192
G l o b a l e d u c a t i o n d i g e s t 2 0 1 0 C o m p a r i n g e d u c a t i o n s t a t i s t i c s a r o u n d t h e w o r l dSchool life expectancy (approximation method) in yearsRegionPrimary to tertiary (ISCED 1-6)1999 2008MF M F GPI MF M F GPI12 13 14 15 16 17 18 19Country or territoryArab States... ... ... ... ... ... ... ... Algeria13.4 ** 12.8 ** 14.0 ** 1.09 ** ... ... ... ... Bahrain3.1 ** 3.6 ** 2.6 ** 0.71 ** ... ... ... ... Djibouti11.6 ** ... ... ... ... ... ... ... Egypt8.4 ** 9.6 ** 7.2 ** 0.75 ** ... ... ... ... Iraq12.5 **, +1 12.3 **, +1 12.7 **, +1 1.03 **, +1 13.1 ** 12.9 ** 13.3 ** 1.04 ** Jordan13.6 ** 13.0 ** 14.3 ** 1.10 ** ... ... ... ... Kuwait12.6 ** 12.5 ** 12.7 ** 1.02 ** 13.8 **, +1 13.3 **, +1 14.2 **, +1 1.06 **, +1 Lebanon... ... ... ... ... ... ... ... Libyan Arab Jamahiriya6.8 ** ... ... ... 8.1 **, -1 ... ... ... Mauritania8.0 ** 8.9 ** 7.0 ** 0.80 ** ... 11.1 **, -1 ... ... Morocco... ... ... ... 11.1 ** 11.1 ** 11.2 ** 1.01 ** Oman12.0 12.0 12.1 1.01 13.1 12.6 13.6 1.08 Palestinian Autonomous Territories12.5 ** 11.8 ** 13.4 ** 1.14 ** 12.7 11.9 14.8 1.24 Qatar... ... ... ... 13.5 ** 13.8 ** 13.1 ** 0.95 ** Saudi Arabia4.4 ** ... ... ... ... ... ... ... Sudan... ... ... ... ... ... ... ... Syrian Arab Republic13.0 ** 13.2 ** 12.9 ** 0.97 ** 14.5 ** 14.0 ** 15.0 ** 1.07 ** Tunisia10.8 ** 10.4 ** 11.5 ** 1.10 ** ... ... ... ... United Arab Emirates7.6 ** 10.2 ** 4.8 ** 0.46 ** ... ... ... ... Yemen11.1 ** 11.1 ** 11.0 ** 0.99 ** ... ... ... ... Albania13.7 ** 13.4 ** 13.9 ** 1.04 ** 14.6 -1 14.2 -1 15.0 -1 1.06 -1 BelarusCentral and Eastern Europe... ... ... ... ... ... ... ... Bosnia and Herzegovina13.0 12.6 13.4 1.06 13.6 13.4 13.9 1.03 Bulgaria12.0 11.9 12.2 1.02 13.8 -1 13.5 -1 14.2 -1 1.05 -1 Croatia13.3 ** 13.2 ** 13.4 ** 1.01 ** 15.4 15.0 15.8 1.05 Czech Republic14.4 13.9 15.0 1.08 15.7 14.7 16.8 1.15 Estonia13.9 13.6 14.1 1.04 15.3 14.8 15.7 1.06 Hungary13.7 13.0 14.4 1.11 15.4 14.3 16.5 1.16 Latvia13.9 13.5 14.4 1.07 16.0 15.1 16.8 1.12 Lithuania... ... ... ... ... ... ... ... Montenegro14.6 14.2 14.9 1.05 15.2 -1 14.7 -1 15.8 -1 1.08 -1 Poland11.4 ** 11.2 ** 11.6 ** 1.03 ** 12.0 ** 11.6 ** 12.5 ** 1.07 ** Republic of Moldova11.9 11.7 12.0 1.02 14.8 14.3 15.4 1.07 Romania... ... ... ... 14.1 ** 13.6 ** 14.6 ** 1.07 ** Russian Federation... ... ... ... 13.5 * 13.1 * 13.9 * 1.06 * Serbia13.1 ** 12.9 ** 13.2 ** 1.02 ** 14.9 14.2 15.5 1.09 Slovakia14.6 ** 14.1 ** 15.1 ** 1.07 ** 16.8 ** 16.1 ** 17.6 ** 1.10 ** Slovenia11.9 11.9 11.9 1.00 12.3 -1 12.2 -1 12.4 -1 1.02 -1 The former Yugoslav Rep. of Macedonia10.2 ** 11.4 ** 9.0 ** 0.79 ** 11.8 12.4 11.2 0.90 Turkey12.8 ** 12.6 ** 13.0 ** 1.03 ** 14.6 14.3 * 15.0 * 1.05 * UkraineCentral Asia11.2 ** ... ... ... ... ... ... ... Armenia11.0 ** 11.2 ** 10.8 ** 0.96 ** 13.0 * 13.1 * 12.9 * 0.98 * Azerbaijan193
T a b l e12 SCHOOL LIFE EXPECTANCYRegionSchool life expectancy (approximation method) in yearsCountry or territoryPre-primary (ISCED 0) Primary and secondary (ISCED 1-3) Tertiary (ISCED 5-6)2008 2008 2008MF M F MF M F GPI MF M F GPI1 2 3 4 5 6 7 8 9 10 11Georgia 1.9 ** 1.7 ** 2.1 ** 10.8 11.0 10.7 0.97 1.7 ** 1.6 ** 1.9 ** 1.19 **Kazakhstan 1.6 +1 1.6 +1 1.6 +1 11.2 +1 11.2 +1 11.1 +1 0.99 +1 2.1 +1 1.8 +1 2.5 +1 1.42 +1Kyrgyzstan 0.7 0.7 0.7 9.8 * 9.8 * 9.8 * 1.01 * 2.7 2.3 3.1 1.35Mongolia 2.3 2.2 2.4 10.9 10.7 11.1 1.04 2.6 2.0 3.2 1.57Tajikistan 0.4 0.4 0.3 10.0 10.5 9.5 0.91 1.1 1.6 0.6 0.40Turkmenistan ... ... ... ... ... ... ... ... ... ... ...Uzbekistan 1.1 1.1 1.1 10.8 10.9 10.8 0.98 0.5 0.6 0.4 0.68East Asia and the PacificAustralia 0.8 0.8 0.8 16.3 16.5 16.0 0.97 3.8 3.4 4.3 1.27Brunei Darussalam 1.7 1.6 1.7 13.2 13.1 13.2 1.01 0.8 0.5 1.0 1.95Cambodia 0.4 0.4 0.4 9.5 -1 10.0 -1 9.0 -1 0.90 -1 0.3 -1 0.4 -1 0.2 -1 0.55 -1China 1.3 ** 1.3 ** 1.3 ** 10.2 ** 10.0 ** 10.5 ** 1.04 ** 1.1 1.1 1.2 1.03Cook Islands ... ... ... ... ... ... ... ... ... ... ...Democratic People’s Republic of Korea ... ... ... ... ... ... ... ... ... ... ...Fiji 0.5 -2 0.5 -2 0.5 -2 11.3 ** 11.2 ** 11.5 ** 1.03 ** ... ... ... ...Hong Kong SAR of China ... ... ... ... ... ... ... ... ... ... ...Indonesia 0.9 0.8 0.9 11.6 11.7 11.5 0.98 1.1 ** 1.1 ** 1.0 ** 0.92 **Japan 2.7 ... ... 12.2 12.2 12.2 1.00 2.9 ** 3.1 ** 2.7 ** 0.88 **Kiribati ... ... ... 11.7 **, -1 11.2 **, -1 12.2 **, -1 1.09 **, -1 ... ... ... ...Lao People’s Democratic Republic 0.4 0.4 0.5 8.3 8.9 7.7 0.87 0.7 0.9 ** 0.6 ** 0.75 **Macao, China ... ... ... 11.3 11.6 11.1 0.95 2.9 3.1 2.7 0.87Malaysia 1.2 -1 1.2 -1 1.3 -1 10.5 -1 10.4 -1 10.7 -1 1.03 -1 1.6 -1 1.4 -1 1.9 -1 1.30 -1Marshall Islands 0.9 *, -1 0.9 *, -1 0.9 *, -1 9.7 *, -1 9.8 *, -1 9.7 *, -1 0.99 *, -1 ... ... ... ...Micronesia (Federated States of) ... ... ... 12.1 **, -1 ... ... ... ... ... ... ...Myanmar 0.1 0.1 0.1 9.0 ... ... ... ... ... ... ...Nauru 2.8 ** 2.7 ** 2.8 ** 8.0 ** 7.6 ** 8.5 ** 1.12 ** ... ... ... ...New Zealand 1.9 1.9 1.9 14.4 ** 14.1 ** 14.6 ** 1.03 ** 4.1 3.4 4.7 1.41Niue ... ... ... ... ... ... ... . . . .Palau ... ... ... 11.6 *, -1 11.7 **, -1 11.6 **, -1 0.99 **, -1 ... ... ... ...Papua New Guinea ... ... ... ... ... ... ... ... ... ... ...Philippines 0.5 0.5 0.5 10.0 9.9 10.0 1.02 1.4 ** 1.3 ** 1.6 ** 1.24 **Republic of Korea 1.1 1.1 1.1 12.1 12.3 11.9 0.97 4.7 5.6 3.8 0.68Samoa 0.9 **, +1 0.9 **, +1 1.0 **, +1 11.3 +1 11.1 +1 11.6 +1 1.05 +1 ... ... ... ...Singapore ... ... ... ... ... ... ... ... ... ... ...Solomon Islands ... ... ... 9.2 -1 9.5 -1 8.9 -1 0.93 -1 ... ... ... ...Thailand 2.8 +1 2.8 +1 2.8 +1 10.0 +1 9.9 +1 10.1 +1 1.03 +1 2.2 **, +1 2.0 **, +1 2.5 **, +1 **, +11.24Timor-Leste ... ... ... ... ... ... ... ... ... ... ...Tokelau ... ... ... ... ... ... ... . . . .Tonga ... ... ... 13.2 -2 13.1 -2 13.2 -2 1.01 -2 ... ... ... ...Tuvalu 3.2 *, -2 3.0 *, -2 3.5 *, -2 ... ... ... ... . . . .Vanuatu 0.2 -2 0.2 -2 0.2 -2 ... ... ... ... ... ... ... ...Viet Nam ... ... ... ... ... ... ... ... ... ... ...Latin America and the CaribbeanAnguilla 1.9 ** 2.0 ** 1.8 ** 10.5 ** 10.7 ** 10.5 ** 0.98 ** 0.2 ** 0.1 ** 0.4 ** 5.01 **Antigua and Barbuda 1.4 * 1.4 * 1.4 * 12.9 * 13.5 * 12.4 * 0.92 * ... ... ... ...Argentina 2.1 -1 2.0 -1 2.1 -1 12.0 -1 11.8 -1 12.3 -1 1.05 -1 3.5 -1 2.8 -1 4.2 -1 1.51 -1194
G l o b a l e d u c a t i o n d i g e s t 2 0 1 0 C o m p a r i n g e d u c a t i o n s t a t i s t i c s a r o u n d t h e w o r l dSchool life expectancy (approximation method) in yearsRegionPrimary to tertiary (ISCED 1-6)1999 2008MF M F GPI MF M F GPI12 13 14 15 16 17 18 1911.4 ** 11.4 ** 11.5 ** 1.00 ** 12.6 ** 12.6 ** 12.6 ** 1.00 ** GeorgiaCountry or territory12.1 11.9 12.3 1.03 15.0 +1 14.6 +1 15.4 +1 1.06 +1 Kazakhstan11.5 11.3 11.6 1.03 12.6 * 12.2 * 13.0 * 1.07 * Kyrgyzstan9.1 ** 8.2 ** 10.0 ** 1.22 ** 13.5 12.7 14.3 1.12 Mongolia9.8 ** 10.6 ** 8.9 ** 0.84 ** 11.4 12.3 10.4 0.85 Tajikistan... ... ... ... ... ... ... ... Turkmenistan10.6 ** 10.8 ** 10.5 ** 0.98 ** 11.4 11.6 11.2 0.97 Uzbekistan20.2 ** 20.0 ** 20.5 ** 1.02 ** 20.6 20.4 20.9 1.03 AustraliaEast Asia and the Pacific13.5 ** 13.2 ** 13.9 ** 1.05 ** 13.9 ** 13.6 ** 14.3 ** 1.05 ** Brunei Darussalam7.5 **, +1 8.3 **, +1 6.6 **, +1 0.80 **, +1 9.8 **, -1 10.4 **, -1 9.2 **, -1 0.88 **, -1 Cambodia... ... ... ... 11.4 ** 11.2 ** 11.6 ** 1.04 ** China10.6 ** 10.5 ** 10.6 ** 1.01 ** ... ... ... ... Cook Islands... ... ... ... ... ... ... ... Democratic People’s Republic of Korea... ... ... ... ... ... ... ... Fiji... ... ... ... ... ... ... ... Hong Kong SAR of China... ... ... ... 12.7 ** 12.8 ** 12.5 ** 0.98 ** Indonesia14.4 ** 14.5 ** 14.2 ** 0.98 ** 15.1 ** 15.2 ** 14.9 ** 0.98 ** Japan11.7 * 11.2 * 12.2 * 1.08 * ... ... ... ... Kiribati8.2 ** 9.1 ** 7.2 ** 0.79 ** 9.2 ** 9.9 ** 8.5 ** 0.86 ** Lao People’s Democratic Republic12.1 ** 12.4 ** 11.9 ** 0.96 ** 14.2 14.7 13.8 0.94 Macao, China11.8 ** 11.7 ** 11.9 ** 1.02 ** 12.5 -1 12.1 -1 12.8 -1 1.05 -1 Malaysia... ... ... ... ... ... ... ... Marshall Islands... ... ... ... ... ... ... ... Micronesia (Federated States of)... ... ... ... ... ... ... ... Myanmar8.4 **, -1 8.1 **, -1 8.6 **, -1 1.06 **, -1 ... ... ... ... Nauru17.2 ** 16.5 ** 17.8 ** 1.08 ** 19.4 ** 18.5 ** 20.2 ** 1.09 ** New Zealand11.9 * 11.5 * 12.4 * 1.08 * ... ... ... ... Niue14.5 **, +1 13.7 **, +1 15.4 **, +1 1.13 **, +1 ... ... ... ... Palau... ... ... ... ... ... ... ... Papua New Guinea11.4 ** 11.2 ** 11.7 ** 1.04 ** 11.9 ** 11.6 ** 12.1 ** 1.04 ** Philippines15.6 16.5 14.6 0.88 16.8 17.8 15.7 0.88 Republic of Korea12.3 ** 12.1 ** 12.5 ** 1.04 ** ... ... ... ... Samoa... ... ... ... ... ... ... ... Singapore7.3 7.7 6.8 0.89 ... ... ... ... Solomon Islands... ... ... ... 12.3 **, +1 11.9 **, +1 12.6 **, +1 1.06 **, +1 Thailand... ... ... ... ... ... ... ... Timor-Leste10.9 **, +1 10.5 **, +1 11.4 **, +1 1.09 **, +1 ... ... ... ... Tokelau13.2 ** 12.9 ** 13.4 ** 1.04 ** ... ... ... ... Tonga... ... ... ... ... ... ... ... Tuvalu9.2 ** ... ... ... ... ... ... ... Vanuatu10.2 ** 10.7 ** 9.7 ** 0.91 ** ... ... ... ... Viet Nam13.5 **, +1 13.4 **, +1 13.7 **, +1 1.02 **, +1 11.1 ** 11.0 ** 11.3 ** 1.03 ** AnguillaLatin America and the Caribbean... ... ... ... ... ... ... ... Antigua and Barbuda14.4 ** 13.8 ** 15.1 ** 1.10 ** 15.6 -1 14.6 -1 16.6 -1 1.14 -1 Argentina195
T a b l e12 SCHOOL LIFE EXPECTANCYRegionSchool life expectancy (approximation method) in yearsCountry or territoryPre-primary (ISCED 0) Primary and secondary (ISCED 1-3) Tertiary (ISCED 5-6)2008 2008 2008MF M F MF M F GPI MF M F GPI1 2 3 4 5 6 7 8 9 10 11Aruba 2.1 2.1 2.1 11.6 11.6 11.6 1.00 1.6 1.4 1.9 1.36Bahamas ... ... ... 11.8 11.8 11.9 1.01 ... ... ... ...Barbados ... ... ... ... ... ... ... ... ... ... ...Belize 0.8 0.8 0.8 11.8 11.7 11.8 1.01 ... ... ... ...Bermuda ... ... ... 11.9 *, -2 12.2 *, -2 11.6 *, -2 0.95 *, -2 ... ... ... ...Bolivia 1.0 -1 1.0 -1 1.0 -1 11.5 -1 11.6 -1 11.4 -1 0.98 -1 1.9 **, -1 2.1 **, -1 1.7 **, -1 **, -10.84Brazil 2.0 2.0 2.0 12.2 12.0 12.3 1.02 1.8 1.6 2.0 1.26British Virgin Islands 1.8 *, -2 1.8 *, -2 1.9 *, -2 12.6 **, -1 12.5 **, -1 12.6 **, -1 1.01 **, -1 ... ... ... ...Cayman Islands 2.1 * 2.0 * 2.1 * 10.9 * 11.4 * 10.5 * 0.92 * 1.5 * 1.0 * 2.0 * 1.94 *Chile 1.7 -1 1.6 -1 1.7 -1 11.8 -1 11.9 -1 11.7 -1 0.98 -1 2.8 -1 2.8 -1 2.8 -1 0.99 -1Colombia 1.5 1.5 1.5 11.5 11.3 11.8 1.04 1.8 ** 1.8 ** 1.8 ** 0.99 **Costa Rica 1.4 1.4 1.4 11.0 10.8 11.1 1.02 ... ... ... ...Cuba 3.2 +1 3.2 +1 3.2 +1 11.6 +1 11.6 +1 11.5 +1 0.99 +1 6.0 **, +1 4.5 **, +1 7.6 **, +1 **, +11.69Dominica 1.5 ** 1.6 ** 1.5 ** 11.0 * 11.1 * 11.1 * 1.00 ** 0.2 ** 0.1 ** 0.3 ** 3.26 **Dominican Republic 1.0 1.0 1.1 10.8 10.7 11.0 1.03 ... ... ... ...Ecuador 1.0 -1 1.0 -1 1.0 -1 11.7 ** 11.7 ** 11.8 ** 1.00 ** 2.4 2.3 2.6 1.13El Salvador 1.8 1.7 1.8 10.8 10.9 10.7 0.98 1.3 1.3 1.3 1.03Grenada 2.1 2.0 2.1 12.5 12.9 12.1 0.94 ... ... ... ...Guatemala 1.2 1.2 1.2 9.8 10.1 9.5 0.93 ... ... ... ...Guyana 1.7 1.7 1.7 11.6 11.6 11.6 1.00 0.6 0.5 ** 0.7 ** 1.44 **Haiti ... ... ... ... ... ... ... ... ... ... ...Honduras 1.2 1.2 1.2 10.3 9.9 10.7 1.08 1.1 * 0.9 * 1.3 * 1.48 *Jamaica 2.6 2.5 2.6 10.3 10.3 10.3 1.00 1.2 ** 0.8 ** 1.7 ** 2.22 **Mexico 2.3 2.3 2.3 12.4 12.2 12.5 1.02 1.4 1.4 1.4 0.97Montserrat 1.9 *, -1 2.2 *, -1 1.7 *, -1 12.8 *, -1 12.4 *, -1 13.4 *, -1 1.08 *, -1 . *, -1 . *, -1 . *, -1 *, -1.Netherlands Antilles ... ... ... ... ... ... ... ... ... ... ...Nicaragua 1.7 1.7 1.7 10.5 10.4 10.6 1.02 ... ... ... ...Panama 1.4 1.4 1.4 11.0 10.9 11.0 1.01 ... ... ... ...Paraguay 1.1 -1 1.1 -1 1.1 -1 10.3 -1 10.4 -1 10.3 -1 0.99 -1 1.4 **, -1 1.2 **, -1 1.6 **, -1 **, -11.35Peru 2.2 2.1 2.2 11.0 11.1 11.0 0.99 ... ... ... ...Saint Kitts and Nevis ... ... ... ... ... ... ... ... ... ... ...Saint Lucia 1.4 1.4 1.4 11.5 11.5 11.5 1.00 0.8 ** 0.5 ** 1.1 ** 2.13 **Saint Vincent and the Grenadines ... ... ... 13.1 13.1 13.0 1.00 ... ... ... ...Suriname 1.6 1.6 1.6 12.2 11.8 12.7 1.08 ... ... ... ...Trinidad and Tobago 1.6 * 1.6 * 1.6 * 11.6 ** 11.5 ** 11.6 ** 1.01 ** ... ... ... ...Turks and Caicos Islands ... ... ... ... ... ... ... - ** - ** - ** .Uruguay 2.4 -1 2.4 -1 2.4 -1 12.4 -1 12.5 -1 12.3 -1 0.98 -1 3.3 -1 2.4 -1 4.2 -1 1.72 -1Venezuela 2.1 2.1 2.1 10.3 10.1 10.4 1.02 3.9 ** 2.9 ** 5.0 ** 1.69 **North America and Western EuropeAndorra 2.9 * 2.9 * 2.9 * 10.2 * 10.0 * 10.3 * 1.03 * 0.4 * 0.3 * 0.4 * 1.43 *Austria 2.8 2.8 2.8 11.9 12.0 11.7 0.97 2.6 2.4 2.8 1.18Belgium 3.6 3.7 3.6 12.7 ** 12.8 ** 12.5 ** 0.98 ** 3.1 2.7 3.4 1.26Canada 1.4 **, -2 1.4 **, -2 1.4 **, -2 12.0 -2 12.1 -2 11.9 -2 0.99 -2 ... ... ... ...Cyprus 2.5 * 2.5 * 2.5 * 12.1 * 12.1 * 12.1 * 1.00 * 2.1 * 2.1 * 2.1 * 1.00 *Denmark 3.8 -1 3.8 -1 3.8 -1 13.3 -1 13.2 -1 13.4 -1 1.01 -1 3.6 -1 3.0 -1 4.2 -1 1.39 -1Finland 2.6 2.6 2.6 12.4 12.3 12.6 1.02 4.6 4.2 5.1 1.23196
G l o b a l e d u c a t i o n d i g e s t 2 0 1 0 C o m p a r i n g e d u c a t i o n s t a t i s t i c s a r o u n d t h e w o r l dSchool life expectancy (approximation method) in yearsRegionPrimary to tertiary (ISCED 1-6)1999 2008MF M F GPI MF M F GPI12 13 14 15 16 17 18 1913.6 ** 13.5 ** 13.7 ** 1.02 ** 13.2 13.0 13.5 1.04 Aruba... ... ... ... ... ... ... ... Bahamas... ... ... ... ... ... ... ... Barbados... ... ... ... ... ... ... ... Belize... ... ... ... ... ... ... ... Bermuda13.5 ** ... ... ... 13.7 **, -1 13.9 **, -1 13.5 **, -1 0.97 **, -1 Bolivia14.1 ** 13.9 ** 14.4 ** 1.04 ** 14.0 13.6 14.3 1.05 BrazilCountry or territory15.9 ** 15.0 ** 16.8 ** 1.12 ** ... ... ... ... British Virgin Islands13.2 **, +1 12.8 **, +1 13.6 **, +1 1.06 **, +1 12.6 * 12.6 * 12.7 * 1.01 * Cayman Islands12.8 ** 12.9 ** 12.7 ** 0.99 ** 14.5 -1 14.6 -1 14.4 -1 0.99 -1 Chile11.6 ** 11.3 ** 11.8 ** 1.05 ** 13.3 ** 13.1 ** 13.5 ** 1.04 ** Colombia10.1 **, -1 9.9 **, -1 10.3 **, -1 1.04 **, -1 ... ... ... ... Costa Rica12.4 ** 12.2 ** 12.6 ** 1.03 ** 17.6 **, +1 16.1 **, +1 19.1 **, +1 1.19 **, +1 Cuba12.3 ** 11.7 ** 13.0 ** 1.11 ** 12.5 ** 12.0 ** 13.2 ** 1.10 ** Dominica... ... ... ... ... ... ... ... Dominican Republic... ... ... ... 14.2 ** 14.0 ** 14.3 ** 1.02 ** Ecuador11.3 ** 11.6 ** 11.0 ** 0.95 ** 12.1 12.2 12.0 0.98 El Salvador... ... ... ... ... ... ... ... Grenada... ... ... ... ... ... ... ... Guatemala... ... ... ... 12.2 ** 12.1 ** 12.4 ** 1.02 ** Guyana... ... ... ... ... ... ... ... Haiti... ... ... ... 11.4 * 10.8 * 12.0 * 1.11 * Honduras11.6 **, +1 11.4 **, +1 11.8 **, +1 1.04 **, +1 13.8 ** 13.1 ** 14.4 ** 1.10 ** Jamaica11.9 ** 11.9 ** 11.8 ** 0.99 ** 13.7 13.7 13.8 1.01 Mexico... ... ... ... 15.1 **, -1 13.8 **, -1 16.9 **, -1 1.23 **, -1 Montserrat14.6 ** 14.3 ** 14.9 ** 1.04 ** ... ... ... ... Netherlands Antilles... ... ... ... ... ... ... ... Nicaragua12.6 ** 12.1 ** 13.1 ** 1.08 ** ... ... ... ... Panama11.5 ** 11.5 ** 11.5 ** 1.00 ** 11.7 **, -1 11.6 **, -1 11.9 **, -1 1.03 **, -1 Paraguay... ... ... ... ... ... ... ... Peru14.2 **, +1 13.5 **, +1 14.8 **, +1 1.10 **, +1 ... ... ... ... Saint Kitts and Nevis... ... ... ... 13.0 ** 12.5 ** 13.4 ** 1.08 ** Saint Lucia12.7 **, +1 12.3 **, +1 13.2 **, +1 1.08 **, +1 ... ... ... ... Saint Vincent and the Grenadines... ... ... ... ... ... ... ... Suriname11.5 ** 11.3 ** 11.7 ** 1.04 ** ... ... ... ... Trinidad and Tobago... ... ... ... ... ... ... ... Turks and Caicos Islands13.9 ** 13.0 ** 14.7 ** 1.13 ** 15.7 -1 15.0 -1 16.5 -1 1.10 -1 Uruguay10.5 **, +1 10.0 **, +1 11.0 **, +1 1.09 **, +1 14.2 ** 13.1 ** 15.3 ** 1.17 ** Venezuela... ... ... ... 11.5 ** 10.8 ** 12.1 ** 1.12 ** Andorra15.2 ** 15.3 ** 15.1 ** 0.99 ** 15.2 15.0 15.4 1.02 Austria18.0 ** 17.6 ** 18.5 ** 1.05 ** 16.0 ** 15.7 ** 16.3 ** 1.04 ** Belgium16.1 **, -1 15.7 **, -1 16.4 **, -1 1.04 **, -1 ... ... ... ... Canada12.5 * 12.4 * 12.7 * 1.03 * 14.2 * 14.2 * 14.2 * 1.00 * Cyprus16.1 ** 15.6 ** 16.6 ** 1.07 ** 16.9 -1 16.2 -1 17.5 -1 1.08 -1 Denmark17.2 16.5 17.9 1.08 17.1 16.5 17.7 1.08 FinlandNorth America and Western Europe197
T a b l e12 SCHOOL LIFE EXPECTANCYRegionSchool life expectancy (approximation method) in yearsCountry or territoryPre-primary (ISCED 0) Primary and secondary (ISCED 1-3) Tertiary (ISCED 5-6)2008 2008 2008MF M F MF M F GPI MF M F GPI1 2 3 4 5 6 7 8 9 10 11France 3.3 3.3 3.3 13.4 13.4 13.3 1.00 2.7 2.4 3.1 1.27Germany 3.3 3.3 3.2 13.2 13.3 13.1 0.98 ... ... ... ...Gibraltar ... ... ... ... ... ... ... . . . .Greece 1.4 -1 1.4 -1 1.4 -1 12.1 -1 12.2 -1 12.0 -1 0.98 -1 4.1 -1 3.9 -1 4.4 -1 1.13 -1Holy See . . . . . . . … … … …Iceland 2.9 2.9 2.9 14.6 14.4 14.7 1.02 3.7 2.6 5.0 1.92Ireland ... ... ... 14.1 14.0 14.3 1.03 2.8 2.5 3.0 1.22Israel 2.9 2.9 2.9 12.1 12.1 12.2 1.01 3.2 2.8 3.6 1.29Italy 3.0 -1 3.1 -1 3.0 -1 13.2 -1 13.2 -1 13.1 -1 0.99 -1 3.1 -1 2.5 -1 3.6 -1 1.42 -1Liechtenstein 2.0 * 1.9 * 2.0 * 12.8 * 13.3 * 12.3 * 0.92 * 1.7 * 2.3 * 1.2 * 0.51 *Luxembourg 2.6 2.7 2.6 12.8 12.6 12.9 1.02 ... ... ... ...Malta 2.0 -1 2.0 -1 2.0 -1 12.7 -1 12.6 -1 12.7 -1 1.01 -1 1.7 -1 1.4 -1 2.0 -1 1.42 -1Monaco 3.3 *, +1 3.5 *, +1 3.2 *, +1 17.2 *, +1 17.3 *, +1 17.1 *, +1 0.99 *, +1 ... ... ... ...Netherlands 2.0 2.0 2.0 13.7 13.8 13.5 0.98 3.0 2.9 3.1 1.09Norway 2.8 2.8 2.9 13.7 13.8 13.6 0.99 3.5 2.7 4.3 1.58Portugal 2.4 -1 2.4 -1 2.4 -1 12.9 -1 12.9 -1 12.9 -1 1.01 -1 2.6 -1 2.3 -1 2.8 -1 1.24 -1San Marino ... ... ... ... ... ... ... ... ... ... ...Spain 3.7 3.7 3.7 13.3 13.2 13.4 1.02 3.0 2.7 3.4 1.26Sweden 4.1 4.1 4.1 11.9 12.0 11.9 0.99 3.5 2.7 4.3 1.56Switzerland 2.1 2.1 2.0 12.9 13.1 12.8 0.97 2.4 2.4 2.3 0.99United Kingdom 1.6 1.6 1.6 13.3 13.2 13.4 1.01 2.8 2.4 3.3 1.36United States of America 1.7 1.7 1.7 11.6 11.6 11.6 1.00 4.2 3.5 4.9 1.38South and West AsiaAfghanistan ... ... ... 8.2 -1 10.3 -1 5.9 -1 0.57 -1 ... ... ... ...Bangladesh ... ... ... 7.8 -1 7.5 -1 8.0 -1 1.06 -1 0.4 -1 0.4 -1 0.2 -1 0.55 -1Bhutan - ** - ** - ** 11.3 +1 11.2 +1 11.3 +1 1.01 +1 ... ... ... ...India 1.4 **, -1 1.4 **, -1 1.4 **, -1 9.6 **, -1 10.0 **, -1 9.2 **, -1 0.92 **, -1 0.7 **, -1 0.8 **, -1 0.6 **, -1 **, -10.70Iran (Islamic Republic of) 0.5 ** 0.5 ** 0.5 ** 12.2 11.2 ** 13.2 ** 1.18 ** 1.8 ** 1.7 ** 1.9 ** 1.14 **Maldives 3.0 3.0 3.0 12.4 **, -2 12.5 **, -2 12.2 **, -2 0.98 **, -2 - **, -2 - **, -2 - **, -2 **, -2-Nepal 1.3 **, +2 1.4 **, +2 1.3 **, +2 ... ... ... ... ... ... ... ...Pakistan ... ... ... 6.5 7.2 5.8 0.80 0.3 ** 0.3 ** 0.2 ** 0.85 **Sri Lanka ... ... ... ... ... ... ... ... ... ... ...Sub-Saharan AfricaAngola 1.2 ** 1.3 ** 1.1 ** ... ... ... ... ... ... ... ...Benin 0.3 ** 0.3 ** 0.3 ** ... ... ... ... ... ... ... ...Botswana 0.5 -2 0.5 -2 0.5 -2 11.7 -2 11.6 -2 11.7 -2 1.00 -2 0.4 **, -2 0.4 **, -2 0.4 **, -2 **, -21.15Burkina Faso 0.1 +1 0.1 +1 0.1 +1 6.1 +1 6.6 +1 5.6 +1 0.85 +1 0.2 +1 0.3 +1 0.1 +1 0.48 +1Burundi 0.1 **, -1 0.1 **, -1 0.1 **, -1 9.4 ** 9.9 ** 9.0 ** 0.91 ** 0.1 ** ... ... ...Cameroon 0.5 0.5 0.5 9.3 ** 10.1 ** 8.5 ** 0.84 ** 0.4 0.5 ** 0.3 ** 0.67 **Cape Verde 1.8 1.8 1.8 ... ... ... ... 0.6 ** 0.5 ** 0.7 ** 1.24 **Central African Republic 0.1 +1 0.1 +1 0.1 +1 6.4 +1 7.7 +1 5.2 +1 0.68 +1 0.1 **, +1 0.2 **, +1 0.1 **, +1 **, +10.43Chad ... ... ... 6.1 -1 7.5 -1 4.7 -1 0.62 -1 ... ... ... ...Comoros 0.8 ** 0.8 ** 0.8 ** ... ... ... ... ... ... ... ...Congo 0.4 0.4 0.4 ... ... ... ... ... ... ... ...Côte d’Ivoire 0.1 ** 0.1 ** 0.1 ** ... ... ... ... ... ... ... ...Democratic Republic of the Congo 0.1 ** 0.1 ** 0.1 ** 7.5 ** 8.6 ** 6.4 ** 0.75 ** 0.3 ** ... ... ...198
G l o b a l e d u c a t i o n d i g e s t 2 0 1 0 C o m p a r i n g e d u c a t i o n s t a t i s t i c s a r o u n d t h e w o r l dSchool life expectancy (approximation method) in yearsRegionPrimary to tertiary (ISCED 1-6)1999 2008MF M F GPI MF M F GPI12 13 14 15 16 17 18 1915.7 ** 15.4 ** 15.9 ** 1.03 ** 16.1 15.8 16.5 1.04 France... ... ... ... ... ... ... ... Germany... ... ... ... ... ... ... ... Gibraltar13.8 13.5 14.1 1.05 16.5 -1 16.4 -1 16.6 -1 1.02 -1 Greece. . . . . . . . Holy See16.7 16.1 17.3 1.08 18.3 17.1 19.7 1.15 Iceland16.5 ** 16.1 ** 16.9 ** 1.05 ** 17.9 17.7 18.1 1.02 Ireland15.0 ** 14.6 ** 15.4 ** 1.05 ** 15.4 14.9 15.9 1.06 Israel14.9 ** 14.6 ** 15.2 ** 1.04 ** 16.3 -1 15.8 -1 16.8 -1 1.06 -1 ItalyCountry or territory... ... ... ... 14.8 * 16.0 * 13.6 * 0.85 * Liechtenstein13.6 ** 13.5 ** 13.7 ** 1.01 ** ... ... ... ... Luxembourg13.9 +1 13.8 +1 13.9 +1 1.01 +1 14.4 -1 14.0 -1 14.8 -1 1.05 -1 Malta... ... ... ... ... ... ... ... Monaco16.4 ** 16.7 ** 16.1 ** 0.97 ** 16.7 16.7 16.7 1.00 Netherlands17.2 16.7 17.7 1.06 17.3 16.7 18.0 1.08 Norway15.6 ** 15.3 ** 16.0 ** 1.05 ** 15.5 -1 15.2 -1 15.8 -1 1.04 -1 Portugal... ... ... ... ... ... ... ... San Marino15.8 15.5 16.2 1.05 16.4 15.9 16.9 1.06 Spain18.9 ** 17.3 ** 20.5 ** 1.18 ** 15.6 14.9 ** 16.3 1.10 ** Sweden15.0 ** 15.4 ** 14.5 ** 0.94 ** 15.5 15.6 15.3 0.98 Switzerland15.9 15.7 16.1 1.02 16.1 15.6 16.6 1.07 United Kingdom15.5 ** ... ... ... 15.9 ** 15.1 ** 16.6 ** 1.10 ** United States of AmericaSouth and West Asia... ... ... ... ... ... ... ... Afghanistan... ... ... ... 8.1 -1 8.0 -1 8.3 -1 1.03 -1 Bangladesh7.3 ** 8.0 ** 6.6 ** 0.82 ** ... ... ... ... Bhutan8.4 **, +1 9.4 **, +1 7.3 **, +1 0.78 **, +1 10.3 **, -1 10.8 **, -1 9.8 **, -1 0.90 **, -1 India12.1 ** 12.9 ** 11.4 ** 0.89 ** 14.0 ** 12.9 ** 15.2 ** 1.17 ** Iran (Islamic Republic of)11.9 ** 11.8 ** 11.9 ** 1.01 ** 12.4 **, -2 12.5 **, -2 12.3 **, -2 0.98 **, -2 Maldives8.8 **, +1 9.9 **, +1 7.5 **, +1 0.76 **, +1 ... ... ... ... Nepal... ... ... ... 6.8 ** 7.5 ** 6.0 ** 0.80 ** Pakistan... ... ... ... ... ... ... ... Sri Lanka4.4 **, -1 4.8 **, -1 3.9 **, -1 0.81 **, -1 ... ... ... ... Angola7.1 ** 8.9 ** 5.4 ** 0.60 ** ... ... ... ... Benin11.7 ** 11.7 ** 11.8 ** 1.01 ** 12.4 **, -2 12.3 **, -2 12.4 **, -2 1.01 **, -2 BotswanaSub-Saharan Africa3.4 ** 4.1 ** 2.7 ** 0.68 ** 6.3 +1 6.8 +1 5.7 +1 0.84 +1 Burkina Faso... ... ... ... 9.6 ** ... ... ... Burundi7.2 ** ... ... ... 9.8 ** 10.6 ** 8.9 ** 0.83 ** Cameroon... ... ... ... ... ... ... ... Cape Verde... ... ... ... 6.6 **, +1 7.8 **, +1 5.3 **, +1 0.67 **, +1 Central African Republic4.9 **, +1 6.4 **, +1 3.4 **, +1 0.53 **, +1 ... ... ... ... Chad8.2 ** 8.9 ** 7.4 ** 0.84 ** ... ... ... ... Comoros8.3 **, +1 9.1 **, +1 7.5 **, +1 0.82 **, +1 ... ... ... ... Congo6.4 ** 7.7 ** 5.1 ** 0.66 ** ... ... ... ... Côte d’Ivoire4.3 ** ... ... ... 7.8 ** ... ... ... Democratic Republic of the Congo199
T a b l e12 SCHOOL LIFE EXPECTANCYRegionSchool life expectancy (approximation method) in yearsCountry or territoryPre-primary (ISCED 0) Primary and secondary (ISCED 1-3) Tertiary (ISCED 5-6)2008 2008 2008MF M F MF M F GPI MF M F GPI1 2 3 4 5 6 7 8 9 10 11Equatorial Guinea 2.2 **, -1 1.9 **, -1 2.5 **, -1 ... ... ... ... ... ... ... ...Eritrea 0.3 0.3 0.3 4.8 ** 5.4 ** 4.2 ** 0.77 ** ... ... ... ...Ethiopia 0.1 0.1 0.1 8.1 8.8 7.4 0.84 0.2 ** 0.3 ** 0.1 ** 0.31 **Gabon ... ... ... ... ... ... ... ... ... ... ...Gambia 0.9 -1 0.9 -1 0.9 -1 8.4 8.3 8.4 1.01 ... ... ... ...Ghana 2.1 2.0 2.1 9.9 10.1 9.6 0.95 ... ... ... ...Guinea 0.3 * 0.3 * 0.3 * 8.1 9.2 7.0 0.75 0.5 0.7 0.2 0.33Guinea-Bissau ... ... ... 9.0 **, -2 ... ... ... 0.1 **, -2 ... ... ...Kenya 1.5 1.5 1.5 10.5 10.8 10.3 0.95 ... ... ... ...Lesotho ... ... ... 9.7 **, -1 9.5 **, -1 9.9 **, -1 1.04 **, -1 ... ... ... ...Liberia 2.7 2.8 2.7 8.3 9.0 7.6 0.85 ... ... ... ...Madagascar 0.3 0.3 0.3 10.0 10.2 9.8 0.96 0.2 0.2 0.2 0.85Malawi ... ... ... 9.3 9.4 9.2 0.98 ... ... ... ...Mali 0.2 +1 0.2 +1 0.2 +1 7.9 +1 8.9 +1 6.9 +1 0.78 +1 0.3 +1 0.5 +1 0.2 +1 0.39 +1Mauritius 2.0 +1 1.9 +1 2.0 +1 12.1 **, +1 12.0 **, +1 12.2 **, +1 1.01 **, +1 ... 0.7 ... ...Mozambique ... ... ... 9.7 10.5 8.9 0.85 ... ... ... ...Namibia 0.6 **, -2 0.6 **, -2 0.6 **, -2 11.2 11.0 11.4 1.03 0.5 0.5 0.6 1.33Niger 0.1 +1 0.1 +1 0.1 +1 4.5 +1 5.1 +1 3.9 +1 0.75 +1 0.1 **, +1 0.1 **, +1 - **, +1 **, +10.34Nigeria 0.5 **, -1 0.5 **, -1 0.5 **, -1 7.7 -1 8.3 -1 7.0 -1 0.84 -1 ... ... ... ...Rwanda ... ... ... 10.4 ** 10.4 ** 10.4 ** 1.00 ** 0.2 ** ... ... ...Sao Tome and Principe 1.5 +1 1.5 +1 1.6 +1 10.6 +1 10.5 +1 10.8 +1 1.03 +1 0.2 **, +1 0.2 **, +1 0.2 **, +1 **, +10.93Senegal 0.3 0.3 0.3 7.1 7.3 6.9 0.95 0.4 ** 0.5 ** 0.3 ** 0.54 **Seychelles 2.1 * 2.1 * 2.1 * 13.3 * 12.9 * 13.7 * 1.06 * . * . * . * . *Sierra Leone 0.1 -1 0.1 -1 0.2 -1 11.7 -1 12.8 -1 10.7 -1 0.83 -1 ... ... ... ...Somalia ... ... ... 2.5 **, -1 3.3 **, -1 1.8 **, -1 0.53 **, -1 ... ... ... ...South Africa 0.5 **, -1 0.5 **, -1 0.5 **, -1 12.1 **, -1 12.1 **, -1 12.0 **, -1 1.00 **, -1 ... ... ... ...Swaziland ... ... ... 10.3 -1 10.7 -1 9.9 -1 0.92 -1 ... ... ... ...Togo 0.2 +1 0.2 +1 0.2 +1 9.3 -1 10.7 **, -1 7.9 **, -1 0.74 **, -1 0.3 **, -1 ... ... ...Uganda 0.4 0.4 0.4 10.2 10.3 10.1 0.98 0.2 ** 0.2 ** 0.2 ** 0.80 **United Republic of Tanzania 0.7 0.7 0.7 ... ... ... ... ... ... ... ...Zambia ... ... ... 11.0 11.3 10.6 0.94 ... ... ... ...Zimbabwe ... ... ... 9.7 -2 9.8 -2 9.6 -2 0.97 -2 ... ... ... ...REGIONAL AVERAGESWORLD 1.2 ** 1.2 ** 1.2 ** 9.8 ** 10.0 ** 9.6 ** 0.95 ** 1.3 ** 1.2 ** 1.3 ** 1.07 **Arab States 0.4 ** 0.4 ** 0.4 ** 9.4 ** 9.9 ** 8.9 ** 0.90 ** 1.1 ** 1.1 # 1.0 # 0.97 #Central and Eastern Europe 2.4 2.4 2.3 10.5 10.6 10.3 0.97 3.2 2.8 3.6 1.26Central Asia 1.1 1.1 1.1 10.8 10.9 10.7 0.98 1.3 1.3 1.4 1.07East Asia and the Pacific 1.2 1.2 # 1.2 # 10.5 10.4 # 10.6 # 1.02 # 1.3 1.3 1.3 1.01Latin America and the Caribbean 1.9 1.9 1.9 11.7 11.6 11.8 1.02 2.0 ** 1.7 ** 2.2 ** 1.24 **North America and Western Europe 2.3 2.3 2.3 12.4 12.4 12.4 1.00 3.5 3.0 4.0 1.31South and West Asia 1.2 # 1.2 # 1.2 # 9.1 # 9.5 # 8.7 # 0.92 # 0.6 # 0.7 # 0.5 # 0.75 #Sub-Saharan Africa 0.5 ** 0.5 ** 0.5 ** 8.2 ** 8.7 ** 7.6 ** 0.87 ** 0.3 ** 0.4 # 0.2 # 0.65 #Please refer to the Reader’s Guide for more information on the data and symbols used in each table.200
G l o b a l e d u c a t i o n d i g e s t 2 0 1 0 C o m p a r i n g e d u c a t i o n s t a t i s t i c s a r o u n d t h e w o r l dSchool life expectancy (approximation method) in yearsRegionPrimary to tertiary (ISCED 1-6)1999 2008MF M F GPI MF M F GPI12 13 14 15 16 17 18 19Country or territory8.1 **, +1 9.1 **, +1 7.0 **, +1 0.77 **, +1 ... ... ... ... Equatorial Guinea4.1 ** 4.6 ** 3.5 ** 0.76 ** ... ... ... ... Eritrea4.1 ** 5.1 ** 3.1 ** 0.60 ** 8.3 ** 9.0 ** 7.5 ** 0.82 ** Ethiopia12.7 ** 13.1 ** 12.3 ** 0.94 ** ... ... ... ... Gabon7.7 ** 8.6 ** 6.7 ** 0.78 ** ... ... ... ... Gambia... ... ... ... ... ... ... ... Ghana... ... ... ... 8.6 10.0 7.2 0.72 Guinea6.1 **, +1 7.5 **, +1 4.8 **, +1 0.64 **, +1 9.1 **, -2 ... ... ... Guinea-Bissau8.3 **, +1 8.5 **, +1 8.2 **, +1 0.96 **, +1 ... ... ... ... Kenya9.1 ** 8.7 ** 9.6 ** 1.11 ** ... ... ... ... Lesotho9.2 ** 11.1 ** 7.4 ** 0.67 ** ... ... ... ... Liberia... ... ... ... 10.2 ** 10.4 ** 10.0 ** 0.96 ** Madagascar10.9 ** 11.5 ** 10.2 ** 0.89 ** ... ... ... ... Malawi4.5 ** 5.4 ** 3.5 ** 0.65 ** 8.3 +1 9.4 +1 7.1 +1 0.76 +1 Mali12.2 ** 12.3 ** 12.1 ** 0.98 ** 13.6 ** 13.4 ** 13.9 ** 1.04 ** Mauritius5.4 ** ... ... ... ... ... ... ... Mozambique12.0 **, -1 11.8 **, -1 12.1 **, -1 1.02 **, -1 11.8 ** 11.6 12.1 1.04 Namibia... ... ... ... 4.6 **, +1 5.3 **, +1 3.9 **, +1 0.75 **, +1 Niger7.5 ** 8.3 ** 6.6 ** 0.81 ** ... ... ... ... Nigeria6.8 ** ... ... ... 10.6 ** ... ... ... Rwanda... ... ... ... 10.8 **, +1 10.7 **, +1 11.0 **, +1 1.03 **, +1 Sao Tome and Principe5.3 ** ... ... ... 7.5 ** 7.8 ** 7.2 ** 0.92 ** Senegal14.0 * 13.9 * 14.2 * 1.02 * 15.0 ** 14.3 * 15.8 * 1.10 * Seychelles... ... ... ... ... ... ... ... Sierra Leone... ... ... ... ... ... ... ... Somalia... ... ... ... ... ... ... ... South Africa9.4 ** 9.7 ** 9.1 ** 0.94 ** ... ... ... ... Swaziland... ... ... ... 9.6 **, -1 ... ... ... Togo10.2 ** 10.8 ** 9.6 ** 0.88 ** 10.4 ** 10.6 ** 10.3 ** 0.98 ** Uganda5.3 ** 5.4 ** 5.3 ** 0.97 ** ... ... ... ... United Republic of Tanzania7.1 ** 7.5 ** 6.6 ** 0.88 ** ... ... ... ... Zambia9.8 ** ... ... ... ... ... ... ... ZimbabweREGIONAL AVERAGES9.7 ** 10.2 # 9.2 # 0.91 # 11.0 ** 11.2 ** 10.7 ** 0.96 ** WORLD9.4 ** 9.8 ** 8.3 ** 0.84 ** 10.1 # 10.6 # 9.4 # 0.89 # Arab States12.1 ** 12.2 ** 12.0 ** 0.98 ** 13.6 13.5 13.7 1.02 Central and Eastern Europe11.0 11.1 10.9 0.99 12.4 12.5 12.4 0.99 Central Asia10.3 # 10.4 # 10.1 # 0.97 # 11.8 # 11.7 # 11.9 # 1.02 # East Asia and the Pacific12.5 12.3 ** 12.6 ** 1.02 ** 13.6 # 13.3 # 13.9 # 1.05 # Latin America and the Caribbean15.7 15.3 ** 16.0 ** 1.05 ** 16.0 15.5 16.5 1.06 North America and Western Europe7.9 # 9.0 # 6.8 # 0.76 # 9.7 # 10.2 # 9.2 # 0.90 # South and West Asia6.8 ** 7.6 ** 6.2 ** 0.82 ** 8.4 # 9.0 # 7.6 # 0.85 # Sub-Saharan Africa201
PUBLIC EXPENDITURE ON EDUCATION AND EXPENDITURE ON EDUCATIONT a b l e13 BY NATURE OF SPENDING / Financial year ending in 2008RegionTotal public expenditure per studentTotal public expenditureon educationCountry or territoryArab Statesas a % of GDP per capitain U.S. dollars PPPPrimary(ISCED 1)Secondary(ISCED 2-3)Tertiary(ISCED 5-6)Primary(ISCED 1)Secondary(ISCED 2-3)Tertiary(ISCED 5-6) as a % of GDPas a % of totalgovernmentexpenditure1 2 3 4 5 6 7 8Algeria ... ... ... ... ... ... 4.3 20.3Bahrain ... ... ... ... ... ... 2.9 11.7Djibouti 24.4 -1 ... ... 500 -1 ... ... 8.7 -1 22.8 -1Egypt ... ... ... ... ... ... 3.8 11.9Iraq ... ... ... ... ... ... ... ...Jordan 13.1 -1 16.9 -1 ... 664 -1 853 -1 ... ... ...Kuwait 12.0 16.3 ... … … ... 3.8 **, -2 **, -212.9Lebanon ... ... 12.5 ... ... 1,444 2.0 8.1Libyan Arab Jamahiriya ... ... ... ... ... ... ... ...Mauritania 12.8 ... ... … ... ... 4.4 ** 15.6 **Morocco 16.3 ... 72.1 717 ... 3,166 5.7 25.7Oman ... ... ... ... ... ... 4.0 -2 31.1 -2Palestinian Autonomous Territories ... ... ... ... ... ... ... ...Qatar ... ... ... ... ... ... ... ...Saudi Arabia 18.8 -1 18.7 -1 ... 4,212 -1 4,198 -1 ... 5.7 19.3Sudan ... ... ... ... ... ... ... ...Syrian Arab Republic 18.4 -1 14.0 -1 ... 789 -1 599 -1 ... 4.9 -1 16.7 -1Tunisia ... ... 55.4 -1 ... ... 4,166 -1 7.2 -1 22.4 -1United Arab Emirates 4.9 -2 6.9 -2 ... 2,626 -2 3,673 -2 ... 0.9 27.2Yemen ... ... ... ... ... ... 5.2 16.0Central and Eastern EuropeAlbania ... ... ... ... ... ... ... ...Belarus ... ... 18.1 -1 ... ... 1,974 -1 5.2 -1 9.3 -1Bosnia and Herzegovina ... ... ... ... ... ... ... ...Bulgaria 23.5 -1 22.3 -1 20.1 -1 2,639 -1 2,499 -1 2,257 -1 4.1 -1 10.0 -1Croatia ... ... ... ... ... ... ... ...Czech Republic 13.6 -2 23.1 -2 37.4 -2 2,978 -2 5,076 -2 8,206 -2 4.6 -2 10.5 -2Estonia 20.4 -1 24.4 -1 21.3 -1 4,161 -1 4,972 -1 4,333 -1 5.0 -1 13.9 -1Hungary 25.6 -2 23.2 -2 23.8 -2 4,609 -2 4,183 -2 4,290 -2 5.4 -2 10.4 -2Latvia 23.3 -1 24.1 -1 16.3 -1 4,039 -1 4,188 -1 2,835 -1 5.0 -1 13.9 -1Lithuania 15.9 -1 20.3 -1 17.2 -1 2,835 -1 3,611 -1 3,071 -1 4.7 -1 13.4 -1Montenegro ... ... ... ... ... ... ... ...Poland 24.4 -1 22.0 -1 16.6 -1 3,920 -1 3,541 -1 2,671 -1 4.9 -1 11.7 -1Republic of Moldova 34.3 32.4 38.9 1,003 948 1,138 8.2 19.8Romania … … … … … … … …Russian Federation ... ... 13.2 -2 ... ... 1,740 -2 3.9 -2 ...Serbia ... ... 36.4 -1 ... ... … 4.5 -1 8.9 -1Slovakia 15.6 -1 14.8 -1 19.5 -1 3,139 -1 2,963 -1 3,923 -1 3.6 -1 10.5 -1Slovenia ... ... 21.1 -1 ... ... … 5.2 -1 12.8 -2The former Yugoslav Rep. of Macedonia ... ... ... ... ... ... ... ...Turkey ... ... 28.1 -2 ... ... … 2.9 -2 ...Ukraine ... ... 25.1 -1 ... ... 1,743 -1 5.3 -1 20.2 -1Central AsiaArmenia ... ... ... ... ... ... 3.0 -1 15.0 -1Azerbaijan 5.2 **, -2 8.0 **, -2 8.9 -2 322 **, -2 494 **, -2 549 -2 1.9 9.1 +1Georgia 14.7 15.4 11.4 722 755 556 2.9 7.2202
G l o b a l e d u c a t i o n d i g e s t 2 0 1 0 C o m p a r i n g e d u c a t i o n s t a t i s t i c s a r o u n d t h e w o r l dEducational expenditure by nature of spending as a %of total educational expenditure in public institutionsRegionPrimary, secondary and post-secondary non-tertiary(ISCED 1-4)Tertiary(ISCED 5-6)Salaries,Salaries,all staff Other current Total current Capitalall staff Other current Total current Capital9 10 11 12 13 14 15 16Country or territoryArab States... ... ... ... ... ... ... ... Algeria... ... ... ... ... ... ... ... Bahrain... ... ... ... ... ... ... ... Djibouti... ... ... ... ... ... ... ... Egypt... ... ... ... ... ... ... ... Iraq80.9 -1 8.2 -1 89.1 -1 10.9 -1 ... ... ... ... Jordan84.7 10.2 94.9 5.1 ... ... ... ... Kuwait... ... ... ... 97.1 0.4 97.4 2.6 Lebanon... ... ... ... ... ... ... ... Libyan Arab Jamahiriya... ... ... ... ... ... ... ... Mauritania... ... ... ... 66.6 20.1 86.7 13.3 Morocco90.7 0.3 91.1 8.9 ... ... ... ... Oman... ... ... ... ... ... ... ... Palestinian Autonomous Territories... ... ... ... ... ... ... ... Qatar... ... ... ... ... ... ... ... Saudi Arabia... ... ... ... ... ... ... ... Sudan... ... ... ... ... ... ... ... Syrian Arab Republic... ... ... ... … ... 81.7 -1 18.3 -1 Tunisia75.6 -2 14.7 -2 90.3 -2 9.7 -2 ... ... ... ... United Arab Emirates... ... ... ... ... ... ... ... Yemen... ... ... ... ... ... ... ... Albania70.8 **, -2 23.9 **, -2 94.7 **, -2 5.3 **, -2 53.8 -1 37.5 -1 91.3 -1 8.7 -1 BelarusCentral and Eastern Europe... ... ... ... ... ... ... ... Bosnia and Herzegovina61.1 -1 22.5 -1 83.6 -1 16.4 -1 52.3 -1 21.6 -1 73.9 -1 26.1 -1 Bulgaria... ... ... ... ... ... ... ... Croatia55.6 -2 34.9 -2 90.5 -2 9.5 -2 38.7 -2 49.3 -2 88.0 -2 12.0 -2 Czech Republic... ... ... ... ... ... ... ... Estonia75.2 -2 18.8 -2 94.0 -2 6.0 -2 60.4 -2 28.1 -2 88.5 -2 11.5 -2 Hungary64.7 -1 19.4 -1 84.1 -1 15.9 -1 65.2 -1 25.9 -1 91.1 -1 8.9 -1 Latvia71.6 -1 17.8 -1 89.4 -1 10.6 -1 59.3 -1 23.7 -1 82.9 -1 17.1 -1 Lithuania... ... ... ... ... ... ... ... Montenegro66.4 -1 26.9 -1 93.4 -1 6.6 -1 59.6 -1 25.5 -1 85.0 -1 15.0 -1 Poland59.6 29.5 89.1 10.9 54.9 31.2 86.1 13.9 Republic of Moldova… … … … … … … … Romania... ... ... ... ... ... ... ... Russian Federation... ... ... ... 59.4 -1 34.9 -1 94.3 -1 5.7 -1 Serbia66.1 -1 30.6 -1 96.6 -1 3.4 -1 48.5 -1 44.9 -1 93.3 -1 6.7 -1 Slovakia... ... ... ... 60.4 -1 27.5 -1 87.9 -1 12.1 -1 Slovenia... ... ... ... ... ... ... ... The former Yugoslav Rep. of Macedonia... ... ... ... 57.0 -2 21.6 -2 78.6 -2 21.4 -2 Turkey... ... ... ... ... ... ... ... UkraineCentral Asia... ... ... ... ... ... ... ... Armenia73.5 **, -2 24.5 **, -2 98.0 **, -2 2.0 **, -2 56.7 +1 41.2 +1 97.8 +1 2.2 +1 Azerbaijan... ... ... ... ... ... ... ... Georgia203
PUBLIC EXPENDITURE ON EDUCATION AND EXPENDITURE ON EDUCATIONT a b l e13 BY NATURE OF SPENDING / Financial year ending in 2008RegionTotal public expenditure per studentTotal public expenditureon educationCountry or territoryas a % of GDP per capitain U.S. dollars PPPPrimary(ISCED 1)Secondary(ISCED 2-3)Tertiary(ISCED 5-6)Primary(ISCED 1)Secondary(ISCED 2-3)Tertiary(ISCED 5-6) as a % of GDPas a % of totalgovernmentexpenditure1 2 3 4 5 6 7 8Kazakhstan ... ... 7.9 -1 ... ... 858 -1 2.8 -1 ...Kyrgyzstan ... ... 22.8 -1 ... ... 458 -1 6.6 -1 25.6 -1Mongolia 14.7 -1 14.7 -1 ... 476 -1 475 -1 ... 5.1 -1 ...Tajikistan ... ... 21.8 ... ... 415 3.5 18.7Turkmenistan ... ... ... ... ... ... ... ...Uzbekistan ... ... ... ... ... ... ... ...East Asia and the PacificAustralia 17.1 -1 15.1 -1 21.0 -1 5,964 -1 5,278 -1 7,348 -1 4.7 -1 14.0 -2Brunei Darussalam ... ... ... ... ... ... ... ...Cambodia ... ... ... ... ... ... 1.6 -1 12.4 -1China ... ... ... ... ... ... ... ...Cook Islands ... ... ... ... ... ... ... ...Democratic People’s Republic of Korea ... ... ... ... ... ... ... ...Fiji ... ... ... ... ... ... ... ...Hong Kong SAR of China 12.7 15.6 ... 5,358 6,606 ... 3.3 23.0Indonesia 15.7 -1 13.9 -1 16.1 -1 578 -1 506 -1 696 -1 3.5 -1 18.7 -1Japan 21.6 -1 22.3 -1 20.1 -1 6,929 -1 7,152 -1 6,431 -1 3.4 -1 9.4 -1Kiribati ... ... ... ... ... ... ... ...Lao People’s Democratic Republic ... ... ... ... ... ... 2.3 12.2Macao, China ... ... 16.4 ... ... 9,718 2.2 14.0Malaysia 11.6 -1 14.2 -1 49.4 -1 1,563 -1 1,918 -1 6,673 -1 4.5 -1 18.2 -1Marshall Islands ... ... ... ... ... ... ... ...Micronesia (Federated States of) ... ... ... ... ... ... ... ...Myanmar ... ... ... ... ... ... ... ...*, -1Nauru ... ... ... ... ... ... ... 7.5New Zealand 17.6 -1 19.8 -1 29.2 -1 4,593 -1 5,100 -1 7,434 -1 6.2 -1 19.7 -2Niue ... ... ... ... ... ... ... ...Palau ... ... ... ... ... ... ... ...Papua New Guinea ... ... ... ... ... ... ... ...Philippines ... ... ... ... ... ... 2.6 -1 15.2 -1Republic of Korea 17.0 -1 22.2 -1 8.8 -1 4,565 -1 5,945 -1 2,355 -1 4.2 -1 14.7 -1Samoa ... ... ... ... ... ... 5.4 13.4Singapore 11.2 +1 16.6 +1 26.9 +1 ... ... 13,238 +1 3.2 +1 11.6 +1Solomon Islands ... ... ... ... ... ... ... ...Thailand 21.4 22.1 23.0 1,651 1,705 1,774 4.9 25.7Timor-Leste 27.6 -1 ... ... 200 -1 ... ... 7.1 7.3Tokelau ... ... ... ... ... ... ... ...Tonga ... ... ... ... ... ... ... ...Tuvalu ... ... ... ... ... ... ... ...Vanuatu 20.4 ... ... ... ... ... 6.9 28.1Viet Nam 19.7 17.3 61.7 548 481 1,717 5.3 19.8Latin America and the CaribbeanAnguilla ... ... ... ... ... ... ... ...Antigua and Barbuda ... ... ... ... ... ... ... ...Argentina 14.7 -1 21.9 -1 15.6 -1 1,945 -1 2,903 -1 2,071 -1 4.9 -1 13.5 -1Aruba 12.1 -1 17.5 -1 29.1 -1 … … … 4.9 -1 17.3 -1Bahamas ... ... ... ... ... ... ... ...204
G l o b a l e d u c a t i o n d i g e s t 2 0 1 0 C o m p a r i n g e d u c a t i o n s t a t i s t i c s a r o u n d t h e w o r l dEducational expenditure by nature of spending as a %of total educational expenditure in public institutionsRegionPrimary, secondary and post-secondary non-tertiary(ISCED 1-4)Tertiary(ISCED 5-6)Salaries,Salaries,all staff Other current Total current Capitalall staff Other current Total current Capital9 10 11 12 13 14 15 16Country or territory... ... ... ... 41.3 -1 43.3 -1 84.6 -1 15.4 -1 Kazakhstan... ... ... ... 65.7 -1 23.8 -1 89.5 -1 10.5 -1 Kyrgyzstan... ... ... ... ... ... ... ... Mongolia... ... ... ... ... ... ... ... Tajikistan... ... ... ... ... ... ... ... Turkmenistan... ... ... ... ... ... ... ... Uzbekistan70.8 -1 21.5 -1 92.3 -1 7.7 -1 53.9 -1 34.8 -1 88.7 -1 11.3 -1 AustraliaEast Asia and the Pacific... ... ... ... ... ... ... ... Brunei Darussalam... ... ... ... ... ... ... ... Cambodia... ... ... ... ... ... ... ... China... ... ... ... ... ... ... ... Cook Islands... ... ... ... ... ... ... ... Democratic People’s Republic of Korea... ... ... ... ... ... ... ... Fiji... ... 91.6 8.4 ... ... 76.8 23.2 Hong Kong SAR of China76.0 -1 7.7 -1 83.6 -1 16.4 -1 ... ... ... ... Indonesia79.7 -1 10.7 -1 90.5 -1 9.5 -1 50.7 -1 39.8 -1 90.5 -1 9.5 -1 Japan... ... ... ... ... ... ... ... Kiribati... ... ... ... ... ... ... ... Lao People’s Democratic Republic... ... ... ... ... ... ... ... Macao, China79.3 -1 15.0 -1 94.3 -1 5.7 -1 34.9 -1 23.4 -1 58.3 -1 41.7 -1 Malaysia... ... ... ... ... ... ... ... Marshall Islands... ... ... ... ... ... ... ... Micronesia (Federated States of)... ... ... ... ... ... ... ... Myanmar... ... ... ... ... ... ... ... Nauru... ... ... ... ... ... ... ... New Zealand... ... ... ... ... ... ... ... Niue... ... ... ... ... ... ... ... Palau... ... ... ... ... ... ... ... Papua New Guinea79.4 -1 13.8 -1 93.2 -1 6.8 -1 77.5 -1 17.2 -1 94.7 -1 5.3 -1 Philippines62.8 -1 26.5 -1 89.4 -1 10.6 -1 45.7 -1 38.4 -1 84.1 -1 15.9 -1 Republic of Korea... ... ... ... ... ... ... ... Samoa... ... 89.2 +1 10.8 +1 ... ... 95.4 +1 4.6 +1 Singapore... ... ... ... ... ... ... ... Solomon Islands... ... 97.6 2.4 ... ... 77.2 22.8 Thailand54.8 -1 11.6 -1 66.4 -1 33.6 -1 … ... 80.0 20.0 Timor-Leste... ... ... ... ... ... ... ... Tokelau... ... ... ... ... ... ... ... Tonga... ... ... ... ... ... ... ... Tuvalu87.3 11.3 98.6 1.4 - - - - Vanuatu... ... ... ... ... ... ... ... Viet Nam... ... ... ... ... ... ... ... AnguillaLatin America and the Caribbean... ... ... ... ... ... ... ... Antigua and Barbuda86.9 -1 9.3 -1 96.2 -1 3.8 -1 94.9 -1 4.2 -1 99.1 -1 0.9 -1 Argentina96.5 -1 3.5 -1 100.0 -1 - -1 93.3 -1 6.7 -1 100.0 -1 - -1 Aruba... ... ... ... ... ... ... ... Bahamas205
PUBLIC EXPENDITURE ON EDUCATION AND EXPENDITURE ON EDUCATIONT a b l e13 BY NATURE OF SPENDING / Financial year ending in 2008RegionTotal public expenditure per studentTotal public expenditureon educationCountry or territoryas a % of GDP per capitain U.S. dollars PPPPrimary(ISCED 1)Secondary(ISCED 2-3)Tertiary(ISCED 5-6)Primary(ISCED 1)Secondary(ISCED 2-3)Tertiary(ISCED 5-6) as a % of GDPas a % of totalgovernmentexpenditure1 2 3 4 5 6 7 8Barbados 27.7 * 24.8 * ... … … ... 6.7 15.7Belize 14.3 -1 21.0 -1 ... 948 -1 1,392 -1 ... 5.1 -1 *, -116.8Bermuda 7.7 -2 7.1 -2 ... … … ... 1.2 -2 ...Bolivia 13.7 **, -2 14.5 **, -2 ... 546 **, -2 576 **, -2 ... 6.3 -2 ...Brazil 17.7 -1 18.5 -1 30.4 -1 1,716 -1 1,787 -1 2,942 -1 5.2 -1 16.1 -1British Virgin Islands 8.1 -1 17.1 -1 ... ... ... ... 3.2 -1 14.6 -1Cayman Islands 15.8 -2 22.2 -2 - -2 … … - -2 2.6 -2 ...Chile 11.9 -1 13.4 -1 11.5 -1 1,653 -1 1,864 -1 1,591 -1 3.4 -1 18.2 -1Colombia 12.4 14.8 26.0 1,099 1,313 2,309 3.9 14.9Costa Rica ... ... ... ... ... ... 5.0 22.8Cuba 44.7 51.9 58.8 … … … 13.6 18.5Dominica 22.2 19.0 … 1,833 1,569 … 4.8 11.3Dominican Republic 7.4 6.5 ... 606 530 ... 2.2 -1 11.0 -1Ecuador ... ... ... ... ... ... ... ...*, -1El Salvador 8.5 9.1 ... 578 618 ... 3.6 13.1Grenada ... ... ... ... ... ... ... ...Guatemala 10.5 6.2 ... 498 296 ... 3.2 ...Guyana 14.4 -1 17.1 -1 36.3 -1 348 -1 412 -1 875 -1 6.1 -1 12.5 -1Haiti ... ... ... ... ... ... ... ...Honduras ... ... ... ... ... ... ... ...Jamaica 15.8 26.8 42.4 1,216 2,057 3,257 6.2 ...Mexico 13.3 -1 13.5 -1 37.1 -1 1,874 -1 1,901 -1 5,237 -1 4.8 -1 ...Montserrat ... ... ... ... ... ... ... ...Netherlands Antilles ... ... ... ... ... ... ... ...Nicaragua 9.8 -2 4.5 -2 ... 240 -2 110 -2 ... ... ...Panama 7.5 10.0 ... 934 1,244 ... 3.8 ...Paraguay 10.7 -1 16.3 -1 26.0 -1 476 -1 721 -1 1,151 -1 4.0 -1 11.9 -1Peru 8.2 10.0 ... 699 849 ... 2.7 20.7Saint Kitts and Nevis ... ... ... ... ... ... ... ...Saint Lucia ... ... ... ... ... ... 6.3 12.9Saint Vincent and the Grenadines 24.9 -1 ... ... 2,207 -1 ... ... 7.0 -1 ...Suriname ... ... ... ... ... ... ... ...Trinidad and Tobago 9.1 -1 9.9 **, -1 ... 2,129 -1 2,339 **, -1 ... ... ...Turks and Caicos Islands ... ... ... ... ... ... ... ...Uruguay 8.5 -2 10.4 -2 18.1 -2 888 -2 1,084 -2 1,889 -2 2.8 -2 11.6 -2Venezuela 9.1 -1 8.1 -1 ... 1,106 -1 986 -1 ... 3.7 -1 ...North America and Western EuropeAndorra 12.3 -1 13.8 -1 ... … … ... 3.2 ...Austria 23.1 -1 26.5 -1 47.4 -1 8,649 -1 9,912 -1 17,714 -1 5.4 -1 11.1 -1Belgium 20.8 -1 33.7 -1 35.7 -1 7,265 -1 11,765 -1 12,471 -1 6.1 -1 12.4 -1Canada ... ... ... ... ... ... 4.9 -1 ...Cyprus 29.6 -1 41.0 -1 63.7 -1 7,328 -1 10,158 -1 15,780 -1 7.1 -1 9.6 -1Denmark 24.5 -2 34.4 -2 53.4 -2 8,625 -2 12,077 -2 18,771 -2 7.9 -2 15.5 -2Finland 17.5 -1 30.9 -1 31.8 -1 6,051 -1 10,664 -1 10,994 -1 5.9 -1 12.5 -1France 17.1 -2 26.6 -2 33.5 -2 5,431 -2 8,579 -2 10,651 -2 5.6 -2 10.6 -2Germany 16.1 -2 20.7 -2 ... 5,281 -2 6,785 -2 ... 4.4 -2 9.7 -2Gibraltar ... ... ... ... ... ... ... ...206
G l o b a l e d u c a t i o n d i g e s t 2 0 1 0 C o m p a r i n g e d u c a t i o n s t a t i s t i c s a r o u n d t h e w o r l dEducational expenditure by nature of spending as a %of total educational expenditure in public institutionsRegionPrimary, secondary and post-secondary non-tertiary(ISCED 1-4)Tertiary(ISCED 5-6)Salaries,Salaries,all staff Other current Total current Capitalall staff Other current Total current Capital9 10 11 12 13 14 15 1682.2 -1 14.3 -1 96.5 -1 3.5 -1 89.2 9.7 98.8 1.2 Barbados... ... ... ... ... ... ... ... Belize... ... ... ... ... ... ... ... Bermuda... ... ... ... ... ... ... ... Bolivia68.0 -1 25.1 -1 93.2 -1 6.8 -1 74.3 -1 20.8 -1 95.1 -1 4.9 -1 BrazilCountry or territory66.8 -1 22.7 -1 89.4 -1 10.6 -1 … … 100.0 -1 - -1 British Virgin Islands97.6 -2 2.4 -2 100.0 -2 - -2 - -2 - -2 - -2 - -2 Cayman Islands85.5 -1 10.9 -1 96.4 -1 3.6 -1 58.6 -1 34.0 -1 92.6 -1 7.4 -1 Chile… … … … … … … … Colombia93.0 7.0 100.0 ... ... … 100.0 - Costa Rica52.4 44.9 97.3 2.7 25.6 72.9 98.5 1.5 Cuba79.1 1.5 80.6 19.4 … … … … Dominica62.7 -1 18.3 -1 81.0 -1 19.0 -1 90.5 -1 - -1 90.5 -1 9.5 -1 Dominican Republic... ... ... ... ... ... ... ... Ecuador64.9 26.8 91.7 8.3 61.4 -2 17.7 -2 79.1 -2 20.9 -2 El Salvador... ... ... ... ... ... ... ... Grenada73.9 10.7 84.5 15.5 ... . 95.7 4.3 Guatemala64.8 -1 19.8 -1 84.5 -1 15.5 -1 65.1 -1 27.7 -1 92.8 -1 7.2 -1 Guyana... ... ... ... ... ... ... ... Haiti... ... ... ... ... ... ... ... Honduras84.0 5.5 89.5 10.5 98.7 1.3 100.0 ... Jamaica89.9 -1 7.6 -1 97.5 -1 2.5 -1 67.1 -1 28.2 -1 95.2 -1 4.8 -1 Mexico... ... ... ... ... ... ... ... Montserrat... ... ... ... ... ... ... ... Netherlands Antilles80.4 -2 8.9 -2 89.3 -2 10.7 -2 ... ... ... ... Nicaragua89.3 ... 89.3 10.7 91.8 ... 91.8 8.2 Panama81.6 **, -1 12.4 **, -1 94.0 **, -1 6.0 **, -1 71.9 -1 16.3 -1 88.2 -1 11.8 -1 Paraguay72.8 11.9 84.7 15.3 62.0 17.0 79.0 21.0 Peru... ... ... ... ... ... ... ... Saint Kitts and Nevis60.3 23.7 84.0 16.0 - -2 - -2 - -2 - -2 Saint Lucia98.6 -1 1.4 -1 100.0 -1 - -1 . -1 . -1 . -1 . -1 Saint Vincent and the Grenadines... ... ... ... ... ... ... ... Suriname... ... ... ... ... ... ... ... Trinidad and Tobago... ... ... ... ... ... ... ... Turks and Caicos Islands82.2 -2 12.0 -2 94.2 -2 5.8 -2 75.1 -2 18.9 -2 93.9 -2 6.1 -2 Uruguay... ... 97.0 -1 3.0 -1 ... ... 97.2 -1 2.8 -1 Venezuela49.9 47.8 97.7 2.3 54.7 40.5 95.2 4.8 Andorra76.4 -1 21.6 -1 98.0 -1 2.0 -1 58.3 -1 33.5 -1 91.8 -1 8.2 -1 Austria86.4 -1 10.2 -1 96.6 -1 3.4 -1 76.0 -1 21.1 -1 97.2 -1 2.8 -1 Belgium... ... ... ... 58.8 -2 33.6 -2 92.5 -2 7.5 -2 Canada80.2 -1 9.3 -1 89.5 -1 10.5 -1 62.9 -1 20.5 -1 83.5 -1 16.5 -1 Cyprus72.4 -2 20.9 -2 93.3 -2 6.7 -2 72.8 -2 23.8 -2 96.5 -2 3.5 -2 Denmark59.7 -1 31.4 -1 91.2 -1 8.8 -1 60.4 -1 36.3 -1 96.7 -1 3.3 -1 Finland75.0 -2 15.5 -2 90.5 -2 9.5 -2 72.1 -2 16.2 -2 88.2 -2 11.8 -2 France77.9 -2 14.8 -2 92.7 -2 7.3 -2 62.0 -2 29.9 -2 92.0 -2 8.0 -2 Germany... ... ... ... ... ... ... ... GibraltarNorth America and Western Europe207
PUBLIC EXPENDITURE ON EDUCATION AND EXPENDITURE ON EDUCATIONT a b l e13 BY NATURE OF SPENDING / Financial year ending in 2008RegionTotal public expenditure per studentTotal public expenditureon educationCountry or territoryas a % of GDP per capitain U.S. dollars PPPPrimary(ISCED 1)Secondary(ISCED 2-3)Tertiary(ISCED 5-6)Primary(ISCED 1)Secondary(ISCED 2-3)Tertiary(ISCED 5-6) as a % of GDPas a % of totalgovernmentexpenditure1 2 3 4 5 6 7 8Greece ... ... ... ... ... ... ... ...Holy See ... ... ... ... ... ... ... ...Iceland 26.7 -1 22.1 -1 27.9 -1 9,537 -1 7,917 -1 9,987 -1 7.5 -1 17.4 -1Ireland 15.8 -1 23.3 -1 26.3 -1 7,048 -1 10,394 -1 11,734 -1 4.9 -1 13.8 -1Israel 21.2 -1 20.5 -1 23.4 -1 5,591 -1 5,393 -1 6,150 -1 6.4 -1 13.8 -1Italy 22.8 -1 25.4 -1 22.3 -1 6,920 -1 7,702 -1 6,763 -1 4.3 -1 9.0 -1Liechtenstein ... ... ... ... ... ... ... ...Luxembourg ... 19.0 -1 ... ... 15,134 -1 ... ... ...Malta ... ... ... ... ... ... ... ...Monaco ... ... ... ... ... ... ... ...Netherlands 17.8 -2 25.4 -2 43.9 -2 6,525 -2 9,251 -2 15,724 -2 5.5 -2 12.0 -2Norway 18.4 -1 26.5 -1 47.1 -1 9,851 -1 14,143 -1 25,191 -1 6.7 -1 16.5 -1Portugal 22.4 -2 34.0 -2 28.8 -2 4,837 -2 7,348 -2 6,238 -2 5.3 -2 11.3 -2San Marino ... ... ... ... ... ... ... ...Spain 19.9 -1 24.1 -1 25.0 -1 6,139 -1 7,641 -1 7,940 -1 4.4 -1 11.1 -1Sweden 25.4 -1 31.2 -1 39.0 -1 9,338 -1 11,450 -1 14,312 -1 6.7 -1 12.7 -1Switzerland 23.0 -1 25.8 -1 47.8 -1 9,361 -1 10,485 -1 19,434 -1 5.3 -1 16.3 -2United Kingdom 23.4 -1 28.6 -1 24.8 -1 7,883 -1 9,642 -1 8,346 -1 5.6 -1 11.7 -1United States of America 22.4 -1 24.6 -1 22.0 -1 9,839 -1 10,811 -1 9,700 -1 5.5 -1 14.1 -1South and West AsiaAfghanistan ... ... ... ... ... ... ... ...Bangladesh 10.5 14.3 ... 133 ... ... 2.4 14.0Bhutan 7.1 +1 31.1 +1 ... 328 +1 1,363 +1 ... 5.1 ...India 8.9 -2 16.2 -2 55.0 -2 198 -2 361 -2 1,228 -2 3.2 -2 ...Iran (Islamic Republic of) 13.5 20.3 20.7 1,477 2,224 2,269 4.8 20.0Maldives 26.8 ... - 1,473 ... - 8.1 12.0Nepal 15.1 11.2 ... 159 118 ... 3.8 19.0Pakistan ... ... ... ... ... ... 2.9 11.2 -1Sri Lanka ... ... ... ... ... ... ... ...Sub-Saharan AfricaAngola ... ... 80.8 -2 ... ... 3,470 -2 2.6 -2 ...Benin 12.4 -2 ... 153.4 -2 168 -2 ... 2,082 -2 3.6 -1 15.9 -1Botswana 12.6 -1 38.3 -1 ... ... ... ... 8.1 -1 21.0 -1Burkina Faso 29.1 -1 30.3 -1 308.3 -1 326 -1 339 -1 3,452 -1 4.6 -1 21.8 -1Burundi 18.8 58.2 ** 563.9 72 223 ** 2,158 7.2 22.3Cameroon 6.1 26.9 33.4 136 596 740 2.9 14.6 -1Cape Verde 13.6 ... 48.2 475 ... 1,689 5.7 16.7Central African Republic 5.5 -1 ... ... 39 -1 ... ... 1.3 -1 12.0 -1Chad ... ... ... ... ... ... ... ...Comoros 27.2 ... ... 318 ... ... 7.6 ...Congo ... ... ... ... ... ... ... ...Côte d’Ivoire ... ... ... ... ... ... 4.6 24.6Democratic Republic of the Congo ... ... ... ... ... ... ... ...Equatorial Guinea ... ... ... ... ... ... ... ...Eritrea 8.2 -2 8.1 -2 ... 51 -2 50 -2 ... 2.0 -2 ...Ethiopia 12.4 -1 8.9 -1 642.7 -1 88 -1 63 -1 4,531 -1 5.5 -1 23.3 -1Gabon ... ... ... ... ... ... ... ...208
G l o b a l e d u c a t i o n d i g e s t 2 0 1 0 C o m p a r i n g e d u c a t i o n s t a t i s t i c s a r o u n d t h e w o r l dEducational expenditure by nature of spending as a %of total educational expenditure in public institutionsRegionPrimary, secondary and post-secondary non-tertiary(ISCED 1-4)Tertiary(ISCED 5-6)Salaries,Salaries,all staff Other current Total current Capitalall staff Other current Total current Capital9 10 11 12 13 14 15 16... ... ... ... ... ... ... ... Greece... ... ... ... ... ... ... ... Holy See69.8 -1 21.0 -1 90.9 -1 9.1 -1 79.3 -1 2.7 -1 82.1 -1 17.9 -1 Iceland74.9 -1 15.0 -1 89.9 -1 10.1 -1 67.8 -1 23.8 -1 91.7 -1 8.3 -1 Ireland70.7 -1 22.4 -1 93.1 -1 6.9 -1 50.1 -1 41.9 -1 92.1 -1 7.9 -1 Israel78.3 -1 17.7 -1 96.0 -1 4.0 -1 59.4 -1 28.8 -1 88.1 -1 11.9 -1 ItalyCountry or territory91.4 -1 9.1 -1 100.0 -1 - -1 - -1 - -1 - -1 - -1 Liechtenstein... ... ... ... ... ... ... ... Luxembourg... ... ... ... ... ... ... ... Malta... ... ... ... ... ... ... ... Monaco70.9 -2 14.8 -2 85.7 -2 14.3 -2 59.4 -2 28.4 -2 87.9 -2 12.1 -2 Netherlands67.3 -1 19.4 -1 86.7 -1 13.3 -1 61.8 -1 32.3 -1 94.1 -1 5.9 -1 Norway93.4 -2 4.7 -2 98.1 -2 1.9 -2 62.1 -2 27.4 -2 89.5 -2 10.5 -2 Portugal... ... ... ... ... ... ... ... San Marino75.0 -1 15.5 -1 90.5 -1 9.5 -1 61.8 -1 18.6 -1 80.4 -1 19.6 -1 Spain63.6 -1 29.1 -1 92.7 -1 7.3 -1 60.6 -1 35.6 -1 96.1 -1 3.9 -1 Sweden77.7 -1 13.8 -1 91.6 -1 8.4 -1 73.0 -1 21.1 -1 94.1 -1 5.9 -1 Switzerland72.1 -1 21.6 -1 93.7 -1 6.3 -1 . -1 . -1 . -1 . -1 United Kingdom71.1 -1 17.3 -1 88.3 -1 11.7 -1 56.8 -1 32.8 -1 89.7 -1 10.3 -1 United States of AmericaSouth and West Asia... ... ... ... ... ... ... ... Afghanistan58.4 18.2 76.5 23.5 73.2 13.4 86.6 13.4 Bangladesh... ... ... ... ... ... ... ... Bhutan... ... ... ... ... ... ... ... India... ... ... ... ... ... ... ... Iran (Islamic Republic of)... ... ... ... ... ... ... ... Maldives... ... ... ... ... ... ... ... Nepal... ... ... ... ... ... ... ... Pakistan... ... ... ... ... ... ... ... Sri Lanka... ... 71.7 -2 28.3 -2 ... ... 71.1 -2 28.9 -2 Angola42.4 -1 52.4 -1 94.8 -1 5.2 -1 27.9 -1 63.2 -1 91.0 -1 9.0 -1 Benin... ... ... ... ... ... ... ... BotswanaSub-Saharan Africa51.0 -1 5.0 -1 56.1 -1 43.9 -1 44.1 -1 27.7 -1 71.8 -1 28.2 -1 Burkina Faso66.9 19.9 86.8 13.2 38.3 59.2 97.5 2.5 Burundi... ... ... ... ... ... ... ... Cameroon82.7 1.6 84.3 15.7 87.8 - 87.8 12.2 Cape Verde94.1 -1 4.6 -1 98.7 -1 1.3 -1 77.4 -1 21.4 -1 98.8 -1 1.2 -1 Central African Republic... ... ... ... ... ... ... ... Chad... ... ... ... ... ... ... ... Comoros... ... ... ... ... ... ... ... Congo... ... ... ... ... ... ... ... Côte d’Ivoire... ... ... ... ... ... ... ... Democratic Republic of the Congo... ... ... ... ... ... ... ... Equatorial Guinea73.7 -2 9.3 -2 83.0 -2 17.0 -2 37.6 -2 29.6 -2 67.2 -2 32.8 -2 Eritrea... ... ... ... ... ... ... ... Ethiopia... ... ... ... ... ... ... ... Gabon209
PUBLIC EXPENDITURE ON EDUCATION AND EXPENDITURE ON EDUCATIONT a b l e13 BY NATURE OF SPENDING / Financial year ending in 2008RegionTotal public expenditure per studentTotal public expenditureon educationCountry or territoryas a % of GDP per capitain U.S. dollars PPPPrimary(ISCED 1)Secondary(ISCED 2-3)Tertiary(ISCED 5-6)Primary(ISCED 1)Secondary(ISCED 2-3)Tertiary(ISCED 5-6) as a % of GDPas a % of totalgovernmentexpenditure1 2 3 4 5 6 7 8Gambia ... ... ... ... ... ... ... ...Ghana 17.9 -2 28.3 -2 ... 230 -2 362 -2 ... ... ...Guinea 5.0 4.4 71.5 60 53 861 1.7 19.2Guinea-Bissau ... ... ... ... ... ... ... ...Kenya 22.3 -2 22.0 -2 ... 300 -2 284 -2 ... 7.0 -2 ...Lesotho 22.3 50.2 ** ... ... ... ... 12.4 23.7Liberia 5.7 -1 8.4 -1 ... ... ... ... 2.7 12.1Madagascar 7.4 13.0 137.2 77 136 1,439 2.9 13.4Malawi ... ... ... ... ... ... ... ...Mali 10.4 34.5 114.8 117 389 1,295 3.8 19.5Mauritius 9.8 +1 16.1 **, +1 ... 1,198 +1 1,950 **, +1 ... 3.4 +1 11.4 +1Mozambique 14.5 -2 83.7 -2 ... 108 -2 622 -2 ... 5.0 -2 21.0 -2Namibia 15.7 16.0 ... 970 947 4,175 6.5 22.4Niger 27.1 49.6 398.0 185 339 2,722 3.7 15.5Nigeria ... ... ... ... ... ... ... ...Rwanda 8.2 34.3 222.8 84 351 2,277 4.1 20.4Sao Tome and Principe ... ... ... ... ... ... ... ...Senegal 17.2 ** 25.2 ** 166.9 ** 306 ** 447 ** 2,957 ** 5.1 ** 19.0 **Seychelles ... ... ... ... ... ... 5.0 -2 12.6 -2Sierra Leone ... ... ... ... ... ... ... ...Somalia ... ... ... ... ... ... ... ...South Africa 13.7 16.0 ** ... ... ... ... 5.4 +1 16.9 +1Swaziland 16.3 -2 41.1 -2 347.5 -2 683 -2 1,643 -2 15,063 -2 7.9 21.6Togo 9.4 -1 19.1 -1 155.2 -1 77 -1 158 -1 1,278 -1 3.7 -1 17.2 -1Uganda 7.5 +1 20.3 +1 ... ... ... ... 3.3 +1 15.6 +1United Republic of Tanzania 22.9 ... ... 262 ... ... 6.8 27.5Zambia ... ... ... ... ... ... 1.4 ...Zimbabwe ... ... ... ... ... ... ... ...Please refer to the Reader’s Guide for more information on the data and symbols used in each table.210
G l o b a l e d u c a t i o n d i g e s t 2 0 1 0 C o m p a r i n g e d u c a t i o n s t a t i s t i c s a r o u n d t h e w o r l dEducational expenditure by nature of spending as a %of total educational expenditure in public institutionsRegionPrimary, secondary and post-secondary non-tertiary(ISCED 1-4)Tertiary(ISCED 5-6)Salaries,Salaries,all staff Other current Total current Capitalall staff Other current Total current Capital9 10 11 12 13 14 15 16... ... ... ... ... ... ... ... Gambia... ... ... ... ... ... ... ... Ghana44.6 8.2 52.8 47.2 38.7 58.0 96.7 3.3 GuineaCountry or territory... ... ... ... ... ... ... ... Guinea-Bissau... ... ... ... ... ... ... ... Kenya61.3 38.7 ** 100.0 ** - ** ... ... 100.0 ** - ** Lesotho... ... ... ... ... ... ... ... Liberia69.4 20.6 89.1 10.0 26.3 61.8 88.1 11.9 Madagascar... ... ... ... ... ... ... ... Malawi55.7 23.4 79.1 20.9 40.5 47.8 88.4 11.6 Mali... ... ... ... ... ... ... ... Mauritius59.2 -2 12.2 -2 71.4 -2 28.6 -2 59.3 -2 27.0 -2 86.3 -2 13.7 -2 Mozambique74.3 ** 23.1 ** 97.3 ** 2.7 ** 87.5 12.5 ** 100.0 ** - ** Namibia... ... ... ... ... ... ... ... Niger... ... ... ... ... ... ... ... Nigeria38.4 45.9 84.4 15.6 95.0 5.0 100.0 - Rwanda... ... ... ... ... ... ... ... Sao Tome and Principe... ... ... ... ... ... ... ... Senegal68.8 -2 17.3 -2 86.1 -2 13.9 -2 . -2 . -2 . -2 . -2 Seychelles... ... ... ... ... ... ... ... Sierra Leone... ... ... ... ... ... ... ... Somalia81.5 +1 14.5 +1 96.0 +1 4.0 +1 ... ... 100.0 +1 - +1 South Africa... ... ... ... ... ... ... ... Swaziland95.8 -1 2.8 -1 98.6 -1 1.4 -1 ... ... ... ... Togo72.1 +1 18.8 +1 90.9 +1 9.1 +1 47.6 +1 30.0 +1 77.6 +1 22.4 +1 Uganda... ... ... ... ... ... ... ... United Republic of Tanzania... ... ... ... ... ... ... ... Zambia... ... ... ... ... ... ... ... Zimbabwe211
EXPENDITURE ON EDUCATION AS A PERCENTAGE OF GDP, BY SOURCES OF FUNDS /T a b l e14 Financial year ending in 2008RegionExpenditure on educational institutions and educational administrationas a % of gross domestic productAll sources of funds (public, private, international)Public sourcesCountry or territoryArab StatesAll levels b, c Pre-primary(ISCED 0)Primary(ISCED 1)Secondary andpost-secondarynon-tertiary(ISCED 2-4)Tertiary(ISCED 5-6) All levels b Pre-primary(ISCED 0)Primary(ISCED 1)1 2 3 4 5 6 7 8Algeria ... ... ... ... ... ... ... ...Bahrain ... ... ... ... ... ... ... ...Djibouti ... ... ... ... ... ... ... ...Egypt ... ... ... ... ... ... ... ...Iraq ... ... ... ... ... ... ... ...Jordan ... - -1 2.0 -1 2.1 -1 … ... - -1 1.9 -1Kuwait ... ... ... ... ... ... 0.4 -2 0.8 -2Lebanon ... ... ... ... ... 2.0 ... ...Libyan Arab Jamahiriya ... ... ... ... ... ... ... ...Mauritania ... ... ... ... ... 4.4 ** ... 1.9Morocco ... ... ... ... ... ... ... ...Oman ... ... ... ... ... ... ... ...Palestinian Autonomous Territories ... ... ... ... ... ... ... ...Qatar ... ... ... ... ... ... ... ...Saudi Arabia ... ... ... ... ... ... ... ...Sudan ... ... ... ... ... ... ... ...Syrian Arab Republic ... ... ... ... ... 4.9 -1 ... 2.1 -1Tunisia ... ... ... ... ... 7.2 -1 - -1 ...United Arab Emirates ... ... ... ... ... ... ... ...Yemen ... ... ... ... ... ... ... ...Central and Eastern EuropeAlbania ... ... ... ... ... ... ... ...Belarus ... ... ... ... ... 5.2 -1 1.0 -1 ...Bosnia and Herzegovina ... ... ... ... ... ... ... ...Bulgaria 4.2 -1 0.8 -1 0.7 -1 1.6 -1 1.2 -1 3.5 -1 0.7 -1 0.7 -1Croatia ... ... ... ... ... ... ... ...Czech Republic 5.0 -2 0.5 -2 0.7 -2 2.3 -2 1.4 -2 4.4 -2 0.4 -2 0.6 -2Estonia 5.1 -1 0.4 -1 1.1 -1 2.3 -1 1.3 -1 4.7 -1 0.4 -1 1.1 -1Hungary 5.6 -2 0.8 -2 1.1 -2 2.4 -2 1.1 -2 5.1 -2 0.7 -2 1.0 -2Latvia 5.6 -1 0.7 -1 1.3 -1 2.1 -1 1.5 -1 4.8 -1 0.7 -1 1.2 -1Lithuania 5.0 -1 0.6 -1 0.7 -1 2.4 -1 1.4 -1 4.5 -1 0.6 -1 0.7 -1Montenegro ... ... ... ... ... ... ... ...Poland 6.1 -2 0.7 -2 1.8 -2 2.2 -2 1.4 -2 4.8 -1 0.5 -1 1.6 -1Republic of Moldova 8.9 -1 ... ... ... ... 8.3 -1 1.3 -1 1.4 -1Romania 4.9 -1 0.4 -1 0.9 -1 1.6 -1 1.6 -1 4.3 -1 0.4 -1 0.9 -1Russian Federation ... ... ... ... ... 3.9 -2 0.5 -2 ...Serbia ... ... ... ... ... ... ... ...Slovakia 4.0 -1 0.4 -1 0.7 -1 1.8 -1 0.9 -1 3.3 -1 0.4 -1 0.7 -1Slovenia 5.6 -1 0.7 -1 ... ... 1.3 -1 4.8 -1 0.6 -1 ...The former Yugoslav Rep. of Macedonia ... ... ... ... ... ... ... ...Turkey ... ... ... ... ... 2.7 -2 - -2 ...Ukraine ... ... ... ... ... ... ... ...Central AsiaArmenia ... ... ... ... ... ... ... ...Azerbaijan ... ... ... ... ... ... ... ...Georgia ... ... ... ... ... 2.9 0.3 1.1212
G l o b a l e d u c a t i o n d i g e s t 2 0 1 0 C o m p a r i n g e d u c a t i o n s t a t i s t i c s a r o u n d t h e w o r l dExpenditure on educational institutions and educational administrationas a % of gross domestic productPublic sources Private sourcesInternationalsourcesSecondary andpost-secondarynon-tertiary(ISCED 2-4)Tertiary(ISCED 5-6) All levels b Pre-primary(ISCED 0)Primary(ISCED 1)Secondary andpost-secondarynon-tertiary(ISCED 2-4)Tertiary(ISCED 5-6) All levels9 10 11 12 13 14 15 16... ... ... ... ... ... ... ... AlgeriaRegionCountry or territoryArab States... ... ... ... ... ... ... ... Bahrain... ... ... ... ... ... ... ... Djibouti... ... ... ... ... ... ... ... Egypt... ... ... ... ... ... ... ... Iraq2.0 -1 ... ... . -1 . -1 . -1 ... ... Jordan1.4 -2 ... ... ... ... ... ... . Kuwait... 0.6 ... ... ... ... ... ... Lebanon... ... ... - -2 - -2 - -2 ... ... Libyan Arab Jamahiriya1.2 0.7 ... ... ... ... ... 0.7 Mauritania... ... ... ... ... ... ... ... Morocco... ... ... ... ... ... . ... Oman... ... ... ... ... ... ... ... Palestinian Autonomous Territories... ... ... ... ... ... ... ... Qatar... ... ... ... ... ... ... ... Saudi Arabia... ... ... ... ... ... ... ... Sudan1.7 -1 1.0 -1 ... ... ... ... ... ... Syrian Arab Republic... 1.8 -1 ... ... ... ... ... ... Tunisia... ... ... ... ... ... ... ... United Arab Emirates... ... ... ... ... ... ... ... Yemen... ... ... ... ... ... ... ... Albania... 1.0 -1 ... ... ... ... ... ... BelarusCentral and Eastern Europe... ... ... ... ... ... ... ... Bosnia and Herzegovina1.5 -1 0.6 -1 0.6 -1 0.1 -1 - -1 0.1 -1 0.5 -1 0.1 -1 Bulgaria... ... ... ... ... ... ... ... Croatia2.1 -2 1.2 -2 0.6 -2 - -2 0.1 -2 0.2 -2 0.2 -2 - -2 Czech Republic2.2 -1 1.0 -1 0.3 -1 - -1 - -1 - -1 0.3 -1 0.1 -1 Estonia2.2 -2 0.9 -2 0.5 -2 - -2 - -2 0.1 -2 0.3 -2 - -2 Hungary2.0 -1 0.9 -1 0.6 -1 - -1 - -1 0.1 -1 0.5 -1 0.2 -1 Latvia2.4 -1 0.9 -1 0.5 -1 - -1 - -1 - -1 0.4 -1 - -1 Lithuania... ... ... ... ... ... ... ... Montenegro1.8 -1 0.9 -1 0.6 -2 0.1 -2 - -2 - -2 0.4 -2 ... Poland3.9 -1 1.6 -1 0.5 -1 ... ... ... ... - Republic of Moldova1.5 -1 1.1 -1 0.6 -1 - -1 - -1 - -1 0.5 -1 - -1 Romania... 0.8 -2 ... ... ... ... ... ... Russian Federation... ... ... ... ... ... ... ... Serbia1.6 -1 0.6 -1 0.5 -1 0.1 -1 0.1 -1 0.2 -1 0.2 -1 0.1 -1 Slovakia... 0.9 -1 0.7 -1 0.1 -1 ... ... 0.3 -1 - -1 Slovenia... ... ... ... ... ... ... ... The former Yugoslav Rep. of Macedonia... 0.8 -2 ... ... ... ... ... ... Turkey... ... ... ... ... ... ... ... UkraineCentral Asia... ... ... ... ... ... ... ... Armenia... ... ... ... ... ... ... ... Azerbaijan1.1 0.3 ... ... ... ... ... ... Georgia213
EXPENDITURE ON EDUCATION AS A PERCENTAGE OF GDP, BY SOURCES OF FUNDS /T a b l e14 Financial year ending in 2008RegionExpenditure on educational institutions and educational administrationas a % of gross domestic productAll sources of funds (public, private, international)Public sourcesCountry or territoryAll levels b, c Pre-primary(ISCED 0)Primary(ISCED 1)Secondary andpost-secondarynon-tertiary(ISCED 2-4)Tertiary(ISCED 5-6) All levels b Pre-primary(ISCED 0)Primary(ISCED 1)1 2 3 4 5 6 7 8Kazakhstan 3.6 -1 0.2 -1 ... ... 0.9 -1 2.8 -1 0.2 -1 ...Kyrgyzstan ... ... ... ... ... 6.5 -1 0.4 -1 ...Mongolia ... ... ... ... ... 5.1 -1 1.0 -1 1.4 -1Tajikistan ... ... ... ... ... 3.4 0.1 ...Turkmenistan ... ... ... ... ... ... ... ...Uzbekistan ... ... ... ... ... ... ... ...East Asia and the PacificAustralia 5.6 -1 0.1 -1 1.6 -1 2.2 -1 1.7 -1 3.9 -1 - -1 1.4 -1Brunei Darussalam ... ... ... ... ... ... ... ...Cambodia ... ... ... ... ... 1.6 -1 ... ...China ... ... ... ... ... ... ... ...Cook Islands ... ... ... ... ... ... ... ...Democratic People’s Republic of Korea ... ... ... ... ... ... ... ...Fiji ... ... ... ... ... ... ... ...Hong Kong SAR of China ... ... ... ... ... 3.1 0.1 0.7Indonesia ... ... ... ... ... 3.3 -1 - -1 1.9 -1Japan 4.9 -1 0.2 -1 1.2 -1 1.6 -1 1.5 -1 3.3 -1 0.1 -1 1.2 -1Kiribati ... ... ... ... ... ... ... ...Lao People’s Democratic Republic ... ... ... ... ... 2.3 ... ...Macao, China ... ... ... ... ... ... ... ...Malaysia ... ... ... ... ... ... ... ...Marshall Islands ... ... ... ... ... ... ... ...Micronesia (Federated States of) ... ... ... ... ... ... ... ...Myanmar ... ... ... ... ... ... ... ...Nauru ... ... ... ... ... ... ... ...New Zealand 6.4 -1 0.3 -1 1.6 -1 2.8 -1 1.5 -1 5.1 -1 0.2 -1 1.5 -1Niue ... ... ... ... ... ... ... ...Palau ... ... ... ... ... ... ... ...Papua New Guinea ... ... ... ... ... ... ... ...Philippines ... ... ... ... ... 2.5 -1 - -1 1.4 -1Republic of Korea 7.0 -1 0.2 -1 1.6 -1 2.4 -1 2.4 -1 4.0 -1 0.1 -1 1.3 -1Samoa ... ... ... ... ... ... ... ...Singapore ... ... ... ... ... 3.2 +1 … 0.7 +1Solomon Islands ... ... ... ... ... ... ... ...Thailand ... ... ... ... ... 3.9 0.3 1.8Timor-Leste ... ... ... ... ... 7.1 ... ...Tokelau ... ... ... ... ... ... ... ...Tonga ... ... ... ... ... ... ... ...Tuvalu ... ... ... ... ... ... ... ...Vanuatu 7.2 - 3.6 2.6 0.4 6.9 - 3.4Viet Nam ... ... ... ... ... ... ... ...Latin America and the CaribbeanAnguilla … … … ... … … … …Antigua and Barbuda ... ... ... ... ... ... ... ...Argentina 5.6 -1 0.5 -1 1.9 -1 2.1 -1 1.1 -1 4.9 -1 0.4 -1 1.7 -1Aruba ... ... ... ... ... 4.3 -1 0.3 -1 1.2 -1Bahamas ... ... ... ... ... ... ... ...214
G l o b a l e d u c a t i o n d i g e s t 2 0 1 0 C o m p a r i n g e d u c a t i o n s t a t i s t i c s a r o u n d t h e w o r l dExpenditure on educational institutions and educational administrationas a % of gross domestic productPublic sources Private sourcesInternationalsourcesSecondary andpost-secondarynon-tertiary(ISCED 2-4)Tertiary(ISCED 5-6) All levels b Pre-primary(ISCED 0)Primary(ISCED 1)Secondary andpost-secondarynon-tertiary(ISCED 2-4)Tertiary(ISCED 5-6) All levels9 10 11 12 13 14 15 16RegionCountry or territory... 0.4 -1 0.8 -1 0.1 -1 ... ... 0.5 -1 - -1 Kazakhstan... 1.0 -1 ... ... ... ... ... ... Kyrgyzstan... ... ... ... ... ... ... ... Mongolia... 0.4 ... ... ... ... ... ... Tajikistan... ... ... ... ... ... ... ... Turkmenistan... ... ... ... ... ... ... ... Uzbekistan1.7 -1 0.7 -1 1.7 -1 0.1 -1 0.2 -1 0.5 -1 0.9 -1 - -1 AustraliaEast Asia and the Pacific... ... ... ... ... ... ... ... Brunei Darussalam... ... ... ... ... ... ... ... Cambodia... ... ... ... ... ... ... ... China... ... ... ... ... ... ... ... Cook Islands... ... ... ... ... ... ... ... Democratic People’s Republic of Korea... ... ... ... ... ... ... ... Fiji1.2 0.9 ... ... ... ... ... ... Hong Kong SAR of China1.1 -1 0.3 -1 ... ... ... ... ... ... Indonesia1.3 -1 0.5 -1 1.6 -1 0.1 -1 - -1 0.3 -1 1.0 -1 - -1 Japan... ... ... ... ... ... ... ... Kiribati... ... ... ... ... ... ... ... Lao People’s Democratic Republic... ... ... ... ... ... ... ... Macao, China... ... ... ... ... ... ... ... Malaysia... ... ... ... ... ... ... ... Marshall Islands... ... ... ... ... ... ... ... Micronesia (Federated States of)... ... ... ... ... ... ... ... Myanmar... ... ... ... ... ... ... ... Nauru2.4 -1 1.0 -1 1.3 -1 0.1 -1 0.1 -1 0.5 -1 0.6 -1 - -1 New Zealand... ... ... ... ... ... ... ... Niue... ... ... ... ... ... ... ... Palau... ... ... ... ... ... ... ... Papua New Guinea0.7 -1 0.3 -1 ... ... ... ... ... . -1 Philippines1.8 -1 0.5 -1 3.0 -1 0.1 -1 0.2 -1 0.6 -1 1.9 -1 . -1 Republic of Korea... ... ... ... ... ... ... ... Samoa1.0 +1 1.1 +1 ... ... ... ... ... ... Singapore... ... ... ... ... ... ... ... Solomon Islands0.6 0.8 ... ... ... ... ... ... Thailand... 0.6 ... ... ... ... ... ... Timor-Leste... ... ... ... ... ... ... ... Tokelau... ... ... ... ... ... ... ... Tonga... ... ... ... ... ... ... ... Tuvalu2.4 0.4 . . . . . 0.4 Vanuatu... ... ... ... ... ... ... ... Viet Nam... … ... … … ... ... . AnguillaLatin America and the Caribbean... ... ... ... ... ... ... ... Antigua and Barbuda1.9 -1 0.9 -1 0.7 -1 0.1 -1 0.1 -1 0.2 -1 0.2 -1 - -1 Argentina1.3 -1 0.6 -1 ... ... ... ... ... ... Aruba... ... ... ... ... ... ... ... Bahamas215
EXPENDITURE ON EDUCATION AS A PERCENTAGE OF GDP, BY SOURCES OF FUNDS /T a b l e14 Financial year ending in 2008RegionExpenditure on educational institutions and educational administrationas a % of gross domestic productAll sources of funds (public, private, international)Public sourcesCountry or territoryAll levels b, c Pre-primary(ISCED 0)Primary(ISCED 1)Secondary andpost-secondarynon-tertiary(ISCED 2-4)Tertiary(ISCED 5-6) All levels b Pre-primary(ISCED 0)Primary(ISCED 1)1 2 3 4 5 6 7 8Barbados 6.3 ... ... 2.3 1.6 5.8 - 1.7Belize ... ... ... ... ... 4.8 -1 - -1 2.5 -1Bermuda ... ... ... ... ... 1.2 -2 0.1 -2 0.6 -2Bolivia ... ... ... ... ... 6.1 -2 0.2 -2 **, -22.0Brazil 5.1 -1 0.4 -1 1.7 -1 2.2 -1 0.8 -1 5.1 -1 0.4 -1 1.7 -1British Virgin Islands 3.2 -1 - -1 0.9 -1 1.2 -1 1.1 -1 3.2 -1 - -1 0.9 -1Cayman Islands ... ... ... ... ... 2.6 -2 - -2 1.2 -2Chile 5.7 -1 0.5 -1 1.7 -1 1.8 -1 1.7 -1 3.1 -1 0.4 -1 1.2 -1Colombia 6.7 ... 1.8 2.3 1.8 3.9 ... 1.5Costa Rica ... ... ... ... ... 4.6 0.3 1.4Cuba 13.8 1.0 3.5 4.0 5.2 13.6 0.9 3.5Dominica 4.8 - 2.5 2.2 . 4.8 - 2.5Dominican Republic 4.0 -1 0.4 -1 2.4 -1 0.9 -1 0.3 -1 2.2 -1 0.1 -1 1.3 -1Ecuador ... ... ... ... ... ... ... ...El Salvador 4.0 0.4 1.5 0.9 ... 3.6 0.3 1.4Grenada ... ... ... ... ... ... ... ...Guatemala 5.5 0.6 2.2 1.4 0.9 3.1 0.3 1.6Guyana 7.4 -1 0.8 -1 2.6 -1 2.3 -1 0.7 -1 6.0 -1 0.7 -1 2.0 -1Haiti ... ... ... ... ... ... ... ...Honduras ... ... ... ... ... ... ... ...Jamaica 5.9 0.3 1.9 2.8 1.0 5.9 0.3 1.9Mexico 5.7 -1 0.6 -1 2.1 -1 1.7 -1 1.2 -1 4.6 -1 0.5 -1 1.8 -1Montserrat ... ... ... ... ... ... ... ...Netherlands Antilles ... ... ... ... ... ... ... ...Nicaragua ... ... ... ... ... ... ... ...Panama 3.7 0.2 1.0 0.8 0.9 3.6 0.1 1.0Paraguay 5.3 -1 0.3 -1 1.8 -1 1.7 **, -1 1.4 -1 3.9 -1 0.2 -1 1.6 -1Peru 4.4 0.4 1.4 1.5 1.2 2.7 0.3 1.1Saint Kitts and Nevis ... ... ... ... ... ... ... ...Saint Lucia ... ... ... ... ... 6.3 0.1 1.9Saint Vincent and the Grenadines ... ... ... ... ... 7.0 -1 - -1 3.6 -1Suriname ... ... ... ... ... ... ... ...Trinidad and Tobago ... ... ... ... ... ... 0.3 -1 0.8 -1Turks and Caicos Islands ... ... ... ... ... ... ... ...Uruguay ... ... ... ... ... 2.8 -2 0.2 -2 0.9 -2Venezuela ... ... ... ... ... 3.6 -1 0.3 -1 1.2 -1North America and Western EuropeAndorra ... ... ... ... ... 2.5 -1 0.5 -1 0.6 -1Austria 5.3 -1 0.5 -1 1.0 -1 2.6 -1 1.3 -1 4.8 -1 0.3 -1 0.9 -1Belgium 6.2 -1 0.6 -1 1.5 -1 2.7 -1 1.3 -1 5.8 -1 0.6 -1 1.4 -1Canada 6.2 -1 ... ... ... ... 4.6 -1 ... ...Cyprus 7.5 -1 0.4 -1 2.1 -1 3.5 -1 1.5 -1 6.1 -1 0.3 -1 2.0 -1Denmark 7.2 -2 0.7 -2 1.9 -2 2.5 -2 1.6 -2 6.6 -2 0.5 -2 1.9 -2Finland 5.7 -1 0.4 -1 1.2 -1 2.4 -1 1.6 -1 5.5 -1 0.3 -1 1.2 -1France 5.9 -2 0.7 -2 1.1 -2 2.8 -2 1.3 -2 5.4 -2 0.6 -2 1.1 -2Germany 4.8 -2 0.5 -2 0.7 -2 2.4 -2 1.1 -2 4.1 -2 0.4 -2 0.6 -2Gibraltar ... ... ... ... ... ... ... ...216
G l o b a l e d u c a t i o n d i g e s t 2 0 1 0 C o m p a r i n g e d u c a t i o n s t a t i s t i c s a r o u n d t h e w o r l dExpenditure on educational institutions and educational administrationas a % of gross domestic productPublic sources Private sourcesInternationalsourcesSecondary andpost-secondarynon-tertiary(ISCED 2-4)Tertiary(ISCED 5-6) All levels b Pre-primary(ISCED 0)Primary(ISCED 1)Secondary andpost-secondarynon-tertiary(ISCED 2-4)Tertiary(ISCED 5-6) All levels9 10 11 12 13 14 15 16Region2.1 1.5 0.1 ... ... 0.1 - 0.4 Barbados2.2 -1 - -1 ... ... ... ... ... ... Belize0.5 -2 - -2 ... ... ... ... ... ... Bermuda1.8 **, -2 1.5 -2 ... ... ... ... ... ... Bolivia2.2 -1 0.8 -1 ... ... ... ... ... ... BrazilCountry or territory1.2 -1 1.1 -1 - -1 - -1 - -1 - -1 - -1 - -1 British Virgin Islands1.4 -2 - -2 ... ... ... ... ... ... Cayman Islands1.3 -1 0.3 -1 2.5 -1 0.2 -1 0.4 -1 0.5 -1 1.4 -1 . -1 Chile1.6 0.9 2.8 ... 0.3 0.7 0.9 . Colombia1.0 1.1 ... ... ... ... ... - -1 Costa Rica4.0 5.2 0.1 0.1 0.1 - - - Cuba2.2 . . . . . . . Dominica0.4 -1 0.3 -1 1.9 -1 0.3 -1 1.1 -1 0.5 -1 . -1 0.1 -1 Dominican Republic... ... ... ... ... ... ... ... Ecuador0.8 ... 0.1 - - - ... 0.2 El Salvador... ... ... ... ... ... ... ... Grenada0.4 0.3 2.4 0.3 0.6 1.0 0.5 - Guatemala1.9 -1 0.3 -1 0.4 -1 . -1 . -1 . -1 0.4 -1 1.0 -1 Guyana... ... ... ... ... ... ... ... Haiti... ... ... ... ... ... ... ... Honduras2.8 1.0 ... ... ... ... ... ... Jamaica1.3 -1 0.9 -1 1.1 -1 0.1 -1 0.3 -1 0.4 -1 0.3 -1 - -1 Mexico... ... ... ... ... ... ... ... Montserrat... ... ... ... ... ... ... ... Netherlands Antilles... ... ... 0.1 -2 1.1 -2 1.3 -2 ... ... Nicaragua0.8 0.9 - - - - - 0.1 Panama1.4 -1 0.8 -1 1.3 -1 0.1 -1 0.3 -1 0.3 **, -1 0.6 -1 - -1 Paraguay0.9 0.4 1.7 0.1 0.3 0.6 0.8 . -1 Peru... ... ... ... ... ... ... ... Saint Kitts and Nevis2.3 ... ... ... ... ... ... ... Saint Lucia2.9 -1 0.4 -1 ... ... ... ... ... 0.8 -1 Saint Vincent and the Grenadines... ... ... ... ... ... ... ... Suriname0.7 -1 ... ... ... ... ... ... ... Trinidad and Tobago... ... ... ... ... ... ... ... Turks and Caicos Islands1.0 -2 0.6 -2 ... ... ... ... ... . -2 Uruguay0.6 -1 1.6 -1 ... ... ... ... ... ... Venezuela0.7 -1 0.1 -1 ... ... ... ... ... ... Andorra2.5 -1 1.1 -1 0.5 -1 0.1 -1 - -1 0.1 -1 0.2 -1 . -1 Austria2.5 -1 1.1 -1 0.3 -1 - -1 0.1 -1 0.1 -1 0.1 -1 - -1 Belgium... ... 1.6 -1 ... ... ... ... - -1 Canada3.1 -1 0.7 -1 1.3 -1 0.1 -1 0.1 -1 0.3 -1 0.7 -1 0.1 -1 Cyprus2.4 -2 1.6 -2 0.6 -2 0.2 -2 - -2 0.1 -2 0.1 -2 - -2 Denmark2.4 -1 1.6 -1 0.1 -1 - -1 - -1 - -1 0.1 -1 - -1 Finland2.5 -2 1.1 -2 0.5 -2 - -2 0.1 -2 0.2 -2 0.2 -2 - -2 France2.1 -2 0.9 -2 0.7 -2 0.1 -2 - -2 0.4 -2 0.2 -2 - -2 Germany... ... ... ... ... ... ... ... GibraltarNorth America and Western Europe217
EXPENDITURE ON EDUCATION AS A PERCENTAGE OF GDP, BY SOURCES OF FUNDS /T a b l e14 Financial year ending in 2008RegionExpenditure on educational institutions and educational administrationas a % of gross domestic productAll sources of funds (public, private, international)Public sourcesCountry or territoryAll levels b, c Pre-primary(ISCED 0)Primary(ISCED 1)Secondary andpost-secondarynon-tertiary(ISCED 2-4)Tertiary(ISCED 5-6) All levels b Pre-primary(ISCED 0)Primary(ISCED 1)1 2 3 4 5 6 7 8Greece ... ... ... ... ... ... ... ...Holy See ... ... ... ... ... ... ... ...Iceland 7.9 -1 0.9 -1 2.6 -1 2.6 -1 1.2 -1 7.2 -1 0.7 -1 2.6 -1Ireland 4.7 -2 - -2 1.7 -2 1.9 -2 1.2 -2 4.4 -1 - -1 1.7 -1Israel 7.9 -1 0.9 -1 2.5 -1 2.0 -1 1.8 -1 6.2 -1 0.7 -1 2.4 -1Italy 4.5 -1 0.5 -1 1.1 -1 2.0 -1 0.9 -1 4.1 -1 0.5 -1 1.1 -1Liechtenstein ... ... ... ... ... ... ... ...Luxembourg ... ... ... 1.5 -1 ... ... ... ...Malta ... ... ... ... ... ... ... ...Monaco ... ... ... ... ... ... ... ...Netherlands 5.7 -2 0.4 -2 1.4 -2 2.4 -2 1.5 -2 4.7 -2 0.4 -2 1.4 -2Norway ... ... ... ... ... 5.4 -1 0.3 -1 1.7 -1Portugal 5.6 -2 0.4 -2 1.6 -2 2.1 -2 1.4 -2 5.1 -2 0.4 -2 1.6 -2San Marino ... ... ... ... ... ... ... ...Spain ... ... ... ... ... 4.2 -1 0.6 -1 1.1 -1Sweden 6.2 -1 0.6 -1 1.7 -1 2.4 -1 1.6 -1 6.0 -1 0.6 -1 1.7 -1Switzerland 5.7 -1 0.2 -1 1.5 -1 2.6 -1 1.3 -1 5.1 -1 0.2 -1 1.5 -1United Kingdom 6.0 -1 0.3 -1 1.8 -1 2.5 -1 1.3 -1 4.1 -1 0.2 -1 1.6 -1United States of America 8.0 -1 0.5 -1 2.0 -1 2.2 -1 3.3 -1 5.3 -1 0.4 -1 1.8 -1South and West AsiaAfghanistan ... ... ... ... ... ... ... ...Bangladesh ... ... ... ... ... 2.2 - 0.9Bhutan ... ... ... ... ... ... ... ...India ... ... ... ... ... 3.2 -2 - -2 1.1 -2Iran (Islamic Republic of) ... ... ... ... ... 4.8 - 1.3Maldives ... ... ... ... ... 8.1 0.8 4.1Nepal ... ... ... ... ... 3.8 ... 2.4Pakistan ... ... ... ... ... 2.9 ... ...Sri Lanka ... ... ... ... ... ... ... ...Sub-Saharan AfricaAngola ... ... ... ... ... 2.6 -2 0.4 -2 0.8 -2Benin 5.4 -1 0.1 -1 2.7 -1 1.8 -1 0.8 -1 3.3 -1 0.1 -1 2.0 -1Botswana ... ... ... ... ... 6.9 -1 - -1 2.2 -1Burkina Faso 5.9 -1 ... 3.7 -1 1.5 -1 0.6 -1 4.4 -1 ... 3.1 -1Burundi 10.6 0.3 6.2 2.7 1.1 6.0 - 3.7Cameroon ... ... ... ... ... ... ... ...Cape Verde 6.8 -1 0.2 -1 2.4 -1 2.9 -1 ... 5.3 - 2.1Central African Republic ... ... ... ... ... 1.3 -1 - -1 0.6 -1Chad ... ... ... ... ... ... ... ...Comoros ... ... ... ... ... 7.6 - 4.7Congo ... ... ... ... ... ... ... ...Côte d’Ivoire ... ... ... ... ... ... ... ...Democratic Republic of the Congo ... ... ... ... ... ... ... ...Equatorial Guinea ... ... ... ... ... ... ... ...Eritrea ... ... ... ... ... 2.0 -2 . -2 0.6 -2Ethiopia ... ... ... ... ... 5.5 -1 - -1 2.0 -1Gabon ... ... ... ... ... ... ... ...218
G l o b a l e d u c a t i o n d i g e s t 2 0 1 0 C o m p a r i n g e d u c a t i o n s t a t i s t i c s a r o u n d t h e w o r l dExpenditure on educational institutions and educational administrationas a % of gross domestic productPublic sources Private sourcesInternationalsourcesSecondary andpost-secondarynon-tertiary(ISCED 2-4)Tertiary(ISCED 5-6) All levels b Pre-primary(ISCED 0)Primary(ISCED 1)Secondary andpost-secondarynon-tertiary(ISCED 2-4)Tertiary(ISCED 5-6) All levels9 10 11 12 13 14 15 16... ... ... ... ... ... ... ... GreeceRegion... ... ... ... ... ... ... ... Holy See2.4 -1 1.1 -1 0.8 -1 0.3 -1 - -1 0.2 -1 0.1 -1 - -1 Iceland1.7 -1 1.0 -1 0.3 -2 ... ... ... 0.2 -2 - -1 Ireland1.7 -1 0.9 -1 1.8 -1 0.2 -1 0.1 -1 0.3 -1 0.9 -1 - -1 Israel1.9 -1 0.6 -1 0.4 -1 - -1 - -1 0.1 -1 0.3 -1 - -1 ItalyCountry or territory... ... ... ... ... ... ... ... Liechtenstein1.5 -1 ... ... ... ... ... ... ... Luxembourg... ... ... ... ... ... ... ... Malta... ... ... ... ... ... ... ... Monaco1.9 -2 1.1 -2 0.9 -2 - -2 - -2 0.5 -2 0.4 -2 - -2 Netherlands2.0 -1 1.2 -1 ... ... ... ... ... - -1 Norway2.1 -2 0.9 -2 0.4 -2 - -2 - -2 - -2 0.4 -2 - -2 Portugal... ... ... ... ... ... ... ... San Marino1.6 -1 0.9 -1 ... ... ... ... ... - -1 Spain2.4 -1 1.3 -1 0.2 -1 - -1 - -1 - -1 0.2 -1 0.1 -1 Sweden2.0 -1 1.3 -1 ... ... ... ... ... - -1 Switzerland1.8 -1 0.5 -1 1.8 -1 - -1 0.2 -1 0.8 -1 0.8 -1 0.1 -1 United Kingdom2.0 -1 1.0 -1 2.7 -1 0.1 -1 0.2 -1 0.2 -1 2.2 -1 - -1 United States of AmericaSouth and West Asia... ... ... ... ... ... ... ... Afghanistan0.9 0.3 ... ... ... ... ... 0.2 Bangladesh... ... ... ... ... ... ... ... Bhutan1.4 -2 0.6 -2 ... ... ... ... ... ... India2.4 1.0 ... ... ... ... ... ... Iran (Islamic Republic of)3.2 - ... ... ... ... ... ... Maldives0.9 0.5 ... ... ... ... ... ... Nepal... ... ... ... ... ... ... ... Pakistan... ... ... ... ... ... ... ... Sri Lanka1.1 -2 0.2 -2 ... ... ... ... ... ... Angola0.7 -1 0.5 -1 2.0 -1 0.1 -1 0.6 -1 1.1 -1 0.3 -1 ... Benin3.6 -1 1.0 -1 ... ... ... ... ... ... BotswanaSub-Saharan Africa0.8 -1 0.5 -1 1.5 -1 - -1 0.6 -1 0.8 -1 0.1 -1 ... Burkina Faso1.2 0.9 0.7 0.1 - 0.5 - 3.9 Burundi... ... ... ... ... ... ... ... Cameroon2.2 0.3 0.4 -1 0.2 -1 - -1 0.1 -1 0.1 -1 - Cape Verde0.4 -1 0.3 -1 ... ... ... ... ... ... Central African Republic... ... ... ... ... ... ... ... Chad1.8 1.1 ... ... ... ... ... ... Comoros... ... ... ... ... ... ... ... Congo... ... ... ... ... ... ... ... Côte d’Ivoire... ... ... ... ... ... ... ... Democratic Republic of the Congo... ... ... ... ... ... ... ... Equatorial Guinea0.5 -2 0.4 -2 ... ... ... ... ... ... Eritrea0.8 -1 2.1 -1 ... ... ... ... ... - -1 Ethiopia... ... ... ... ... ... ... ... Gabon219
EXPENDITURE ON EDUCATION AS A PERCENTAGE OF GDP, BY SOURCES OF FUNDS /T a b l e14 Financial year ending in 2008RegionExpenditure on educational institutions and educational administrationas a % of gross domestic productAll sources of funds (public, private, international)Public sourcesCountry or territoryAll levels b, c Pre-primary(ISCED 0)Primary(ISCED 1)Secondary andpost-secondarynon-tertiary(ISCED 2-4)Tertiary(ISCED 5-6) All levels b Pre-primary(ISCED 0)Primary(ISCED 1)1 2 3 4 5 6 7 8Gambia ... ... ... ... ... ... ... ...Ghana ... ... ... ... ... ... - -2 2.5 -2Guinea 2.6 - 1.7 0.3 0.4 1.5 - 0.7Guinea-Bissau ... ... ... ... ... ... ... ...Kenya ... ... ... ... ... 7.0 -2 - -2 3.8 -2Lesotho ... ... ... ... ... 8.8 - 4.5Liberia ... ... ... ... ... ... ... 0.8 -1Madagascar ... ... ... ... ... 2.6 - 1.4Malawi ... ... ... ... ... ... ... ...Mali ... ... ... ... ... 3.4 0.1 1.5Mauritius ... ... ... ... ... 3.4 +1 0.1 +1 0.9 +1Mozambique ... ... ... ... ... 5.0 -2 - -2 2.9 -2Namibia ... ... ... ... ... 6.4 - 3.1Niger 4.0 - 2.9 0.8 0.3 3.6 - 2.6Nigeria ... ... ... ... ... ... ... ...Rwanda ... ... ... ... ... 4.1 ... 1.9Sao Tome and Principe ... ... ... ... ... ... ... ...Senegal ... ... ... ... ... ... ... ...Seychelles ... ... ... ... ... 4.3 -2 0.2 -2 ...Sierra Leone ... ... ... ... ... ... ... ...Somalia ... ... ... ... ... ... ... ...South Africa ... ... ... ... ... 5.4 +1 - +1 2.2 +1Swaziland ... ... ... ... ... ... ... ...Togo ... ... ... ... ... 3.5 -1 - -1 1.5 -1Uganda ... ... ... ... ... ... ... ...United Republic of Tanzania ... ... ... ... ... 6.8 - 4.6Zambia ... ... ... ... ... 1.3 ... ...Zimbabwe ... ... ... ... ... ... ... ...b Includes expenditure not allocated by level.c For the indicators, international sources are not disaggregated by level of education.Please refer to the Reader’s Guide for more information on the data and symbols used in each table.220
G l o b a l e d u c a t i o n d i g e s t 2 0 1 0 C o m p a r i n g e d u c a t i o n s t a t i s t i c s a r o u n d t h e w o r l dExpenditure on educational institutions and educational administrationas a % of gross domestic productPublic sources Private sourcesInternationalsourcesSecondary andpost-secondarynon-tertiary(ISCED 2-4)Tertiary(ISCED 5-6) All levels b Pre-primary(ISCED 0)Primary(ISCED 1)Secondary andpost-secondarynon-tertiary(ISCED 2-4)Tertiary(ISCED 5-6) All levels9 10 11 12 13 14 15 16Region... ... ... ... ... ... ... ... Gambia2.1 -2 ... ... ... ... ... ... - -2 Ghana0.3 0.4 ... ... ... ... ... 1.0 GuineaCountry or territory... ... ... ... ... ... ... ... Guinea-Bissau1.8 -2 1.1 -2 ... ... ... ... ... ... Kenya2.6 1.5 ... ... ... ... ... ... Lesotho0.3 -1 0.4 -1 ... ... ... ... ... ... Liberia0.7 0.3 ... ... ... ... ... 0.7 Madagascar... ... ... ... ... ... ... ... Malawi1.6 0.3 ... ... ... ... ... ... Mali1.8 +1 0.3 +1 ... ... ... ... ... ... Mauritius1.5 -2 0.6 -2 ... ... ... ... ... ... Mozambique1.4 0.6 ... ... ... ... ... ... Namibia0.8 0.3 0.1 - 0.1 - - 0.3 Niger... ... ... ... ... ... ... ... Nigeria1.1 1.0 ... ... ... ... ... ... Rwanda... ... ... ... ... ... ... ... Sao Tome and Principe... ... ... ... ... ... ... ... Senegal... 0.1 -2 ... ... ... ... ... ... Seychelles... ... ... ... ... ... ... ... Sierra Leone... ... ... ... ... ... ... ... Somalia1.8 +1 0.6 +1 . +1 . +1 . +1 . +1 . +1 - +1 South Africa... ... ... ... ... ... ... ... Swaziland1.2 -1 0.5 -1 ... ... ... ... ... ... Togo... ... ... ... ... ... ... ... Uganda0.8 1.5 ... ... ... ... ... 0.1 United Republic of Tanzania... ... ... ... ... ... ... - -1 Zambia... ... ... ... ... ... ... ... Zimbabwe221
T a b l e15 ADULT AND YOUTH LITERACYRegionCountry or territoryArab States<strong>Reference</strong> yearAdults (15 years and older)Youth (15 to 24 years)Literacy rate Illiterate population Literacy rate Illiterate populationMF M F GPI MF (000) % F MF M F GPI MF (000) % F1 2 3 4 5 6 7 8 9 10 11 12Algeria (o) 2006 72.6 81.3 63.9 0.79 6,484 65.7 91.8 94.4 89.1 0.94 609 65.0Bahrain 2008 90.8 91.7 89.4 0.97 52 46.2 99.7 99.8 99.7 1.00 0.3 56.4Djibouti … … … … … … … … … … … … …Egypt (o) 2006 66.4 74.6 57.8 0.77 17,816 62.5 84.9 87.9 81.8 0.93 2,597 59.3Iraq 2008 77.6 86.0 69.2 0.80 3,954 68.8 82.4 84.5 80.2 0.95 1,048 54.8Jordan (o) 2007 92.2 95.5 88.9 0.93 294 69.9 98.9 99.0 98.9 1.00 13 48.8Kuwait (o) 2007 94.5 95.2 93.1 0.98 122 45.8 98.4 98.4 98.5 1.00 7 43.7Lebanon (o) 2007 89.6 93.4 86.0 0.92 320 69.4 98.7 98.4 99.1 1.01 10 35.9Libyan Arab Jamahiriya 2008 88.4 94.9 81.3 0.86 511 77.2 99.8 99.9 99.7 1.00 2 74.2Mauritania 2008 56.8 64.1 49.5 0.77 836 58.3 67.0 70.5 63.4 0.90 214 54.0Morocco 2008 56.4 69.4 44.1 0.64 9,823 66.0 76.6 84.8 68.4 0.81 1,508 67.6Oman (o) 2008 86.7 90.0 80.9 0.90 260 57.1 97.6 97.6 97.6 1.00 14 47.2Palestinian Autonomous Territories (o) 2008 94.1 97.1 90.9 0.94 135 75.6 99.2 99.3 99.0 1.00 7 55.8Qatar (o) 2007 93.1 93.8 90.4 0.96 65 28.6 99.1 99.1 99.0 1.00 2 26.2Saudi Arabia 2008 85.5 89.5 80.2 0.90 2,450 58.6 97.3 98.4 96.2 0.98 127 69.8Sudan 2008 69.3 79.0 59.6 0.75 7,676 65.8 85.2 88.6 81.7 0.92 1,235 60.9Syrian Arab Republic 2008 83.6 90.0 77.2 0.86 2,248 69.4 94.1 95.6 92.5 0.97 272 62.3Tunisia (o) 2008 77.6 86.4 71.0 0.82 1,656 68.2 96.8 98.1 95.8 0.98 62 68.3United Arab Emirates (o) 2005 90.0 89.5 91.5 1.02 327 23.9 95.0 93.6 97.0 1.04 34 24.0Yemen 2008 60.9 78.9 42.8 0.54 4,993 72.8 82.9 95.1 70.0 0.74 868 85.4Central and Eastern EuropeAlbania 2008 99.0 99.3 98.7 0.99 24 66.2 99.4 99.3 99.5 1.00 4 40.8Belarus 2008 99.7 99.8 99.7 1.00 21 64.1 99.8 99.7 99.8 1.00 4 39.0Bosnia and Herzegovina 2008 97.6 99.4 95.9 0.96 78 88.3 99.2 99.7 98.7 0.99 4 80.8Bulgaria 2008 98.3 98.6 97.9 0.99 116 62.0 97.3 97.3 97.3 1.00 26 48.8Croatia 2008 98.7 99.5 98.0 0.98 48 81.5 99.6 99.6 99.7 1.00 2 41.9Czech Republic … … … … … … … … … … … …Estonia 2008 99.8 99.8 99.8 1.00 2 54.8 99.8 99.7 99.8 1.00 1 38.9Hungary 2008 99.0 99.1 98.9 1.00 86 58.2 98.6 98.3 99.0 1.01 17 36.1Latvia 2008 99.8 99.8 99.8 1.00 4 54.8 99.7 99.7 99.7 1.00 1 49.0Lithuania 2008 99.7 99.7 99.7 1.00 8 54.1 99.8 99.8 99.8 1.00 1 48.9Montenegro … … … … … … … … … … … … …Poland 2008 99.5 99.7 99.3 1.00 165 71.9 99.8 99.8 99.9 1.00 9 32.4Republic of Moldova 2008 98.3 99.0 97.8 0.99 49 71.4 99.5 99.3 99.7 1.00 3 30.2Romania 2008 97.6 98.3 96.9 0.99 439 66.3 97.3 97.1 97.5 1.00 83 45.3Russian Federation 2008 99.5 99.7 99.4 1.00 559 70.7 99.7 99.6 99.8 1.00 68 32.6Serbia 2008 97.6 99.1 96.2 0.97 192 81.5 99.3 99.3 99.3 1.00 10 48.8Slovakia … … … … … … … … … … … … …Slovenia 2008 99.7 99.7 99.7 1.00 5 51.6 99.8 99.8 99.9 1.00 0.4 32.2222
G l o b a l e d u c a t i o n d i g e s t 2 0 1 0 C o m p a r i n g e d u c a t i o n s t a t i s t i c s a r o u n d t h e w o r l dRegionCountry or territory<strong>Reference</strong> yearAdults (15 years and older)Youth (15 to 24 years)Literacy rate Illiterate population Literacy rate Illiterate populationMF M F GPI MF (000) % F MF M F GPI MF (000) % F1 2 3 4 5 6 7 8 9 10 11 12The former Yugoslav Rep. of Macedonia 2008 97.0 98.6 95.4 0.97 50 77.0 98.7 98.9 98.5 1.00 4 56.3Turkey (o) 2007 88.7 96.2 81.3 0.84 5,951 83.1 96.4 98.6 94.3 0.96 470 79.6Ukraine 2008 99.7 99.8 99.6 1.00 122 70.7 99.8 99.7 99.8 1.00 17 39.0Central AsiaArmenia 2008 99.5 99.7 99.4 1.00 11 71.1 99.8 99.7 99.8 1.00 1 40.0Azerbaijan (o) 2007 99.5 99.8 99.2 0.99 33 81.1 100.0 100.0 100.0 1.00 n nGeorgia 2008 99.7 99.8 99.7 1.00 9 63.8 99.8 99.8 99.9 1.00 1 33.2Kazakhstan 2008 99.7 99.8 99.5 1.00 43 74.2 99.8 99.8 99.9 1.00 5 32.6Kyrgyzstan 2008 99.3 99.5 99.1 1.00 27 65.6 99.6 99.5 99.7 1.00 5 36.9Mongolia 2008 97.3 96.7 97.8 1.01 53 41.0 95.3 93.3 97.2 1.04 29 29.3Tajikistan 2008 99.7 99.8 99.5 1.00 15 72.7 99.9 99.9 99.9 1.00 2 49.8Turkmenistan 2008 99.5 99.7 99.3 1.00 18 71.1 99.8 99.8 99.9 1.00 2 32.9Uzbekistan 2008 99.2 99.5 98.9 0.99 153 69.4 99.8 99.8 99.7 1.00 15 59.3East Asia and the PacificAustralia … … … … … … … … … … … … …Brunei Darussalam 2008 95.0 96.6 93.3 0.97 14 64.9 99.7 99.7 99.6 1.00 0.2 55.8Cambodia (o) 2008 77.6 85.1 70.9 0.83 2,143 68.1 87.5 89.4 85.5 0.96 436 57.0China 2008 93.7 96.7 90.5 0.94 67,239 73.3 99.3 99.4 99.2 1.00 1,610 54.6Cook Islands … … … … … … … … … … … … …Democratic People’s Rep. of Korea (o) 2008 100.0 100.0 100.0 1.00 0.3 70.7 100.0 100.0 100.0 1.00 0.01 33.4Fiji … … … … … … … … … … … … …Hong Kong SAR of China … … … … … … … … … … … …Indonesia (o) 2006 92.0 95.2 88.8 0.93 12,864 70.2 96.7 97.0 96.3 0.99 1,387 55.1Japan … … … … … … … … … … … … …Kiribati … … … … … … … … … … … … …Lao People’s Democratic Republic (o) 2005 72.7 82.5 63.2 0.77 961 68.5 83.9 89.2 78.7 0.88 197 66.0Macao, China (o) 2006 93.5 96.5 90.7 0.94 28 74.6 99.6 99.6 99.7 1.00 0.3 43.9Malaysia 2008 92.1 94.3 89.8 0.95 1,500 63.6 98.4 98.3 98.5 1.00 82 46.1Marshall Islands … … … … … … … … … … … … …Micronesia (Federated States of) … … … … … … … … … … … … …Myanmar 2008 91.9 94.7 89.2 0.94 2,942 68.5 95.6 96.0 95.1 0.99 415 55.3Nauru … … … … … … … … … … … … …New Zealand … … … … … … … … … … … … …Niue … … … … … … … … … … … … …Palau … … … … … … … … … … … … …Papua New Guinea 2008 59.6 63.6 55.6 0.87 1,592 54.7 66.5 64.6 68.5 1.06 426 45.8Philippines 2008 93.6 93.3 93.9 1.01 3,800 47.7 94.8 93.9 95.7 1.02 946 40.5Republic of Korea … … … … … … … … … … … … …Samoa 2008 98.7 99.0 98.5 0.99 1 57.8 99.5 99.4 99.5 1.00 0.2 42.5Singapore 2008 94.5 97.4 91.6 0.94 210 76.4 99.8 99.7 99.8 1.00 2 38.3223
T a b l e15 ADULT AND YOUTH LITERACYRegionCountry or territory<strong>Reference</strong> yearAdults (15 years and older)Youth (15 to 24 years)Literacy rate Illiterate population Literacy rate Illiterate populationMF M F GPI MF (000) % F MF M F GPI MF (000) % F1 2 3 4 5 6 7 8 9 10 11 12Solomon Islands … … … … … … … … … … … … …Thailand (o) 2005 93.5 95.6 91.5 0.96 3,298 67.0 98.1 98.2 97.9 1.00 210 53.4Timor-Leste … … … … … … … … … … … … …Tokelau … … … … … … … … … … … … …Tonga (o) 2006 99.0 99.0 99.1 1.00 1 46.8 99.4 99.3 99.6 1.00 0.1 37.2Tuvalu … … … … … … … … … … … … …Vanuatu 2008 81.3 83.0 79.5 0.96 27 54.0 93.6 93.5 93.7 1.00 3 47.6Viet Nam 2008 92.5 95.1 90.2 0.95 4,749 67.9 96.8 97.2 96.3 0.99 556 55.6Latin America and the CaribbeanAnguilla … … … … … … … … … … … … …Antigua and Barbuda (e) 2008 99.0 98.4 99.4 1.01 … … … … … … … …Argentina 2008 97.7 97.6 97.7 1.00 699 50.5 99.1 99.0 99.3 1.00 57 40.5Aruba 2008 98.1 98.2 98.0 1.00 2 55.3 99.3 99.2 99.4 1.00 0.1 42.8Bahamas … … … … … … … … … … … … …Barbados … … … … … … … … … … … … …Belize … … … … … … … … … … … … …Bermuda … … … … … … … … … … … … …Bolivia (o) 2007 90.7 96.0 86.0 0.90 542 78.5 99.4 99.8 99.1 0.99 10 77.2Brazil (o) 2007 90.0 89.8 90.2 1.01 13,915 50.2 97.8 97.1 98.6 1.02 765 32.3British Virgin Islands … … … … … … … … … … … … …Cayman Islands (o) 2007 98.9 98.7 99.0 1.00 … … 98.9 99.1 98.6 0.99 … …Chile (o) 2008 98.6 98.6 98.7 1.00 174 49.2 99.2 99.1 99.2 1.00 25 46.8Colombia (o) 2008 93.4 93.3 93.4 1.00 2,100 51.1 98.0 97.5 98.4 1.01 168 38.5Costa Rica 2008 96.0 95.7 96.2 1.01 135 46.3 98.1 97.7 98.6 1.01 16 36.5Cuba 2008 99.8 99.8 99.8 1.00 18 50.1 100.0 100.0 100.0 1.00 n nDominica … … … … … … … … … … … … …Dominican Republic (o) 2007 88.2 88.2 88.3 1.00 782 49.9 95.8 94.6 96.9 1.02 79 36.2Ecuador (o) 2007 84.2 87.3 81.7 0.94 1,413 59.3 95.4 95.2 95.6 1.00 116 47.1El Salvador (o) 2008 84.0 87.1 81.4 0.93 660 63.4 96.0 95.4 96.5 1.01 49 44.8Grenada … … … … … … … … … … … … …Guatemala 2008 73.8 79.5 68.7 0.86 2,070 62.9 86.0 88.5 83.6 0.94 386 59.5Guyana … … … … … … … … … … … … …Haiti … … … … … … … … … … … … …Honduras (o) 2007 83.6 83.7 83.5 1.00 722 51.2 93.9 92.7 95.1 1.03 93 40.3Jamaica 2008 85.9 80.6 90.8 1.13 268 33.7 95.0 91.8 98.2 1.07 25 17.8Mexico (o) 2008 92.9 94.6 91.5 0.97 5,407 62.5 98.4 98.4 98.4 1.00 318 51.6Montserrat … … … … … … … … … … … … …Netherlands Antilles 2008 96.3 96.3 96.3 1.00 6 54.6 98.3 98.3 98.4 1.00 0.4 49.0Nicaragua (o) 2005 78.0 78.1 77.9 1.00 747 51.3 87.0 85.2 88.8 1.04 154 42.9Panama 2008 93.5 94.1 92.8 0.99 157 54.8 96.4 96.6 96.2 1.00 21 51.9224
G l o b a l e d u c a t i o n d i g e s t 2 0 1 0 C o m p a r i n g e d u c a t i o n s t a t i s t i c s a r o u n d t h e w o r l dRegionCountry or territory<strong>Reference</strong> yearAdults (15 years and older)Youth (15 to 24 years)Literacy rate Illiterate population Literacy rate Illiterate populationMF M F GPI MF (000) % F MF M F GPI MF (000) % F1 2 3 4 5 6 7 8 9 10 11 12Paraguay (o) 2007 94.6 95.7 93.5 0.98 216 60.1 98.8 98.8 98.8 1.00 15 49.9Peru (o) 2007 89.6 94.9 84.6 0.89 2,016 75.1 97.4 98.0 96.7 0.99 145 61.8Saint Kitts and Nevis … … … … … … … … … … … … …Saint Lucia … … … … … … … … … … … … …Saint Vincent and the Grenadines … … … … … … … … … … … … …Suriname 2008 90.7 93.0 88.4 0.95 34 62.5 95.3 95.7 94.8 0.99 4 54.1Trinidad and Tobago 2008 98.7 99.1 98.2 0.99 14 68.4 99.5 99.5 99.5 1.00 1 49.5Turks and Caicos Islands … … … … … … … … … … … … …Uruguay (o) 2008 98.2 97.8 98.5 1.01 47 44.0 99.0 98.6 99.3 1.01 5 32.4Venezuela (o) 2007 95.2 95.4 94.9 1.00 931 52.5 98.4 98.0 98.8 1.01 85 35.8North America and Western EuropeAndorra … … … … … … … … … … … … …Austria … … … … … … … … … … … … …Belgium … … … … … … … … … … … … …Canada … … … … … … … … … … … … …Cyprus 2008 97.8 99.0 96.7 0.98 15 78.1 99.9 99.8 99.9 1.00 0.2 32.2Denmark … … … … … … … … … … … … …Finland … … … … … … … … … … … … …France … … … … … … … … … … … … …Germany … … … … … … … … … … … … …Gibraltar … … … … … … … … … … … … …Greece 2008 97.0 98.2 95.9 0.98 283 70.1 99.3 99.4 99.3 1.00 8 52.1Holy See … … … … … … … … … … … … …Iceland … … … … … … … … … … … … …Ireland … … … … … … … … … … … … …Israel … … … … … … … … … … … … …Italy 2008 98.8 99.1 98.5 0.99 619 64.2 99.9 99.9 99.9 1.00 6 48.6Liechtenstein … … … … … … … … … … … … …Luxembourg … … … … … … … … … … … … …Malta (o) 2005 92.4 91.2 93.5 1.03 25 43.1 98.3 97.5 99.1 1.02 1 25.0Monaco … … … … … … … … … … … … …Netherlands … … … … … … … … … … … … …Norway … … … … … … … … … … … … …Portugal 2008 94.6 96.5 92.9 0.96 486 68.8 99.7 99.7 99.7 1.00 4 49.0San Marino … … … … … … … … … … … …Spain (o,d) 2008 97.6 98.4 96.9 0.98 900 67.1 99.6 99.5 99.6 1.00 21 44.4Sweden … … … … … … … … … … … … …Switzerland … … … … … … … … … … … … …United Kingdom … … … … … … … … … … … … …United States of America … … … … … … … … … … … … …225
T a b l e15 ADULT AND YOUTH LITERACYRegionCountry or territorySouth and West Asia<strong>Reference</strong> yearAdults (15 years and older)Youth (15 to 24 years)Literacy rate Illiterate population Literacy rate Illiterate populationMF M F GPI MF (000) % F MF M F GPI MF (000) % F1 2 3 4 5 6 7 8 9 10 11 12Afghanistan … … … … … … … … … … … … …Bangladesh 2008 55.0 60.0 49.8 0.83 48,990 55.2 74.4 73.3 75.5 1.03 8,441 47.0Bhutan (o) 2005 52.8 65.0 38.7 0.59 202 60.3 74.4 80.0 68.0 0.85 38 58.5India (o) 2006 62.8 75.2 50.8 0.68 283,105 65.1 81.1 88.4 74.4 0.84 40,682 67.0Iran, Islamic Republic of (o) 2006 82.3 87.3 77.2 0.89 9,402 63.4 96.6 97.1 96.1 0.99 614 57.2Maldives (o) 2006 98.4 98.4 98.4 1.00 3 48.5 99.3 99.2 99.4 1.00 1 44.8Nepal 2008 57.9 71.1 45.4 0.64 7,614 66.6 80.8 86.2 75.0 0.87 1,139 63.3Pakistan (o) 2008 53.7 66.8 40.0 0.60 51,236 63.0 68.9 78.5 58.8 0.75 11,626 64.4Sri Lanka (o) 2008 90.6 92.2 89.1 0.97 1,425 59.7 98.0 97.3 98.6 1.01 71 34.0Sub-Saharan AfricaAngola 2008 69.6 82.8 57.0 0.69 2,997 72.3 72.9 80.8 65.2 0.81 993 64.8Benin 2008 40.8 53.5 28.1 0.53 2,911 60.7 53.3 64.1 42.1 0.66 791 60.9Botswana 2008 83.3 83.1 83.5 1.00 213 49.7 95.1 93.8 96.3 1.03 21 37.1Burkina Faso (o) 2007 28.7 36.7 21.6 0.59 5,646 56.2 39.3 46.7 33.1 0.71 1,772 54.9Burundi 2008 65.9 72.3 59.9 0.83 1,681 60.8 75.9 76.5 75.3 0.98 452 51.4Cameroon 2008 75.9 84.0 67.8 0.81 2,715 67.1 85.8 88.2 83.5 0.95 565 58.1Cape Verde 2008 84.1 89.6 79.3 0.89 50 69.8 98.0 97.2 98.9 1.02 2 28.4Central African Republic 2008 54.6 68.8 41.1 0.60 1,165 66.6 64.2 72.1 56.4 0.78 315 61.4Chad 2008 32.7 43.8 21.9 0.50 3,981 58.9 45.4 53.5 37.2 0.70 1,176 57.4Comoros 2008 73.6 79.3 67.8 0.85 108 61.0 84.9 85.7 84.1 0.98 20 52.2Congo (o) 2005 … … … … … … 80.5 86.8 78.0 0.90 126 62.2Côte d’Ivoire 2008 54.6 64.2 44.3 0.69 5,534 59.4 66.1 72.0 60.1 0.83 1,392 58.7Democratic Republic of the Congo 2008 66.6 77.5 56.1 0.72 11,385 66.9 65.3 68.8 61.8 0.90 4,462 55.1Equatorial Guinea 2008 93.0 96.9 89.1 0.92 27 78.4 97.8 97.6 98.1 1.01 3 44.3Eritrea 2008 65.3 77.0 54.5 0.71 998 68.0 87.8 91.1 84.4 0.93 126 64.0Ethiopia (e) 2008 35.9 50.0 22.8 0.46 28,902 61.3 49.9 62.2 38.5 0.62 8,117 61.9Gabon 2008 87.0 90.9 83.2 0.92 119 65.2 97.4 98.4 96.4 0.98 8 68.9Gambia 2008 45.3 56.7 34.3 0.60 522 61.2 64.1 70.1 58.1 0.83 111 58.4Ghana 2008 65.8 72.3 59.3 0.82 4,888 59.1 79.3 80.6 77.9 0.97 987 52.3Guinea 2008 38.0 49.6 26.4 0.53 3,476 59.2 58.7 66.5 50.6 0.76 803 58.7Guinea-Bissau 2008 51.0 66.1 36.5 0.55 442 66.0 69.6 77.6 61.6 0.79 87 63.2Kenya 2008 86.5 90.3 82.8 0.92 2,989 64.2 92.3 91.8 92.9 1.01 634 46.3Lesotho 2008 89.5 82.6 95.1 1.15 131 25.5 91.9 85.6 98.0 1.14 39 12.5Liberia 2008 58.1 63.3 53.0 0.84 908 57.0 74.8 70.1 79.5 1.13 189 40.7Madagascar (e) 2008 70.7 76.5 65.3 0.85 3,160 60.1 70.2 72.7 68.2 0.94 1,109 53.8Malawi 2008 72.8 80.2 65.8 0.82 2,159 64.3 85.7 86.5 85.0 0.98 414 52.5Mali (o) 2006 26.2 34.9 18.2 0.52 4,966 57.2 38.8 47.4 30.8 0.65 1,553 56.7Mauritius 2008 87.5 90.4 84.8 0.94 122 62.1 96.4 95.4 97.4 1.02 7 35.5Mozambique 2008 54.0 69.5 40.1 0.58 5,759 68.6 69.9 77.7 62.1 0.80 1,316 63.0226
G l o b a l e d u c a t i o n d i g e s t 2 0 1 0 C o m p a r i n g e d u c a t i o n s t a t i s t i c s a r o u n d t h e w o r l dRegionCountry or territory<strong>Reference</strong> yearAdults (15 years and older)Youth (15 to 24 years)Literacy rate Illiterate population Literacy rate Illiterate populationMF M F GPI MF (000) % F MF M F GPI MF (000) % F1 2 3 4 5 6 7 8 9 10 11 12Namibia 2008 88.2 88.7 87.7 0.99 158 53.4 92.9 91.1 94.8 1.04 32 36.8Niger (o) 2005 28.7 42.9 15.1 0.35 4,767 60.8 36.5 52.4 23.2 0.44 1,490 64.5Nigeria 2008 60.1 71.5 48.8 0.68 34,603 64.6 71.5 78.3 64.6 0.83 8,672 61.6Rwanda 2008 70.3 74.8 66.1 0.88 1,672 59.8 77.1 77.1 77.1 1.00 509 50.6Sao Tome and Principe 2008 88.3 93.5 83.3 0.89 11 72.9 95.2 94.7 95.6 1.01 2 44.8Senegal (o) 2006 41.9 52.3 33.0 0.63 3,721 59.4 50.9 58.1 44.5 0.77 1,178 56.9Seychelles (e) 2008 91.8 91.4 92.3 1.01 … … 99.1 98.8 99.4 1.01 … …Sierra Leone 2008 39.8 51.7 28.9 0.56 1,899 61.6 55.7 66.0 45.9 0.70 479 62.6Somalia … … … … … … … … … … … … …South Africa 2008 89.0 89.9 88.1 0.98 3,790 55.3 96.8 96.1 97.5 1.01 322 38.9Swaziland 2008 86.5 87.4 85.6 0.98 95 55.4 93.2 91.8 94.7 1.03 19 39.3Togo 2008 64.9 76.6 53.7 0.70 1,353 67.2 83.5 87.0 80.0 0.92 220 60.8Uganda 2008 74.6 82.4 66.8 0.81 4,107 65.6 87.3 89.1 85.5 0.96 820 56.9United Republic of Tanzania 2008 72.6 79.0 66.3 0.84 6,448 62.2 77.5 78.7 76.3 0.97 1,909 52.6Zambia 2008 70.7 80.6 61.0 0.76 1,987 67.2 74.8 82.1 67.5 0.82 641 64.4Zimbabwe 2008 91.4 94.4 88.8 0.94 638 69.2 98.9 98.3 99.4 1.01 36 26.4REGIONAL AVERAGESWorld 83.4 88.2 78.9 0.90 796,165 64.1 89.0 91.7 86.4 0.94 130,584 60.7Arab States 72.4 81.2 63.1 0.78 60,181 65.2 87.4 91.0 83.7 0.92 8,650 63.4Central and Eastern Europe 97.6 99.0 96.4 0.97 7,960 79.9 98.8 99.2 98.4 0.99 729 66.0Central Asia 99.4 99.6 99.2 1.00 362 66.7 99.7 99.6 99.7 1.00 59 39.0East Asia and the Pacific 93.7 96.3 91.0 0.94 105,681 70.7 98.3 98.4 98.1 1.00 6,444 52.5Latin America and the Caribbean 91.0 91.9 90.3 0.98 36,056 55.8 96.9 96.7 97.2 1.01 3,181 45.0North America and Western Europe 99.0 99.1 98.9 1.00 6,292 57.2 99.7 99.7 99.7 1.00 297 44.2South and West Asia 61.9 73.2 50.9 0.70 412,432 63.5 79.3 85.7 73.3 0.86 66,115 63.5Sub-Saharan Africa 62.1 71.2 53.3 0.75 167,200 62.5 71.2 76.2 66.3 0.87 45,109 58.5All data are UIS estimates unless otherwise noted. The reference period for regional averages is 2005-2008.Please refer to the literacy metadata table on the UIS website at www.uis.unesco.org for information regarding source data and literacy definitions.(o) Observed data(d) Literacy rates refer to the population aged 16 years and older.(e) Literacy rates are estimates for current decade based on survey or census data from previous decade.227
T a b l e16 EDUCATIONAL ATTAINMENT OF THE POPULATION AGED 25 YEARS AND OLDERRegionCountry or territoryArab States<strong>Reference</strong> yearPopulation(25 years and older)(000)No schooling (%) Incomplete primary (%)Primary (ISCED 1)(%)MF M F MF M F MF M F MF M F1 2 3 4 5 6 7 8 9 10 11 12Algeria 2006 16,263 8,108 8,155 35.5 25.7 45.5 17.8 19.5 16.0 22.4 27.2 17.5Bahrain 2001 366 226 140 12.9 6.4 24.5 6.8 5.5 9.2 12.0 13.5 9.3Djibouti … … … … … … … … … … … … …Egypt … … … … … … … … … … … … …Iraq … … … … … … … … … … … … …Jordan 2008 2,699 1,389 1,310 10.7 5.5 15.8 4.9 4.8 5.0 11.1 12.0 10.3Kuwait 2008 1,794 1,158 636 7.1 5.6 10.3 37.3 40.8 30.0 6.6 7.0 6.0Lebanon 2007 2,299 1,093 1,207 21.5 17.4 25.2 - - - 24.1 26.9 21.5Libyan Arab Jamahiriya … … … … … … … … … … … … …Mauritania … … … … … … … … … … … … …Morocco … … … … … … … … … … … … …Oman 2003 1,121 722 399 26.6 17.7 41.3 21.3 24.8 15.7 12.4 13.9 9.8Palestinian Autonomous Territories 2008 1,458 736 722 8.8 4.1 13.7 2.6 2.3 2.8 38.5 39.5 37.5Qatar 2007 733 589 144 8.4 7.4 12.3 17.5 18.7 12.5 10.2 11.2 6.5Saudi Arabia 2004 10,678 6,457 4,221 22.2 15.6 32.5 13.6 14.5 12.2 15.4 17.4 12.3Sudan … … … … … … … … … … … … …Syrian Arab Republic 2007 8,617 4,293 4,324 18.1 9.3 27.6 11.9 11.0 12.8 33.7 35.6 31.6Tunisia … … … … … … … … … … … … …United Arab Emirates 2005 2,620 1,971 649 11.2 11.3 10.9 14.3 15.5 10.8 11.8 13.1 7.5Yemen … … … … … … … … … … … … …Central and Eastern EuropeAlbania 2001 1,626 795 831 1.5 0.9 2.2 7.1 4.3 9.8 15.7 14.3 17.0Belarus … … … … … … … … … … … … …Bosnia and Herzegovina … … … … … … … … … … … … …Bulgaria 2008 5,604 2,654 2,950 x(10) x(11) x(12) x(10) x(11) x(12) 7.8 5.9 9.6Croatia 2001 3,116 1,460 1,656 3.3 1.3 5.0 5.1 3.2 6.8 13.1 9.7 16.1Czech Republic 2008 7,522 3,617 3,905 0.1 0.2 0.1 x(10) x(11) x(12) 0.1 0.1 0.1Estonia 2000 923 404 520 0.2 0.2 0.2 0.5 0.3 0.6 9.7 8.1 10.9Hungary 2005 7,202 3,315 3,887 0.6 0.4 0.6 0.5 0.4 0.5 8.2 5.0 10.8Latvia 2008 1,601 704 897 x(7) x(8) x(9) 0.5 0.5 0.6 1.5 1.7 1.4Lithuania 2008 2,300 1,029 1,270 - - - 1.9 1.2 2.4 8.6 6.0 10.6Montenegro 2006 400 191 208 x(10) x(11) x(12) x(10) x(11) x(12) 1.8 1.2 2.5Poland 2008 26,580 12,486 14,094 0.3 0.2 0.3 1.1 0.6 1.6 19.7 16.5 22.5Republic of Moldova 2008 2,325 1,069 1,256 x(7) x(8) x(9) 1.2 0.7 1.7 6.3 4.5 7.9Romania 2008 15,041 7,153 7,888 2.2 1.3 2.9 - - - 11.5 8.3 14.3Russian Federation … … … … … … … … … … … … …Serbia 2008 6,679 3,238 3,441 4.1 1.3 6.6 x(10) x(11) x(12) 11.2 8.4 13.8Slovakia 2006 3,661 1,731 1,929 x(10) x(11) x(12) x(10) x(11) x(12) 1.2 0.9 1.4Slovenia 2008 1,489 714 775 - - - 1.1 0.9 1.2 3.8 2.8 4.6The former Yugoslav Rep. of Macedonia 2002 1,262 620 642 4.9 2.4 7.5 16.5 12.3 20.5 30.8 29.7 31.8Turkey 2008 40,499 20,135 20,364 11.3 4.5 18.0 6.2 4.9 7.4 42.7 42.8 42.7Ukraine 2001 32,860 14,467 18,393 x(7) x(8) x(9) 2.8 1.3 4.0 8.6 6.4 10.4Central AsiaArmenia 2001 1,745 772 973 0.7 0.4 1.0 1.4 1.0 1.7 6.8 6.3 7.3Azerbaijan 2008 4,775 2,209 2,566 1.3 0.8 1.8 1.5 0.8 2.2 4.4 2.7 6.0Georgia 2002 2,946 1,336 1,609 0.4 0.2 0.5 1.3 0.9 1.7 7.2 6.1 8.0228
G l o b a l e d u c a t i o n d i g e s t 2 0 1 0 C o m p a r i n g e d u c a t i o n s t a t i s t i c s a r o u n d t h e w o r l dLower secondary (ISCED 2)(%)Upper secondary (ISCED 3)(%)Post-secondarynon-tertiary (ISCED 4)(%)Tertiary (ISCED 5-6)(%)Unknown (%)RegionMF M F MF M F MF M F MF M F MF M F13 14 15 16 17 18 19 20 21 22 23 24 25 26 27Country or territoryArab States16.5 18.7 14.2 7.6 8.6 6.6 x(16) x(17) x(18) x(16) x(17) x(18) 0.2 0.4 0.1 Algeria18.7 23.0 11.0 38.4 40.9 34.0 x(16) x(17) x(18) 11.2 10.8 11.9 0.0 0.0 0.0 Bahrain… … … … … … … … … … … … … … … Djibouti… … … … … … … … … … … … … … … Egypt… … … … … … … … … … … … … … … Iraq32.3 35.4 29.2 14.2 14.0 14.3 11.0 9.2 12.8 15.9 19.1 12.7 - - - Jordan22.4 22.7 21.5 13.4 13.0 14.0 4.9 4.1 6.5 8.3 6.7 11.6 - - - Kuwait21.3 22.1 20.6 17.5 16.8 18.2 . . . 15.3 16.5 14.2 0.3 0.3 0.2 Lebanon… … … … … … … … … … … … … … … Libyan Arab Jamahiriya… … … … … … … … … … … … … … … Mauritania… … … … … … … … … … … … … … … Morocco10.4 13.1 5.8 14.4 15.2 13.2 5.1 5.2 5.0 9.3 9.7 8.5 0.5 0.4 0.8 Oman17.3 17.5 17.1 13.3 13.9 12.8 . . . 19.4 22.6 16.2 - - - Palestinian Autonomous Territories14.6 15.9 9.4 19.5 19.2 20.9 4.7 4.5 5.4 25.1 23.2 32.9 . . . Qatar14.6 17.1 10.7 14.7 15.9 12.8 4.6 4.6 4.6 14.9 15.0 14.8 - - - Saudi Arabia… … … … … … … … … … … … … … … Sudan12.2 13.5 10.8 8.6 9.5 7.7 6.9 7.7 6.1 5.6 7.7 3.4 2.9 5.7 - Syrian Arab Republic… … … … … … … … … … … … … … … Tunisia15.6 17.1 11.0 24.5 23.2 28.7 4.6 4.2 6.1 18.0 15.7 25.1 0.0 0.0 0.0 United Arab Emirates… … … … … … … … … … … … … … … YemenCentral and Eastern Europe38.7 38.5 38.9 29.6 32.8 26.5 - - - 7.4 9.2 5.7 - - - Albania… … … … … … … … … … … … … … … Belarus… … … … … … … … … … … … … … … Bosnia and Herzegovina24.5 24.5 24.6 47.4 52.1 43.2 x(16) x(17) x(18) 20.2 17.5 22.6 - - - Bulgaria18.7 15.6 21.3 45.4 54.5 37.4 . . . 13.9 15.2 12.8 0.5 0.5 0.5 Croatia13.7 7.1 19.8 71.5 76.9 66.6 1.3 0.8 1.8 13.3 15.0 11.7 0.0 0.0 0.0 Czech Republic17.5 20.0 15.5 39.6 42.9 37.2 2.6 2.2 3.0 27.5 23.9 30.3 2.4 2.4 2.3 Estonia27.3 23.3 30.6 47.3 53.7 41.9 1.5 2.0 1.2 14.7 15.2 14.3 - - - Hungary15.8 18.1 13.8 52.4 55.9 49.4 5.8 4.8 6.7 24.0 19.0 28.2 - - - Latvia11.2 11.4 11.0 30.0 36.5 24.7 22.0 21.1 22.8 26.4 23.8 28.4 - - - Lithuania20.7 17.5 23.6 58.2 64.6 52.6 3.1 1.6 4.5 16.1 15.1 16.9 - - - Montenegro0.0 0.0 0.1 58.2 65.0 52.2 3.2 1.7 4.6 17.5 15.9 18.8 . . . Poland18.3 17.0 19.4 43.3 50.7 36.9 15.3 12.3 17.9 15.6 14.8 16.4 - - - Republic of Moldova21.6 18.6 24.4 49.5 55.3 44.2 4.2 4.6 3.8 11.1 11.9 10.4 - - - Romania… … … … … … … … … … … … … … … Russian Federation22.1 19.5 24.5 47.7 54.8 41.3 . . . 14.8 16.0 13.8 . . . Serbia18.0 11.3 24.0 67.6 73.0 62.8 . . . 13.2 14.8 11.8 - - - Slovakia19.4 14.4 24.0 55.7 63.3 48.5 . . . 20.1 18.6 21.6 - - - Sloveniax(10) x(11) x(12) 35.6 41.8 29.4 - - - 12.2 13.8 10.7 0.0 0.0 - The former Yugoslav Rep. of Macedonia7.8 10.0 5.6 15.4 18.8 12.2 . . . 9.1 11.2 7.1 7.4 7.7 7.0 Turkey14.2 13.9 14.4 36.0 42.2 31.1 x(16) x(17) x(18) 38.0 35.8 39.7 0.4 0.4 0.4 UkraineCentral Asia9.5 10.2 8.9 39.5 40.6 38.5 21.8 20.2 23.1 20.4 21.4 19.5 - - - Armenia9.8 7.1 12.1 49.6 48.0 51.1 19.4 23.2 16.0 13.9 17.5 10.8 - - - Azerbaijan7.4 7.4 7.5 35.3 37.1 33.8 22.5 21.5 23.3 25.8 26.7 25.1 0.1 0.1 0.1 Georgia229
T a b l e16 EDUCATIONAL ATTAINMENT OF THE POPULATION AGED 25 YEARS AND OLDERRegionCountry or territory<strong>Reference</strong> yearPopulation(25 years and older)(000)No schooling (%) Incomplete primary (%)Primary (ISCED 1)(%)MF M F MF M F MF M F MF M F1 2 3 4 5 6 7 8 9 10 11 12Kazakhstan 2007 8,739 3,945 4,793 0.0 0.0 0.0 . . . 0.6 0.5 0.7Kyrgyzstan 1999 2,198 1,047 1,151 1.7 0.8 2.5 1.8 1.1 2.4 7.3 5.8 8.6Mongolia 2000 1,045 509 536 5.5 4.2 6.8 - - - 14.3 13.0 15.4Tajikistan 2000 2,334 1,150 1,184 0.8 0.4 1.1 2.1 1.3 2.9 4.7 3.4 6.1Turkmenistan … … … … … … … … … … … … …Uzbekistan … … … … … … … … … … … … …East Asia and the PacificAustralia 2008 14,142 6,922 7,220 - - - - - - 7.7 7.3 8.0Brunei Darussalam … … … … … … … … … … … … …Cambodia 2007 5,865 2,694 3,171 26.8 15.2 36.6 38.6 38.1 39.1 18.9 23.9 14.7China … … … … … … … … … … … … …Cook Islands … … … … … … … … … … … … …Democratic People’s Republic of Korea … … … … … … … … … … … … …Fiji 2007 406 202 204 0.0 0.0 0.0 16.5 16.7 16.3 21.6 22.5 20.6Hong Kong SAR of China 2008 5,200 2,397 2,802 6.4 3.1 9.3 - - - 21.3 20.5 22.0Indonesia 2007 121,090 59,596 61,494 10.9 6.3 15.4 17.4 16.2 18.4 31.3 31.4 31.3Japan 2002 93,871 45,094 48,777 x(13) x(14) x(15) x(13) x(14) x(15) x(13) x(14) x(15)Kiribati … … … … … … … … … … … … …Lao People’s Democratic Republic … … … … … … … … … … … … …Macao, China 2006 340 160 181 6.2 3.1 9.0 10.7 10.1 11.3 22.5 22.9 22.2Malaysia 2005 12,683 6,416 6,267 17.6 11.4 24.2 - - - 35.9 38.7 32.9Marshall Islands … … … … … … … … … … … … …Micronesia (Federated States of) … … … … … … … … … … … … …Myanmar … … … … … … … … … … … … …Nauru … … … … … … … … … … … … …New Zealand … … … … … … … … … … … … …Niue … … … … … … … … … … … … …Palau … … … … … … … … … … … … …Papua New Guinea … … … … … … … … … … … … …Philippines 2004 36,815 18,258 18,557 2.4 2.3 2.4 15.9 17.8 14.0 18.1 17.5 18.8Republic of Korea 2005 31,635 15,266 16,369 6.2 2.7 9.5 0.7 0.4 1.0 12.6 9.4 15.5Samoa 2001 72 37 35 1.0 1.3 0.6 2.6 2.5 2.8 32.8 34.7 30.7Singapore 2008 3,192 1,584 1,609 x(7) x(8) x(9) 20.8 16.8 24.4 4.3 4.3 4.3Solomon Islands … … … … … … … … … … … … …Thailand 2006 40,650 19,535 21,115 6.1 3.9 8.1 42.3 40.0 44.3 18.9 19.8 18.0Timor-Leste … … … … … … … … … … … … …Tokelau … … … … … … … … … … … … …Tonga 2006 44 22 22 1.4 1.3 1.4 x(10) x(11) x(12) 28.9 27.6 30.2Tuvalu … … … … … … … … … … … … …Vanuatu … … … … … … … … … … … … …Viet Nam … … … … … … … … … … … … …Latin America and the CaribbeanAnguilla 2001 6 3 3 2.0 1.9 2.2 2.3 2.8 1.7 37.4 40.5 34.5Antigua and Barbuda … … … … … … … … … … … … …Argentina 2003 21,306 10,166 11,140 1.1 0.8 1.3 8.9 8.6 9.3 33.5 33.9 33.1Aruba 2000 59 28 31 2.2 1.7 2.5 7.5 6.5 8.3 34.1 32.0 35.9Bahamas 2000 160 77 83 1.4 1.7 1.1 0.1 0.1 0.1 8.3 9.9 7.1230
G l o b a l e d u c a t i o n d i g e s t 2 0 1 0 C o m p a r i n g e d u c a t i o n s t a t i s t i c s a r o u n d t h e w o r l dLower secondary (ISCED 2)(%)Upper secondary (ISCED 3)(%)Post-secondarynon-tertiary (ISCED 4)(%)Tertiary (ISCED 5-6)(%)Unknown (%)RegionMF M F MF M F MF M F MF M F MF M F13 14 15 16 17 18 19 20 21 22 23 24 25 26 27Country or territory3.0 3.2 2.8 39.7 43.7 35.6 31.1 29.3 32.9 25.5 23.1 27.9 . . . Kazakhstan12.3 12.8 11.8 48.8 54.1 43.9 13.3 10.6 15.8 14.9 14.7 15.0 - - - Kyrgyzstan26.8 32.0 22.0 22.8 22.1 23.4 18.3 15.9 20.6 12.2 12.8 11.7 - - - Mongolia13.5 10.5 16.3 59.1 57.8 60.4 9.2 11.5 7.0 10.6 15.2 6.2 0.0 0.0 0.0 Tajikistan… … … … … … … … … … … … … … … Turkmenistan… … … … … … … … … … … … … … … UzbekistanEast Asia and the Pacific22.2 19.6 24.8 30.7 37.2 24.4 3.5 3.2 3.9 35.8 32.7 38.9 - - - Australia… … … … … … … … … … … … … … … Brunei Darussalam8.7 12.3 5.8 4.6 7.2 2.4 0.4 0.6 0.2 1.5 2.2 0.8 0.5 0.5 0.5 Cambodia… … … … … … … … … … … … … … … China… … … … … … … … … … … … … … … Cook Islands… … … … … … … … … … … … … … … Democratic People’s Republic of Korea20.1 20.0 20.2 22.5 21.3 23.6 3.5 3.7 3.2 11.8 13.0 10.6 4.1 2.7 5.6 Fiji17.0 19.0 15.3 32.7 32.2 33.2 6.8 7.2 6.5 15.7 17.9 13.8 - - - Hong Kong SAR of China14.4 15.5 13.3 18.9 22.5 15.4 2.6 2.5 2.8 4.5 5.5 3.5 - - - Indonesia26.1 24.2 27.9 43.9 42.1 45.7 . . . 30.0 33.8 26.4 - - - Japan… … … … … … … … … … … … … … … Kiribati… … … … … … … … … … … … … … … Lao People’s Democratic Republic24.9 25.8 24.0 21.4 22.9 19.9 1.7 1.5 1.9 12.6 13.6 11.6 0.0 0.0 0.0 Macao, China18.9 21.2 16.5 22.5 23.4 21.5 - - - 5.1 5.4 4.8 - - - Malaysia… … … … … … … … … … … … … … … Marshall Islands… … … … … … … … … … … … … … … Micronesia (Federated States of)… … … … … … … … … … … … … … … Myanmar… … … … … … … … … … … … … … … Nauru… … … … … … … … … … … … … … … New Zealand… … … … … … … … … … … … … … … Niue… … … … … … … … … … … … … … … Palau… … … … … … … … … … … … … … … Papua New Guinea12.5 12.6 12.4 23.8 24.3 23.4 x(22) x(23) x(24) 27.3 25.5 29.0 - - - Philippines11.2 10.3 12.1 37.7 38.7 36.8 . . . 31.6 38.6 25.2 - - - Republic of Koreax(10) x(11) x(12) 49.7 46.3 53.4 8.5 9.3 7.6 3.9 4.4 3.3 1.5 1.5 1.5 Samoa11.8 12.9 10.7 22.8 21.1 24.3 18.6 20.6 16.8 21.8 24.3 19.5 - - - Singapore… … … … … … … … … … … … … … … Solomon Islands9.7 11.7 7.9 9.6 11.4 8.0 - - - 12.8 12.4 13.2 0.5 0.6 0.5 Thailand… … … … … … … … … … … … … … … Timor-Leste… … … … … … … … … … … … … … … Tokelau46.1 45.8 46.3 11.2 11.2 11.2 x(22) x(23) x(24) 12.1 13.6 10.6 0.4 0.5 0.3 Tonga… … … … … … … … … … … … … … … Tuvalu… … … … … … … … … … … … … … … Vanuatu… … … … … … … … … … … … … … … Viet NamLatin America and the Caribbean10.9 10.6 11.2 26.4 24.5 28.2 x(16) x(17) x(18) 17.1 15.9 18.3 4.0 3.9 4.0 Anguilla… … … … … … … … … … … … … … … Antigua and Barbuda14.2 16.2 12.3 28.4 28.3 28.5 . . . 13.7 12.0 15.3 0.2 0.2 0.2 Argentinax(16) x(17) x(18) 39.3 40.9 38.0 . . . 16.3 18.1 14.7 0.6 0.7 0.6 Aruba19.1 21.8 16.9 51.5 48.1 54.2 18.7 17.4 19.8 0.3 0.4 0.3 0.5 0.6 0.4 Bahamas231
T a b l e16 EDUCATIONAL ATTAINMENT OF THE POPULATION AGED 25 YEARS AND OLDERRegionCountry or territory<strong>Reference</strong> yearPopulation(25 years and older)(000)No schooling (%) Incomplete primary (%)Primary (ISCED 1)(%)MF M F MF M F MF M F MF M F1 2 3 4 5 6 7 8 9 10 11 12Barbados 2000 161 75 85 0.0 0.0 0.0 13.6 13.6 13.6 8.3 8.9 7.7Belize 2005 117 58 58 6.2 6.2 6.2 25.1 24.1 26.0 42.9 43.1 42.7Bermuda 2000 43 … … 0.5 0.5 0.5 x(4) x(5) x(6) 8.1 8.1 8.1Bolivia 2006 4,006 1,942 2,064 14.7 8.2 20.7 39.5 40.8 38.3 3.6 3.6 3.6Brazil 2007 104,460 50,187 54,273 13.6 13.7 13.5 12.9 13.2 12.6 25.9 26.4 25.5British Virgin Islands … … … … … … … … … … … … …Cayman Islands 2008 … … … 0.6 0.4 0.7 0.6 0.5 0.6 7.4 7.1 7.6Chile 2007 9,808 4,757 5,051 4.1 3.9 4.3 6.9 6.9 6.8 25.1 24.0 26.1Colombia 2008 23,373 11,157 12,217 8.1 8.2 8.1 19.8 20.0 19.5 28.4 28.5 28.4Costa Rica 2008 2,444 1,230 1,214 5.1 5.0 5.1 16.3 15.9 16.6 30.1 31.0 29.2Cuba 2002 7,421 3,668 3,753 0.2 0.2 0.2 13.8 12.4 15.2 17.2 15.6 18.7Dominica 2001 38 19 19 3.6 3.8 3.3 6.9 7.7 6.1 62.5 65.1 60.0Dominican Republic 2007 4,774 2,381 2,393 9.0 8.8 9.3 35.8 35.9 35.7 12.7 13.6 11.7Ecuador 2008 6,697 3,303 3,394 7.2 6.0 8.2 13.2 13.0 13.4 x(16) x(17) x(18)El Salvador 2007 2,859 1,264 1,595 24.9 21.6 27.5 25.6 24.7 26.4 15.0 15.7 14.4Grenada … … … … … … … … … … … … …Guatemala 2006 4,818 2,238 2,581 38.9 30.8 45.5 31.3 35.0 28.4 15.0 16.8 13.5Guyana 2002 376 181 195 7.5 6.7 8.2 25.0 26.2 24.0 36.3 38.1 34.6Haiti … … … … … … … … … … … … …Honduras 2007 2,882 1,409 1,473 21.1 20.6 21.5 32.9 33.9 32.1 25.6 26.1 25.3Jamaica … … … … … … … … … … … … …Mexico 2008 57,382 27,782 29,600 10.1 8.2 11.7 17.3 17.0 17.5 19.9 18.9 20.7Montserrat … … … … … … … … … … … … …Netherlands Antilles … … … … … … … … … … … … …Nicaragua … … … … … … … … … … … … …Panama 2000 1,466 733 733 9.1 8.3 9.8 14.5 15.2 13.7 28.7 30.4 27.0Paraguay 2007 2,724 1,366 1,357 5.2 3.8 6.4 28.3 27.0 29.4 29.6 30.1 29.1Peru 2008 14,420 7,132 7,288 9.3 3.7 14.5 18.3 16.8 19.7 19.4 20.7 18.2Saint Kitts and Nevis … … … … … … … … … … … … …Saint Lucia … … … … … … … … … … … … …Saint Vincent and the Grenadines … … … … … … … … … … … … …Suriname … … … … … … … … … … … … …Trinidad and Tobago … … … … … … … … … … … … …Turks and Caicos Islands … … … … … … … … … … … … …Uruguay 2008 2,072 965 1,107 1.6 1.4 1.8 12.9 13.3 12.5 34.4 35.4 33.5Venezuela 2008 14,293 7,074 7,218 6.5 6.1 6.8 11.2 12.2 10.3 29.5 31.5 27.5North America and Western EuropeAndorra 2006 … … … 6.9 5.7 8.3 x(4) x(5) x(6) 42.6 44.4 40.6Austria 2008 6,038 2,886 3,152 x(13) x(14) x(15) x(13) x(14) x(15) x(13) x(14) x(15)Belgium 2008 7,525 3,623 3,902 x(7) x(8) x(9) 7.0 5.6 8.3 14.7 12.6 16.6Canada 2006 22,580 11,016 11,564 x(13) x(14) x(15) x(13) x(14) x(15) x(13) x(14) x(15)Cyprus 2008 572 271 301 1.1 0.5 1.7 6.4 4.2 8.5 18.5 18.0 19.0Denmark 2007 3,813 1,859 1,954 - - - - - - x(13) x(14) x(15)Finland 2007 3,729 1,794 1,935 x(13) x(14) x(15) x(13) x(14) x(15) x(13) x(14) x(15)France 2008 42,853 20,356 22,496 0.0 0.0 - 0.7 0.6 0.8 21.3 18.4 24.0Germany 2008 61,521 29,685 31,837 . . . . . . 3.3 2.9 3.6Gibraltar … … … … … … … … … … … … …232
G l o b a l e d u c a t i o n d i g e s t 2 0 1 0 C o m p a r i n g e d u c a t i o n s t a t i s t i c s a r o u n d t h e w o r l dLower secondary (ISCED 2)(%)Upper secondary (ISCED 3)(%)Post-secondarynon-tertiary (ISCED 4)(%)Tertiary (ISCED 5-6)(%)Unknown (%)RegionMF M F MF M F MF M F MF M F MF M F13 14 15 16 17 18 19 20 21 22 23 24 25 26 27Country or territory53.8 54.5 53.2 8.5 8.7 8.3 14.6 13.2 15.9 1.1 1.0 1.1 0.2 0.2 0.1 Barbadosx(16) x(17) x(18) 13.6 13.6 13.6 x(16) x(17) x(18) 10.9 11.0 10.8 1.3 2.0 0.7 Belize6.3 6.3 6.3 33.4 33.4 33.4 23.8 23.8 23.8 27.0 27.0 27.0 0.8 0.8 0.8 Bermuda8.6 10.5 6.9 12.6 14.0 11.3 - - - 20.9 22.8 19.2 - - - Bolivia13.9 14.4 13.4 24.4 23.9 24.9 . . . 9.3 8.4 10.1 - - - Brazil… … … … … … … … … … … … … … … British Virgin Islands13.9 15.8 12.1 31.7 32.5 30.9 7.5 8.2 6.7 37.1 33.8 40.4 1.4 1.7 1.0 Cayman Islands13.0 13.8 12.4 35.3 34.5 36.0 . . . 15.0 16.3 13.8 0.6 0.6 0.6 Chile5.2 4.9 5.5 28.4 27.9 28.8 . . . 10.1 10.5 9.7 0.0 0.1 0.0 Colombia14.4 14.9 13.9 15.7 14.8 16.4 . . . 18.6 18.4 18.7 - - - Costa Rica28.4 31.2 25.7 31.0 31.4 30.6 - - - 9.4 9.2 9.5 - - - Cuba15.7 12.0 19.4 5.7 5.9 5.5 x(16) x(17) x(18) 5.0 5.2 4.8 0.5 0.1 0.8 Dominica11.7 13.4 10.0 12.2 12.3 12.1 . . . 18.7 16.0 21.2 - - - Dominican Republicx(16) x(17) x(18) 64.7 65.7 63.9 . . . 14.8 15.3 14.5 - - - Ecuador13.0 15.0 11.3 15.4 15.9 15.0 . . . 6.2 7.0 5.5 - - - El Salvador… … … … … … … … … … … … … … … Grenada4.2 5.2 3.3 7.2 7.5 6.9 . . . 3.4 4.7 2.4 - - - Guatemala- - - 28.9 26.9 30.8 2.1 1.8 2.3 0.2 0.3 0.1 - - - Guyana… … … … … … … … … … … … … … … Haiti3.8 3.8 3.8 8.7 7.3 9.9 3.1 2.9 3.3 4.2 4.8 3.7 0.5 0.7 0.3 Honduras… … … … … … … … … … … … … … … Jamaica22.4 23.4 21.6 15.9 15.3 16.3 . . . 14.5 17.1 12.2 0.0 0.0 0.1 Mexico… … … … … … … … … … … … … … … Montserrat… … … … … … … … … … … … … … … Netherlands Antilles… … … … … … … … … … … … … … … Nicaragua13.7 14.2 13.3 22.4 21.4 23.5 0.7 0.7 0.8 10.4 9.4 11.4 0.5 0.4 0.5 Panama10.5 11.7 9.5 17.7 19.5 16.0 . . . 8.7 7.8 9.5 0.0 0.1 - Paraguay6.0 6.6 5.5 28.6 32.8 24.8 - - - 18.2 19.3 17.2 0.1 0.1 0.0 Peru… … … … … … … … … … … … … … … Saint Kitts and Nevis… … … … … … … … … … … … … … … Saint Lucia… … … … … … … … … … … … … … … Saint Vincent and the Grenadines… … … … … … … … … … … … … … … Suriname… … … … … … … … … … … … … … … Trinidad and Tobago… … … … … … … … … … … … … … … Turks and Caicos Islands24.2 26.2 22.5 12.2 11.2 13.2 5.2 5.2 5.3 9.5 7.5 11.3 - - - Uruguay11.1 11.8 10.5 26.7 25.7 27.6 . . . 14.6 12.3 16.9 0.3 0.4 0.3 VenezuelaNorth America and Western Europex(16) x(17) x(18) 19.3 20.0 18.5 12.3 12.4 12.3 17.8 16.9 18.7 1.1 0.7 1.6 Andorra27.5 16.4 37.0 48.9 55.4 43.3 8.4 7.9 8.8 15.2 20.2 10.9 - - - Austria17.9 18.3 17.5 31.0 33.7 28.6 2.0 2.0 2.0 27.4 27.8 27.1 - - - Belgium20.6 20.3 20.9 23.4 21.8 24.9 12.1 16.1 8.4 43.9 41.8 45.8 . . . Canada9.5 9.5 9.5 33.2 36.6 30.0 1.4 0.7 2.0 29.9 30.6 29.3 - - - Cyprus23.6 22.8 24.4 44.4 47.2 41.5 x(25) x(26) x(27) 31.5 29.5 33.4 0.6 0.6 0.7 Denmark32.0 31.8 32.2 37.5 40.2 34.9 x(22) x(23) x(24) 30.5 27.9 32.9 - - - Finland17.6 17.1 18.0 37.3 41.3 33.8 0.1 0.1 0.1 22.9 22.6 23.3 . . . France16.5 10.0 22.6 51.2 53.0 49.6 5.8 5.4 6.1 23.0 28.5 17.8 0.3 0.3 0.3 Germany… … … … … … … … … … … … … … … Gibraltar233
T a b l e16 EDUCATIONAL ATTAINMENT OF THE POPULATION AGED 25 YEARS AND OLDERRegionCountry or territory<strong>Reference</strong> yearPopulation(25 years and older)(000)No schooling (%) Incomplete primary (%)Primary (ISCED 1)(%)MF M F MF M F MF M F MF M F1 2 3 4 5 6 7 8 9 10 11 12Greece 2008 8,313 4,061 4,252 2.6 1.4 3.8 4.1 2.9 5.2 31.3 29.1 33.3Holy See … … … … … … … … … … … … …Iceland 2005 187 93 94 x(10) x(11) x(12) x(10) x(11) x(12) 4.0 3.2 4.7Ireland 2006 2,765 1,366 1,399 x(10) x(11) x(12) x(10) x(11) x(12) 23.7 24.2 23.2Israel 2007 3,907 1,881 2,025 3.1 1.9 4.2 2.2 2.0 2.5 10.2 10.2 10.2Italy 2008 45,231 21,596 23,635 6.9 4.3 9.2 x(4) x(5) x(6) 21.2 18.4 23.8Liechtenstein … … … … … … … … … … … … …Luxembourg 2007 332 162 170 - - - 5.0 4.8 5.1 17.1 16.5 17.8Malta 2007 281 138 143 3.3 2.6 4.0 - - - 34.2 30.1 38.0Monaco … … … … … … … … … … … … …Netherlands 2008 11,555 5,644 5,911 - - - 1.7 1.7 1.6 8.8 7.0 10.5Norway 2008 3,242 1,587 1,655 x(25) x(26) x(27) x(25) x(26) x(27) 0.3 0.2 0.3Portugal 2007 7,750 3,672 4,079 14.2 9.4 18.5 - - - 49.9 54.0 46.3San Marino … … … … … … … … … … … … …Spain 2008 33,023 16,032 16,991 2.6 1.8 3.5 10.0 8.6 11.3 21.8 20.6 22.9Sweden 2008 6,457 3,158 3,299 x(10) x(11) x(12) x(10) x(11) x(12) 14.0 13.3 14.6Switzerland 2007 5,432 2,609 2,823 x(10) x(11) x(12) x(10) x(11) x(12) 4.1 3.4 4.7United Kingdom … … … … … … … … … … … … …United States of America 2008 203,677 98,383 105,294 0.4 0.4 0.4 0.9 1.0 0.9 4.2 4.4 4.0South and West AsiaAfghanistan … … … … … … … … … … … … …Bangladesh 2001 60,142 30,350 29,792 51.0 45.4 56.6 1.8 1.7 1.9 20.5 21.6 19.5Bhutan 2005 280 151 129 12.9 13.1 12.5 39.3 39.6 38.4 13.4 12.8 15.1India … … … … … … … … … … … … …Iran (Islamic Republic of) 2006 34,939 17,847 17,092 x(10) x(11) x(12) x(10) x(11) x(12) 31.1 27.8 35.2Maldives 2006 128 65 64 - - - 46.6 41.6 51.4 24.0 24.2 23.8Nepal … … … … … … … … … … … … …Pakistan 2008 73,546 37,953 35,593 54.2 38.8 70.9 2.5 3.2 1.6 12.2 14.9 9.2Sri Lanka 2008 11,719 5,643 6,075 5.2 3.2 6.9 x(10) x(11) x(12) 20.9 21.3 20.5Sub-Saharan AfricaAngola … … … … … … … … … … … … …Benin 2002 2,580 1,256 1,324 69.6 57.1 80.3 x(10) x(11) x(12) 16.0 21.6 11.3Botswana … … … … … … … … … … … … …Burkina Faso 2005 4,650 2,225 2,425 17.5 16.5 18.3 12.2 12.4 12.0 12.2 12.4 12.0Burundi … … … … … … … … … … … … …Cameroon … … … … … … … … … … … … …Cape Verde … … … … … … … … … … … … …Central African Republic … … … … … … … … … … … … …Chad 2004 3,333 1,621 1,712 77.7 68.9 85.4 13.6 16.5 11.1 3.0 4.4 1.8Comoros … … … … … … … … … … … … …Congo … … … … … … … … … … … … …Côte d’Ivoire … … … … … … … … … … … … …Democratic Republic of the Congo … … … … … … … … … … … … …Equatorial Guinea … … … … … … … … … … … … …Eritrea … … … … … … … … … … … … …Ethiopia … … … … … … … … … … … … …Gabon … … … … … … … … … … … … …234
G l o b a l e d u c a t i o n d i g e s t 2 0 1 0 C o m p a r i n g e d u c a t i o n s t a t i s t i c s a r o u n d t h e w o r l dLower secondary (ISCED 2)(%)Upper secondary (ISCED 3)(%)Post-secondarynon-tertiary (ISCED 4)(%)Tertiary (ISCED 5-6)(%)Unknown (%)RegionMF M F MF M F MF M F MF M F MF M F13 14 15 16 17 18 19 20 21 22 23 24 25 26 27Country or territory9.4 10.9 7.9 27.0 28.5 25.5 6.5 6.0 6.9 19.2 21.1 17.4 - - - Greece… … … … … … … … … … … … … … … Holy See33.4 28.4 38.5 28.3 34.6 22.0 2.0 3.3 0.6 27.6 25.3 29.9 4.7 5.2 4.3 Iceland16.3 17.4 15.1 21.8 20.9 22.6 9.4 9.8 9.1 26.4 24.9 27.9 2.4 2.7 2.0 Ireland7.5 9.3 5.9 34.7 36.6 33.0 x(16) x(17) x(18) 41.4 39.3 43.4 0.8 0.8 0.8 Israel27.9 31.9 24.2 31.4 33.3 29.8 0.8 0.6 1.0 11.7 11.4 12.0 - - - Italy… … … … … … … … … … … … … … … Liechtenstein16.2 11.5 21.0 34.3 36.6 31.9 4.0 5.3 2.5 23.5 25.2 21.7 - - - Luxembourg39.5 39.7 39.3 5.6 5.7 5.5 6.3 10.0 2.7 11.2 12.0 10.4 - - - Malta… … … … … … … … … … … … … … … Monaco23.1 20.1 26.0 34.8 36.2 33.5 3.7 3.9 3.5 27.3 30.4 24.3 0.6 0.7 0.5 Netherlands23.7 22.3 25.0 40.2 41.6 38.8 2.8 3.8 1.9 28.5 27.0 30.0 4.6 5.1 4.1 Norway13.4 15.2 11.8 10.6 11.1 10.1 0.6 0.7 0.6 11.3 9.7 12.8 - - - Portugal… … … … … … … … … … … … … … … San Marino22.8 24.6 21.0 18.3 19.0 17.6 0.1 0.1 0.0 24.5 25.4 23.6 - - - Spain9.3 10.3 8.4 43.2 45.0 41.5 4.9 6.1 3.7 26.9 23.6 30.1 1.7 1.7 1.7 Sweden2.0 0.4 3.4 63.8 56.5 70.5 2.6 2.7 2.4 27.5 36.9 18.8 0.1 0.1 0.1 Switzerland… … … … … … … … … … … … … … … United Kingdom7.9 8.3 7.5 48.4 47.9 48.8 . . . 38.3 38.1 38.4 - - - United States of AmericaSouth and West Asia… … … … … … … … … … … … … … … Afghanistan9.6 10.5 8.7 12.9 15.9 9.9 - - - 4.2 4.9 3.5 - - - Bangladesh15.8 15.1 17.7 5.6 5.7 5.1 4.1 4.4 3.0 8.9 9.2 8.1 - - - Bhutan… … … … … … … … … … … … … … … India23.9 25.0 22.5 25.8 26.6 24.8 0.6 0.5 0.7 15.7 17.0 14.1 2.9 3.1 2.7 Iran (Islamic Republic of)16.2 18.9 13.5 1.9 2.5 1.3 4.3 4.9 3.8 3.0 3.9 2.1 4.1 4.0 4.2 Maldives… … … … … … … … … … … … … … … Nepal8.6 12.0 5.0 16.6 22.8 9.9 - - - 6.0 8.4 3.4 - - - Pakistan44.6 46.7 42.8 x(13) x(14) x(15) 15.4 15.6 15.2 13.9 13.1 14.6 - - - Sri LankaSub-Saharan Africa… … … … … … … … … … … … … … … Angolax(16) x(17) x(18) 12.2 17.5 7.6 - - - 2.2 3.8 0.8 0.0 0.0 0.0 Benin… … … … … … … … … … … … … … … Botswana11.9 12.1 11.7 11.6 11.6 11.5 11.6 11.7 11.5 11.7 11.8 11.6 11.5 11.5 11.5 Burkina Faso… … … … … … … … … … … … … … … Burundi… … … … … … … … … … … … … … … Cameroon… … … … … … … … … … … … … … … Cape Verde… … … … … … … … … … … … … … … Central African Republicx(16) x(17) x(18) 2.3 4.1 0.7 . . . 3.2 5.8 0.9 0.2 0.3 0.1 Chad… … … … … … … … … … … … … … … Comoros… … … … … … … … … … … … … … … Congo… … … … … … … … … … … … … … … Côte d’Ivoire… … … … … … … … … … … … … … … Democratic Republic of the Congo… … … … … … … … … … … … … … … Equatorial Guinea… … … … … … … … … … … … … … … Eritrea… … … … … … … … … … … … … … … Ethiopia… … … … … … … … … … … … … … … Gabon235
T a b l e16 EDUCATIONAL ATTAINMENT OF THE POPULATION AGED 25 YEARS AND OLDERRegionCountry or territory<strong>Reference</strong> yearPopulation(25 years and older)(000)No schooling (%) Incomplete primary (%)Primary (ISCED 1)(%)MF M F MF M F MF M F MF M F1 2 3 4 5 6 7 8 9 10 11 12Gambia … … … … … … … … … … … … …Ghana … … … … … … … … … … … … …Guinea … … … … … … … … … … … … …Guinea-Bissau … … … … … … … … … … … … …Kenya … … … … … … … … … … … … …Lesotho 2008 767 326 441 15.7 24.7 7.6 43.4 41.3 45.3 20.1 14.3 25.3Liberia … … … … … … … … … … … … …Madagascar … … … … … … … … … … … … …Malawi 1998 3,840 1,859 1,981 42.9 30.2 55.3 37.3 41.1 33.6 11.2 15.8 6.8Mali 2006 4,185 1,985 2,200 81.4 81.1 81.6 x(4) x(5) x(6) 8.3 9.6 7.1Mauritius 2000 678 332 346 12.2 6.7 17.5 38.3 37.7 39.0 10.0 10.3 9.7Mozambique … … … … … … … … … … … … …Namibia 2001 720 340 380 22.9 21.8 23.8 25.6 25.7 25.4 20.9 20.0 21.6Niger … … … … … … … … … … … … …Nigeria … … … … … … … … … … … … …Rwanda … … … … … … … … … … … … …Sao Tome and Principe … … … … … … … … … … … … …Senegal 2006 4,043 1,953 2,090 75.2 68.3 80.9 12.9 14.7 11.4 3.3 4.4 2.4Seychelles 2002 46 22 24 5.6 5.6 5.6 - - - 23.5 22.3 24.7Sierra Leone … … … … … … … … … … … … …Somalia … … … … … … … … … … … … …South Africa 2007 23,903 11,523 12,379 10.9 8.3 13.2 16.3 16.6 16.0 6.9 6.9 6.9Swaziland … … … … … … … … … … … … …Togo … … … … … … … … … … … … …Uganda 2002 7,937 3,893 4,044 33.8 21.3 45.2 35.6 38.5 33.0 19.1 23.9 14.7United Republic of Tanzania 2002 12,630 6,141 6,489 34.9 24.3 44.7 16.2 19.1 13.6 42.9 48.7 37.6Zambia … … … … … … … … … … … … …Zimbabwe 2002 4,296 1,990 2,306 13.2 8.1 17.8 21.6 17.9 25.0 19.1 18.3 19.9Please refer to the Reader’s Guide for more information on the data and symbols used in each table.236
G l o b a l e d u c a t i o n d i g e s t 2 0 1 0 C o m p a r i n g e d u c a t i o n s t a t i s t i c s a r o u n d t h e w o r l dLower secondary (ISCED 2)(%)Upper secondary (ISCED 3)(%)Post-secondarynon-tertiary (ISCED 4)(%)Tertiary (ISCED 5-6)(%)Unknown (%)RegionMF M F MF M F MF M F MF M F MF M F13 14 15 16 17 18 19 20 21 22 23 24 25 26 27Country or territory… … … … … … … … … … … … … … … Gambia… … … … … … … … … … … … … … … Ghana… … … … … … … … … … … … … … … Guinea… … … … … … … … … … … … … … … Guinea-Bissau… … … … … … … … … … … … … … … Kenya7.1 6.4 7.7 8.5 8.3 8.6 3.5 3.1 3.8 1.9 1.9 1.9 - - - Lesotho… … … … … … … … … … … … … … … Liberia… … … … … … … … … … … … … … … Madagascar3.4 4.8 2.0 4.7 7.4 2.1 - - - 0.5 0.7 0.3 - - - Malawi4.8 4.7 5.0 3.6 3.4 3.8 . . . 1.9 1.2 2.6 0.0 0.0 0.0 Mali18.6 21.0 16.3 12.4 14.0 10.9 5.2 5.9 4.6 2.6 3.8 1.5 0.5 0.6 0.5 Mauritius… … … … … … … … … … … … … … … Mozambique10.6 10.6 10.7 11.7 12.6 10.9 3.1 3.2 3.0 2.2 2.5 2.0 3.0 3.5 2.6 Namibia… … … … … … … … … … … … … … … Niger… … … … … … … … … … … … … … … Nigeria… … … … … … … … … … … … … … … Rwanda… … … … … … … … … … … … … … … Sao Tome and Principe2.6 3.6 1.8 1.7 2.3 1.1 2.4 3.7 1.4 0.8 1.4 0.3 1.2 1.6 0.8 Senegal22.6 21.2 24.0 x(19) x(20) x(21) 36.8 36.5 37.1 7.4 8.9 5.9 4.1 5.4 2.8 Seychelles… … … … … … … … … … … … … … … Sierra Leone… … … … … … … … … … … … … … … Somalia33.5 33.4 33.6 21.6 23.2 20.2 6.4 6.4 6.3 4.3 5.0 3.7 0.1 0.2 0.1 South Africa… … … … … … … … … … … … … … … Swaziland… … … … … … … … … … … … … … … Togo5.1 7.1 3.2 1.6 2.6 0.8 . . . 4.8 6.7 3.1 - - - Uganda4.4 5.6 3.2 0.7 1.1 0.3 x(16) x(17) x(18) 0.9 1.2 0.7 - - - United Republic of Tanzania… … … … … … … … … … … … … … … Zambia35.6 40.9 30.8 1.3 2.0 0.6 7.5 10.5 4.8 1.5 2.3 0.9 0.1 0.2 0.1 Zimbabwe237
PRIMARY AND SECONDARY EDUCATION / ISCED 1, 2 and 3T a b l e17 Distribution of students by type of institution / 2008 (WEI and UOE countries)Type of institution, by ISCED levelMode of studyCountry or territoryPrimary(ISCED 1)Lower secondary(ISCED 2)Upper secondary(ISCED 3)Primary and secondary(ISCED 1-3)PublicGovernmentdependentprivateIndependentprivatePublicGovernmentdependentprivateIndependentprivatePublicGovernmentdependentprivateIndependentprivate Full-time Part-time1 2 3 4 5 6 7 8 9 10 11WEI countriesArgentina 77.8 -1 18.6 -1 3.7 -1 77.4 -1 18.9 -1 3.6 -1 69.3 -1 24.9 -1 5.7 -1 100.0 -1 - -1Brazil 88.4 . 11.6 90.3 . 9.7 86.0 . 14.0 ... ...Chile 45.2 -1 48.6 -1 6.2 -1 50.5 -1 43.4 -1 6.1 -1 43.2 -1 49.9 -1 6.9 -1 100.0 -1 . -1China 93.8 6.2 x(2) 92.9 7.1 x(5) 89.9 10.1 x(8) 97.8 2.2Egypt 92.3 -1 0.5 -1 7.2 -1 96.3 -2 0.6 -2 3.1 -2 x(4) x(5) x(6) 100.0 -1 . -1India ... ... ... ... ... ... ... ... ... 100.0 -1 - -1Indonesia 83.9 . 16.1 62.8 . 37.2 48.6 . 51.4 100.0 .Jamaica 88.3 . 11.7 94.2 . 5.8 97.8 . 2.2 100.0 .Jordan 67.1 . 32.9 79.3 . 20.7 88.9 . 11.1 100.0 .Malaysia 99.0 -1 . -1 1.0 -1 96.1 -1 . -1 3.9 -1 96.3 -1 . -1 3.7 -1 100.0 -1 . -1Paraguay 83.8 -2 10.2 -2 6.1 -2 81.4 -2 11.1 -2 7.5 -2 72.4 -2 7.5 -2 20.1 -2 100.0 -2 . -2Peru 79.9 4.1 16.1 76.0 5.6 18.4 75.2 5.4 19.3 100.0 .Philippines 92.0 -1 . -1 8.0 -1 80.1 -1 . -1 19.9 -1 78.2 -1 . -1 21.8 -1 100.0 -1 . -1Russian Federation 99.4 . 0.6 99.6 . 0.4 98.9 . 1.1 99.9 0.1Sri Lanka 100.0 - - 100.0 - - ... ... ... 100.0 -Thailand 81.6 +1 18.4 +1 x(2) 87.3 +1 12.7 +1 x(5) 79.1 +1 20.9 +1 x(8) 81.9 18.1Tunisia 98.4 . 1.6 98.3 . 1.7 92.4 . 7.6 100.0 .Uruguay 85.9 -1 . -1 14.1 -1 87.9 -1 . -1 12.1 -1 89.1 -1 . -1 10.9 -1 100.0 -1 . -1OECD countriesAustralia 69.7 30.3 . 66.2 33.8 . 76.9 22.9 0.2 78.9 21.1Austria 94.6 5.4 x(2) 91.5 8.5 x(5) 89.4 10.6 x(8) ... ...Belgium 45.9 54.1 . 39.9 60.1 . 43.4 56.6 . 79.3 20.7Canada 94.2 -2 5.8 -2 x(2) 94.2 -2 5.8 -2 x(5) 94.2 -2 5.8 -2 x(8) 100.0 -2 . -2Czech Republic 98.7 1.3 . 94.2 5.8 . 86.1 13.9 . 100.0 -Denmark 87.9 -1 12.1 -1 - -1 76.2 -1 23.4 -1 0.4 -1 97.3 -1 2.6 -1 0.1 -1 96.7 -1 3.3 -1Finland 98.6 1.4 . 95.7 4.3 . 86.1 13.9 . 100.0 .France 85.0 14.4 0.5 78.2 21.5 0.3 68.7 30.3 1.0 ... ...Germany 96.4 3.6 x(2) 91.5 8.5 x(5) 91.1 8.9 x(8) 99.7 0.3Greece 92.8 -1 . -1 7.2 -1 94.9 -1 . -1 5.1 -1 95.3 -1 . -1 5.2 -1 97.9 -1 2.4 -1Hungary 92.1 7.9 . 91.3 8.7 . 80.7 19.3 . 95.2 4.8Iceland 98.2 1.8 - 99.1 0.9 - 87.8 11.8 0.5 90.0 10.0Ireland 99.1 -1 . -1 0.9 -1 100.0 -1 . -1 - -1 98.6 -1 . -1 1.4 -1 99.9 -1 0.1 -1Italy 93.1 -1 . -1 6.9 -1 96.2 -1 . -1 3.8 -1 94.3 -1 1.0 -1 4.8 -1 99.2 -1 0.8 -1Japan 99.0 . 1.0 92.9 . 7.1 69.2 . 30.8 98.7 1.3Luxembourg 92.2 0.5 7.3 80.4 11.2 8.4 84.2 7.3 8.5 99.9 0.1238
G l o b a l e d u c a t i o n d i g e s t 2 0 1 0 C o m p a r i n g e d u c a t i o n s t a t i s t i c s a r o u n d t h e w o r l dType of institution, by ISCED levelMode of studyCountry or territoryPrimary(ISCED 1)Lower secondary(ISCED 2)Upper secondary(ISCED 3)Primary and secondary(ISCED 1-3)PublicGovernmentdependentprivateIndependentprivatePublicGovernmentdependentprivateIndependentprivatePublicGovernmentdependentprivateIndependentprivate Full-time Part-time1 2 3 4 5 6 7 8 9 10 11Mexico 91.8 . 8.2 86.4 . 13.6 80.8 . 19.2 100.0 .Netherlands ... … ... ... … ... ... … ... 99.1 0.9New Zealand 87.6 10.2 2.2 83.0 12.0 5.1 76.2 17.1 6.7 90.9 9.1Norway 97.8 2.2 x(2) 96.9 3.1 x(5) 90.6 9.4 x(8) 98.9 1.1Poland 98.0 -1 0.6 -1 1.5 -1 97.0 -1 0.8 -1 2.2 -1 90.2 -1 0.9 -1 8.9 -1 95.4 -1 4.6 -1Portugal 88.9 -1 2.6 -1 8.5 -1 88.0 -1 6.5 -1 5.5 -1 81.2 -1 5.2 -1 13.5 -1 100.0 -1 . -1Republic of Korea 98.7 . 1.3 81.5 18.5 . 53.5 46.5 . ... ...Slovakia 94.5 5.5 - 93.7 6.3 - 87.2 12.8 - 98.9 1.1Spain 68.6 27.9 3.5 67.9 29.0 3.1 77.8 12.1 10.1 91.9 8.1Sweden 92.7 7.3 - 90.5 9.5 - 87.2 12.8 - 91.6 8.4Switzerland 95.8 1.3 2.9 92.3 2.7 4.9 93.2 2.8 4.1 99.8 0.2Turkey 97.9 . 2.1 x(1) . x(3) 97.1 . 2.9 ... ...United Kingdom 95.0 0.1 4.9 84.0 11.4 4.6 56.2 39.1 4.7 97.6 2.4United States of America 90.3 . 9.7 91.1 . 8.9 91.4 . 8.6 100.0 .Other UOE countriesAlbania ... ... ... ... ... ... ... ... ... ... ...Bosnia and Herzegovina ... ... ... ... ... ... ... ... ... ... ...Bulgaria 99.4 . 0.6 96.9 . 3.1 97.2 . 2.8 97.6 2.4Croatia 99.8 -1 . -1 0.2 -1 99.7 -1 . -1 0.3 -1 96.9 -1 . -1 3.1 -1 97.0 -1 3.0 -1Cyprus 93.0 . 7.0 84.3 . 15.7 84.5 . 15.5 99.2 0.8Estonia 97.0 . 3.0 97.8 . 2.2 97.0 . 3.0 96.1 3.9Israel 100.0 . . 100.0 . . 100.0 . . 100.0 .Latvia 98.9 . 1.1 99.1 . 0.9 98.3 . 1.7 95.6 4.4Liechtenstein 96.1 - 3.9 92.9 - 7.1 98.3 1.4 0.3 100.0 -Lithuania 99.4 . 0.6 99.2 . 0.8 99.4 . 0.6 97.7 2.3Malta 73.2 -1 20.0 -1 6.7 -1 62.5 -1 30.0 -1 7.6 -1 93.6 -1 5.9 -1 0.5 -1 97.4 -1 2.6 -1Romania 99.7 . 0.3 99.8 . 0.2 97.8 . 2.2 96.9 3.1Slovenia 99.8 0.2 - 99.9 0.1 - 96.2 3.3 0.5 94.3 5.7The former Yugoslav Rep. of Macedonia 100.0 . . 100.0 . . 98.9 0.3 0.8 99.8 0.2Please refer to the Reader’s Guide for more information on the data and symbols used in each table.239
TERTIARY EDUCATION / ISCED 5 and 6T a b l e18 Distribution of students by type of institution / 2008 (WEI and UOE countries)Type of institution, by ISCED levelMode of studyCountry or territoryTertiary(ISCED 5B)Tertiary(ISCED 5A and 6)Total tertiary(ISCED 5-6)Tertiary(ISCED 5B)Tertiary(ISCED 5A and 6)GovernmentdependentIndependentGovernmentdependentIndependentGovernmentdependentIndependentPublic private private Public private private Public private private Full-time Part-time Full-time Part-time1 2 3 4 5 6 7 8 9 10 11 12 13WEI countriesArgentina 59.0 -1 18.0 -1 23.0 -1 80.6 -1 . -1 19.4 -1 74.0 -1 5.5 -1 20.5 -1 93.6 -1 6.4 -1 52.1 -1 47.9 -1Brazil 16.9 . 83.1 29.3 . 70.7 28.1 . 71.9 ... ... ... ...Chile 7.3 -1 2.8 -1 89.9 -1 34.3 -1 22.9 -1 42.9 -1 23.4 -1 14.8 -1 61.8 -1 100.0 -1 . -1 100.0 -1 . -1China ... ... ... ... ... ... ... ... ... 72.4 27.6 77.3 22.7Egypt ... ... ... ... ... ... ... ... ... ... ... ... ...India ... ... ... ... ... ... ... ... ... ... ... 100.0 -1 - -1Indonesia 40.0 . 60.0 30.4 . 69.6 32.3 . 67.7 100.0 . 100.0 .Jamaica … . … ... . ... ... . ... ... ... ... ...Jordan 49.4 . 50.6 74.1 . 25.9 71.4 . 28.6 100.0 . 100.0 .Malaysia 58.8 -1 . -1 41.2 -1 67.8 -1 . -1 32.2 -1 63.9 -1 . -1 36.1 -1 96.3 -1 3.7 -1 92.1 -1 7.9 -1Paraguay ... ... ... ... ... ... ... ... ... ... ... ... ...Peru 35.7 0.7 63.5 ... ... ... ... ... ... 100.0 . ... ...Philippines 40.8 -2 . -2 59.2 -2 33.5 -2 . -2 66.5 -2 34.2 -2 . -2 65.8 -2 100.0 -2 . -2 100.0 -2 . -2Russian Federation 95.0 . 5.0 83.5 . 16.5 85.8 . 14.2 71.8 28.2 52.6 f 47.4 fSri Lanka ... ... ... ... ... ... ... ... ... ... ... ... ...Thailand 64.9 +1 . +1 35.1 +1 85.6 +1 . +1 14.4 +1 82.5 +1 . +1 17.5 +1 ... ... ... ...Tunisia x(4) . x(6) 98.3 . 1.7 98.3 . 1.7 100.0 . 100.0 .Uruguay 96.7 -1 . -1 3.3 -1 87.7 -1 . -1 12.3 -1 88.5 -1 . -1 11.5 -1 100.0 -1 . -1 100.0 -1 . -1OECD countriesAustralia 86.2 2.0 11.7 96.6 - 3.4 95.0 0.3 4.7 47.8 52.2 69.5 30.5Austria 65.1 34.9 - 85.4 14.6 - 84.1 15.9 - ... ... ... ...Belgium 44.4 55.6 . 42.6 57.4 . 43.5 56.5 . 64.4 35.6 86.7 13.3Canada ... ... ... ... ... ... ... ... ... ... ... ... ...Czech Republic 65.9 31.7 2.4 88.4 . 11.7 86.6 2.6 10.9 91.7 8.3 96.9 3.1Denmark 97.9 -1 1.5 -1 0.6 -1 97.8 -1 2.2 -1 - -1 97.8 -1 2.1 -1 0.1 -1 64.6 -1 35.4 -1 92.5 -1 7.5 -1Finland 98.6 1.4 . 95.7 4.3 . 86.1 13.9 . 100.0 . 55.6 -1 44.4 -1France 85.0 14.4 0.5 78.2 21.5 0.3 68.7 30.3 1.0 ... ... ... ...Germany 96.4 3.6 x(2) 91.5 8.5 x(5) 91.1 8.9 x(8) 99.7 0.3 ... ...Greece 92.8 -1 . -1 7.2 -1 94.9 -1 . -1 5.1 -1 95.3 -1 . -1 5.2 -1 97.9 -1 2.4 -1 100.0 -1 . -1Hungary 92.1 7.9 . 91.3 8.7 . 80.7 19.3 . 95.2 4.8 56.8 -1 43.2 -1Iceland 98.2 1.8 - 99.1 0.9 - 87.8 11.8 0.5 90.0 10.0 76.1 -1 23.9 -1Ireland 92.9 -1 . -1 7.1 -1 90.9 -1 . -1 9.1 -1 91.5 -1 . -1 8.5 -1 70.7 -1 29.3 -1 80.3 -1 19.7 -1Italy 87.8 -1 . -1 12.2 -1 92.3 -1 . -1 7.7 -1 92.3 -1 . -1 7.7 -1 100.0 -1 - -1 100.0 -1 - -1Japan 7.3 . 92.7 24.6 . 75.4 20.8 . 79.2 96.8 3.2 90.3 9.7Luxembourg ... ... ... ... ... ... ... ... ... ... ... ... ...240
G l o b a l e d u c a t i o n d i g e s t 2 0 1 0 C o m p a r i n g e d u c a t i o n s t a t i s t i c s a r o u n d t h e w o r l dType of institution, by ISCED levelMode of studyCountry or territoryTertiary(ISCED 5B)Tertiary(ISCED 5A and 6)Total tertiary(ISCED 5-6)Tertiary(ISCED 5B)Tertiary(ISCED 5A and 6)GovernmentdependentIndependentGovernmentdependentIndependentGovernmentdependentIndependentPublic private private Public private private Public private private Full-time Part-time Full-time Part-time1 2 3 4 5 6 7 8 9 10 11 12 13Mexico 95.4 . 4.6 65.7 . 34.3 66.7 . 33.3 100.0 . 100.0 .Netherlands ... . ... ... . ... ... . ... . . 85.1 14.9New Zealand 63.0 29.2 7.7 97.2 2.3 0.5 87.9 9.6 2.4 38.5 61.5 60.2 39.8Norway 45.0 55.0 - 86.4 13.6 - 86.0 14.0 - 60.4 39.6 71.0 29.0Poland 78.3 -1 - -1 21.7 -1 67.7 -1 . -1 32.3 -1 67.8 -1 - -1 32.2 -1 100.0 -1 . -1 53.3 -1 46.7 -1Portugal 80.2 -1 . -1 19.8 -1 75.0 -1 . -1 25.0 -1 75.1 -1 . -1 24.9 -1 100.0 -1 - -1 100.0 -1 - -1Republic of Korea 3.5 . 96.5 24.9 . 75.1 19.8 . 80.2 100.0 - 100.0 -Slovakia 81.7 18.3 - 89.4 - 10.6 89.3 0.2 10.5 81.3 18.7 60.7 39.3Spain 79.3 15.1 5.6 86.9 - 13.1 85.9 2.0 12.0 96.7 3.3 87.8 12.2Sweden 59.7 40.3 . 93.3 6.7 . 91.4 8.6 . 92.0 8.0 47.9 52.1Switzerland 36.7 35.2 28.1 94.7 3.7 1.6 82.6 10.2 7.1 24.5 75.5 90.0 10.0Turkey 96.8 . 3.2 93.5 . 6.5 94.5 . 5.5 100.0 - 100.0 -United Kingdom . 100.0 - . 100.0 - . 100.0 - 24.8 75.2 75.1 24.9United States of America 81.1 . 18.9 71.7 . 28.3 73.9 . 26.1 45.4 54.6 66.9 33.1Other UOE countriesAlbania ... ... ... ... ... ... ... ... ... ... ... ... ...Bosnia and Herzegovina ... ... ... ... ... ... ... ... ... ... ... ... ...Bulgaria 32.9 . 67.1 84.3 . 15.7 79.2 . 20.8 51.4 48.6 67.7 32.3Croatia 83.4 -1 . -1 16.6 -1 99.9 -1 . -1 0.1 -1 94.9 -1 . -1 5.1 -1 54.7 -1 45.3 -1 79.1 -1 20.9 -1Cyprus 14.0 . 86.0 44.0 . 56.0 30.3 . 69.7 83.3 16.7 91.1 8.9Estonia 46.8 15.9 37.3 0.1 86.2 13.7 15.8 62.5 21.6 90.7 9.3 87.4 12.6Israel 35.2 64.8 . 9.3 78.7 12.0 13.8 76.3 9.9 100.0 . 81.6 18.4Latvia 29.8 25.3 44.9 - 70.7 29.3 4.9 63.2 31.9 34.8 65.2 61.2 38.8Liechtenstein - - - - 90.1 9.9 - 90.1 9.9 - - 69.0 31.0Lithuania 72.6 . 27.4 95.1 . 4.9 88.5 . 11.5 44.5 55.5 57.9 42.1Malta 100.0 -1 - -1 - -1 100.0 -1 - -1 - -1 100.0 -1 - -1 - -1 44.9 -1 55.1 -1 82.1 -1 17.9 -1Romania 96.0 . 4.0 61.4 . 38.6 61.4 . 38.6 68.4 31.6 64.1 35.9Slovenia 80.1 5.1 14.8 93.4 4.2 2.3 88.5 4.6 6.9 50.0 50.0 75.8 24.2The former Yugoslav Rep. of Macedonia 97.6 . 2.4 81.4 . 18.6 81.9 . 18.1 51.4 48.6 85.1 14.9f Data includes ISCED 5A only.Please refer to the Reader’s Guide for more information on the data and symbols used in each table.241
PRIMARY AND LOWER SECONDARY EDUCATION / ISCED 1 and 2T a b l e19 Average class size by type of institution / 2008 (WEI and UOE countries)Country or territoryPrimary education (ISCED 1)Lower secondary education (ISCED 2)general programmesPublicGovernmentdependentprivateIndependentprivateTotal publicand privatePublicGovernmentdependentprivateIndependentprivateTotal publicand private1 2 3 4 5 6 7 8WEI countriesArgentina 26.1 -1 29.5 -1 24.0 -1 26.6 -1 28.3 -1 29.5 -1 26.3 -1 28.5 -1Brazil 27.1 . 17.8 25.5 30.5 . 25.0 29.8Chile 30.7 -1 34.0 -1 23.9 -1 31.5 -1 30.3 -1 33.2 -1 24.5 -1 30.9 -1China 36.6 41.8 x(2) 36.8 55.5 51.6 x(6) 55.2Egypt 43.3 41.4 33.4 42.4 39.9 39.0 29.8 39.2India ... ... ... ... ... ... ... ...Indonesia 27.4 . 22.8 26.6 37.7 . 33.1 35.9Jamaica ... ... ... ... ... ... ... ...Jordan 26.7 . 26.2 26.5 31.3 . 28.8 30.7Malaysia 29.0 -1 . -1 ... … 19.2 -1 . -1 ... …Paraguay 17.4 -2 21.7 -2 15.9 -2 17.7 -2 23.1 -2 25.4 -2 20.3 -2 23.1 -2Peru 15.0 23.3 14.7 15.2 28.8 29.8 20.3 27.0Philippines 38.7 -1 . -1 28.1 -1 37.7 -1 53.1 -1 . -1 46.5 -1 51.6 -1Russian Federation 15.5 -1 . -1 10.2 -1 15.5 -1 18.1 -1 . -1 9.6 -1 18.0 -1Sri Lanka 25.3 ... ... … 27.4 ... ... …Thailand 19.7 +1 29.5 +1 x(2) 21.0 +1 33.7 +1 38.8 +1 x(6) 34.3 +1Tunisia 22.5 . 22.5 22.5 30.6 . 19.2 30.3Uruguay 26.3 -1 . -1 ... … 30.2 -1 . -1 24.7 -1 29.2 -1OECD countriesAustralia 23.5 25.0 . 24.0 22.6 24.6 . 23.3Austria 19.3 20.6 - 19.3 23.3 24.0 - 23.4Belgium ... ... ... ... ... ... ... ...Canada ... ... ... ... ... ... ... ...Czech Republic 20.0 16.2 . 19.9 22.5 20.3 . 22.5Denmark 20.0 -1 16.5 -1 . -1 19.5 -1 20.2 -1 18.5 -1 . -1 19.9 -1Finland 19.8 18.4 . 19.8 20.0 21.7 . 20.1France 22.7 23.1 x(2) 22.7 24.1 25.3 13.3 24.3Germany 21.9 22.4 x(2) 21.9 24.7 25.5 x(6) 24.7Greece 16.8 -1 . -1 20.9 -1 17.0 -1 21.5 -1 . -1 23.6 -1 21.6 -1Hungary 21.4 19.3 . 21.2 22.8 21.3 . 22.6Iceland 18.0 14.4 - 17.9 19.8 13.0 - 19.7Ireland 24.5 -1 . -1 ... … 20.3 -1 . -1 ... …Italy 18.6 . ... … ... ... ... ...Japan 28.0 . 32.8 28.1 33.0 . 35.5 33.2Luxembourg 15.6 20.1 18.0 15.7 19.5 20.9 21.6 19.8242
G l o b a l e d u c a t i o n d i g e s t 2 0 1 0 C o m p a r i n g e d u c a t i o n s t a t i s t i c s a r o u n d t h e w o r l dCountry or territoryPrimary education (ISCED 1)Lower secondary education (ISCED 2)general programmesPublicGovernmentdependentprivateIndependentprivateTotal publicand privatePublicGovernmentdependentprivateIndependentprivateTotal publicand private1 2 3 4 5 6 7 8Mexico 19.7 . 20.7 19.8 29.1 . 24.9 28.7Netherlands 22.4 . ... ... ... . ... ...New Zealand ... ... ... ... ... ... ... ...Norway ... ... ... ... ... ... ... ...Poland 19.9 -1 11.8 -1 12.0 -1 19.6 -1 24.6 -1 25.5 -1 16.0 -1 24.3 -1Portugal 19.5 -1 24.0 -1 20.7 -1 19.7 -1 22.2 -1 23.8 -1 23.1 -1 22.3 -1Republic of Korea 29.9 . 30.9 30.0 35.5 34.4 . 35.3Slovakia 19.4 18.3 - 19.3 22.0 21.1 - 22.0Spain 19.7 24.3 24.8 21.0 23.6 26.3 24.9 24.4Sweden ... ... ... ... ... ... ... ...Switzerland 19.5 ... ... … 18.9 ... ... …Turkey 27.3 . 18.0 27.0 x(1) . x(3) x(4)United Kingdom 25.7 25.7 13.5 24.6 21.3 21.3 11.2 20.4United States of America 23.8 . 19.3 23.3 23.2 . 19.1 22.8Other UOE countriesAlbania ... ... ... ... ... ... ... ...Bosnia and Herzegovina ... ... ... ... ... ... ... ...Bulgaria 20.3 . 10.8 20.2 21.8 . 11.4 21.7Croatia 19.5 -1 . -1 11.6 -1 19.5 -1 22.2 -1 . -1 12.6 -1 22.2 -1Cyprus 19.0 . 18.1 19.0 22.5 . 20.1 22.1Estonia 18.4 . 15.1 18.3 21.6 . 15.6 21.4Israel 27.6 . . 27.6 32.5 . . 32.5Latvia 15.5 . 8.7 15.3 17.3 . 9.0 17.1Liechtenstein 15.1 . . 15.1 15.7 . . 15.7Lithuania 14.6 . 10.9 14.5 20.8 . 18.7 20.8Malta 21.2 -1 25.3 -1 30.7 -1 22.4 -1 21.3 -1 24.4 -1 20.4 -1 22.1 -1Romania 15.4 . 13.5 15.4 19.9 . 14.0 19.9Slovenia 18.5 17.0 - 18.5 20.4 23.5 - 20.4The former Yugoslav Rep. of Macedonia 20.3 . . 20.3 21.5 . . 21.5Please refer to the Reader’s Guide for more information on the data and symbols used in each table.243
T a b l e20Country or territoryWEI countriesINTENDED INSTRUCTION TIME (hours per year) FOR STUDENTS (9 TO 14 YEARS)IN PUBLIC INSTITUTIONS / 2008 (WEI countries)AgeTotalfor ages9-11Totalfor ages12-14Durationper session(in minutes)9 10 11 12 13 141 2 3 4 5 6 7 8 9Argentina 720 -1 720 -1 720 -1 896 -1 896 -1 896 -1 2160 -1 2688 -1 120 -1Brazil 800 800 800 800 800 800 2400 2400 60Chile … … … … … … … … …China … … … … … … … … …Egypt 1145 1145 1145 1019 1019 1019 3435 3056 45India … … … … … … … … …Indonesia 457 635 635 635 725 725 1727 2085 32Jamaica 950 950 950 950 950 950 2850 2850 40Jordan 1080 1114 1148 1215 1215 1249 3341 3679 45Malaysia 964 -1 964 -1 964 -1 1230 -1 1230 -1 1230 -1 2891 -1 3690 -1 40 -1Paraguay 793 -1 793 -1 793 -1 1066 -1 1066 -1 1066 -1 2380 -1 3198 -1 40 -1Peru 900 900 900 1050 1050 1050 2700 3150 45Philippines 1067 1067 1067 1467 1467 1467 3200 4400 40Russian Federation … … … … … … … … …Sri Lanka … 1083 1083 1083 1083 1083 … 3248 40Thailand 800-1000 +1 800-1000 +1 800-1000 +1 1000-1200 +1 1000-1200 +1 1000-1200 +1 2400-3000 +1 3000-3600 +1 50 +1Tunisia 800 960 992 992 992 992 2752 2976 60Uruguay 740 -2 740 -2 740 -2 912 -2 912 -2 912 -2 2220 -2 2736 -2 40 -2Please refer to the Reader’s Guide for more information on the data and symbols used in each table.T a b l e 21PRIMARY AND SECONDARY EDUCATION / ISCED 1, 2 and 3Organization of teachers’ instructional time / 2007 (WEI and UOE countries)Country or territoryWEI countriesTeaching hours per yearTeaching weeks per yearPrimary(ISCED 1)Lower secondary(ISCED 2)Upper secondary(ISCED 3)general programmesPrimary(ISCED 1)Lower secondary(ISCED 2)Upper secondary(ISCED 3)general programmes1 2 3 4 5 6Argentina 680 -1 1368 -1 1368 -1 36 -1 36 -1 36 -1Brazil … … … … … …Chile 860 -1 860 -1 860 -1 40 -1 40 -1 40 -1China ... ... ... ... ... ...Egypt 756 -2 662 -2 567 -2 34 -2 34 -2 34 -2India ... ... ... ... ... ...Indonesia 1260 738 738 44 44 44Jamaica 950 950 950 38 38 38Jordan 792 792 792 42 42 42Malaysia 650 -1 650 -1 650 -1 42 -1 42 -1 42 -1Paraguay 752 -1 837 -1 940 -1 39 -1 39 -1 39 -1Peru 869 695 695 40 40 40Philippines 1182 1182 1182 40 40 40Russian Federation 656 -1 845 -1 845 -1 34 -1 35 -1 35 -1Sri Lanka 1056 1218 1218 41 41 41Thailand 740 +1 925 +1 1110 +1 40 +1 40 +1 40 +1Tunisia 662 493 493 32 30 30Uruguay 660 -2 427 -2 427 -2 37 -2 36 -2 36 -2244
G l o b a l e d u c a t i o n d i g e s t 2 0 1 0 C o m p a r i n g e d u c a t i o n s t a t i s t i c s a r o u n d t h e w o r l dPRIMARY AND SECONDARY EDUCATION / ISCED 1, 2 and 3T a b l e21 Organization of teachers’ instructional time / 2008 (WEI and UOE countries)Country or territoryOECD countriesTeaching hours per yearTeaching weeks per yearPrimary(ISCED 1)Lower secondary(ISCED 2)Upper secondary(ISCED 3)general programmesPrimary(ISCED 1)Lower secondary(ISCED 2)Upper secondary(ISCED 3)general programmes1 2 3 4 5 6Australia 877 -1 815 -1 813 -1 40 -1 40 -1 40 -1Austria 774 -1 607 -1 589 -1 38 -1 38 -1 38 -1Belgium (Fl.) 806 -1 691 -1 645 -1 37 -1 37 -1 37 -1Belgium (Fr.) 724 -1 662 -1 603 -1 37 -1 37 -1 37 -1Canada ... ... ... ... ... ...Czech Republic 849 -1 637 -1 608 -1 40 -1 40 -1 40 -1Denmark 648 -1 648 -1 364 -1 42 -1 42 -1 42 -1England ... ... ... 38 -1 38 -1 38 -1Finland 677 -1 592 -1 550 -1 38 -1 38 -1 38 -1France 914 -1 632 -1 618 -1 35 -1 35 -1 35 -1Germany 806 -1 758 -1 714 -1 40 -1 40 -1 40 -1Greece 751 -1 559 -1 544 -1 40 -1 38 -1 38 -1Hungary 583 -1 555 -1 555 -1 37 -1 37 -1 37 -1Iceland 671 -1 671 -1 560 -1 36 -1 36 -1 35 -1Ireland 946 -1 735 -1 735 -1 37 -1 33 -1 33 -1Italy 735 -1 601 -1 601 -1 38 -1 38 -1 38 -1Japan 705 -1 600 -1 498 -1 40 -1 40 -1 40 -1Luxembourg 774 -1 642 -1 642 -1 36 -1 36 -1 36 -1Mexico 800 -1 1047 -1 843 -1 42 -1 42 -1 36 -1Netherlands 930 -1 ... ... 40 -1 ... ...New Zealand 985 -1 968 -1 950 -1 39 -1 39 -1 38 -1Norway 741 -1 654 -1 523 -1 38 -1 38 -1 38 -1Poland ... ... ... ... ... ...Portugal 855 -1 752 -1 684 -1 37 -1 37 -1 37 -1Republic of Korea 755 -1 545 -1 480 -1 37 -1 37 -1 37 -1Scotland 855 -1 855 -1 855 -1 38 -1 38 -1 38 -1Slovakia ... ... ... ... ... ...Spain 880 -1 713 -1 693 -1 37 -1 37 -1 36 -1Sweden ... ... ... ... ... ...Switzerland ... ... ... ... ... ...Turkey 639 -1 x(1) 567 -1 38 -1 x(4) 38 -1United States of America 1080 -1 1080 -1 1080 -1 36 -1 36 -1 36 -1Other UOE countriesAlbania ... ... ... ... ... ...Bosnia and Herzegovina ... ... ... ... ... ...Bulgaria ... ... ... ... ... ...Croatia ... ... ... ... ... ...Cyprus ... ... ... ... ... ...Estonia 630 -1 630 -1 578 -1 39 -1 39 -1 39 -1Israel 1025 -1 788 -1 665 -1 43 -1 42 -1 42 -1Latvia ... ... ... ... ... ...Liechtenstein ... ... ... ... ... ...Lithuania ... ... ... ... ... ...Malta ... ... ... ... ... ...Romania ... ... ... ... ... ...Slovenia 682 -1 682 -1 626 -1 40 -1 40 -1 40 -1The former Yugoslav Rep. of Macedonia ... ... ... ... ... ...Source for OECD countries and OECD Partner countries is the OECD publication Education at a Glance (Table D4.1). For details, see technical note F in the Reader’s Guide.Please refer to the Reader’s Guide for more information on the data and symbols used in each table.245
PRIMARY AND SECONDARY EDUCATION / ISCED 1, 2 and 3T a b l e22 Distribution of teachers by age / 2008 (WEI and UOE countries)Age of teachersCountry or territoryPrimary (ISCED 1) Lower secondary (ISCED 2)
G l o b a l e d u c a t i o n d i g e s t 2 0 1 0 C o m p a r i n g e d u c a t i o n s t a t i s t i c s a r o u n d t h e w o r l dAge of teachersLower secondary (ISCED 2) Upper secondary (ISCED 3)Country or territory50-59 ≥60 Unknown
PRIMARY AND SECONDARY EDUCATION / ISCED 1, 2 and 3T a b l e23 Teachers’ annual salaries in public institutions (in US dollars PPP) / 2008 (WEI and UOE countries)Country or territoryPrimary education(ISCED 1)Lower secondary education(ISCED 2)Upper secondary education(ISCED 3)general programmesStartingsalarySalary after15 years ofexperienceSalary at topof scaleStartingsalarySalary after15 years ofexperienceSalary at topof scaleStartingsalarySalary after15 years ofexperienceSalary at topof scale1 2 3 4 5 6 7 8 9WEI countriesArgentina 10,905 -1 13,527 -1 16,383 -1 9,173 -1 12,140 -1 14,655 -1 9,173 -1 12,140 -1 14,655 -1Brazil ... ... ... ... ... ... ... ... ...Chile 10,922 -1 12,976 -1 17,500 -1 10,922 -1 12,976 -1 17,500 -1 10,922 -1 13,579 -1 18,321 -1China ... ... ... ... ... ... ... ... ...Egypt 2,854 4,627 10,891 2,854 4,627 10,891 2,854 4,627 10,891India ... ... ... ... ... ... ... ... ...Indonesia 1,612 2,041 2,325 1,719 2,325 2,526 1,990 2,575 2,806Jamaica ... ... ... ... ... ... ... ... ...Jordan 7,560 -1 10,304 -1 24,608 -1 7,560 -1 10,304 -1 24,608 -1 7,560 -1 10,304 -1 24,608 -1Malaysia ... ... ... ... ... ... ... ... ...Paraguay 5,620 -1 5,620 -1 5,620 -1 8,349 -1 8,349 -1 8,349 -1 8,349 -1 8,349 -1 8,349 -1Peru 7,991 7,991 . 7,883 7,883 . 7,883 7,883 .Philippines 5,095 5,624 6,057 5,095 5,624 6,057 5,095 5,624 6,057Russian Federation ... ... ... ... ... ... ... ... ...Sri Lanka 3,501 4,132 7,215 3,501 4,132 7,215 3,921 4,989 7,215Thailand 5,996 11,613 19,689 5,996 11,613 19,689 5,996 11,613 19,689Tunisia 10,008 14,011 ... 15,011 19,014 ... 15,011 19,014 ...Uruguay ... 6,232 -2 9,049 -2 ... 6,232 -2 9,049 -2 ... 6,682 -2 9,591 -2OECD countriesAustralia 32,259 -1 44,245 -1 44,245 -1 32,406 -1 44,942 -1 44,942 -1 32,406 -1 44,942 -1 44,942 -1Austria 28,172 -1 37,307 -1 55,852 -1 29,446 -1 40,304 -1 58,046 -1 29,863 -1 41,469 -1 61,170 -1Belgium (Fl.) 29,680 -1 41,605 -1 50,744 -1 29,680 -1 41,605 -1 50,744 -1 36,850 -1 53,233 -1 64,007 -1Belgium (Fr.) 28,369 -1 39,885 -1 48,774 -1 28,369 -1 39,885 -1 48,774 -1 35,260 -1 51,195 -1 61,674 -1Canada ... ... ... ... ... ... ... ... ...Czech Republic 21,481 -1 29,127 -1 35,551 -1 21,481 -1 29,127 -1 35,551 -1 22,798 -1 31,119 -1 38,208 -1Denmark 35,691 -1 40,322 -1 40,322 -1 35,691 -1 40,322 -1 40,322 -1 35,011 -1 49,264 -1 49,264 -1England 30,172 -1 44,507 -1 44,507 -1 30,172 -1 44,507 -1 44,507 -1 30,172 -1 44,507 -1 44,507 -1Finland 28,201 -1 36,578 -1 46,003 -1 31,282 -1 39,144 -1 49,534 -1 31,846 -1 43,040 -1 55,778 -1France 23,640 -1 31,800 -1 46,920 -1 26,019 -1 34,179 -1 49,409 -1 26,294 -1 34,454 -1 49,711 -1Germany 43,387 -1 53,345 -1 57,630 -1 47,936 -1 57,978 -1 65,004 -1 51,512 -1 62,372 -1 71,546 -1Greece 26,326 -1 32,107 -1 38,619 -1 26,326 -1 32,107 -1 38,619 -1 26,326 -1 32,107 -1 38,619 -1Hungary 11,216 -1 14,515 -1 19,309 -1 11,216 -1 14,515 -1 19,309 -1 12,855 -1 18,110 -1 24,358 -1Iceland 22,443 -1 25,227 -1 29,304 -1 22,443 -1 25,227 -1 29,304 -1 25,389 -1 32,251 -1 33,828 -1Ireland 31,977 -1 52,972 -1 60,025 -1 31,977 -1 52,972 -1 60,025 -1 31,977 -1 52,972 -1 60,025 -1Italy 24,945 -1 30,174 -1 36,765 -1 26,877 -1 32,859 -1 40,351 -1 26,877 -1 33,778 -1 42,179 -1250
G l o b a l e d u c a t i o n d i g e s t 2 0 1 0 C o m p a r i n g e d u c a t i o n s t a t i s t i c s a r o u n d t h e w o r l dCountry or territoryPrimary education(ISCED 1)Lower secondary education(ISCED 2)Upper secondary education(ISCED 3)general programmesStartingsalarySalary after15 years ofexperienceSalary at topof scaleStartingsalarySalary after15 years ofexperienceSalary at topof scaleStartingsalarySalary after15 years ofexperienceSalary at topof scale1 2 3 4 5 6 7 8 9Japan 27,284 -1 48,742 -1 61,627 -1 27,284 -1 48,742 -1 61,627 -1 27,284 -1 48,742 -1 63,296 -1Luxembourg 49,902 -1 68,720 -1 101,707 -1 71,883 -1 89,864 -1 124,898 -1 71,883 -1 89,864 -1 124,898 -1Mexico 14,006 -1 18,420 -1 30,579 -1 17,957 -1 23,455 -1 38,851 -1 ... ... ...Netherlands 34,272 -1 44,410 -1 49,541 -1 35,516 -1 48,818 -1 54,332 -1 35,858 -1 63,169 -1 71,738 -1New Zealand 19,236 -1 37,213 -1 37,213 -1 19,236 -1 37,213 -1 37,213 -1 19,236 -1 37,213 -1 37,213 -1Norway 32,148 -1 36,298 -1 40,163 -1 32,148 -1 36,298 -1 40,163 -1 34,336 -1 38,684 -1 42,325 -1Portugal 21,304 -1 34,876 -1 54,698 -1 21,304 -1 34,876 -1 54,698 -1 21,304 -1 34,876 -1 54,698 -1Republic of Korea 31,717 -1 54,798 -1 87,745 -1 31,590 -1 54,671 -1 87,617 -1 31,590 -1 54,671 -1 87,617 -1Scotland 30,366 -1 48,436 -1 48,436 -1 30,366 -1 48,436 -1 48,436 -1 30,366 -1 48,436 -1 48,436 -1Spain 34,250 -1 39,912 -1 49,466 -1 38,533 -1 44,774 -1 54,648 -1 39,367 -1 45,786 -1 55,779 -1Sweden 27,498 -1 31,996 -1 36,750 -1 28,055 -1 32,799 -1 37,200 -1 29,554 -1 35,005 -1 39,813 -1Switzerland 41,998 -1 54,339 -1 66,906 -1 48,286 -1 62,183 -1 75,577 -1 56,166 -1 72,990 -1 86,732 -1Turkey 14,063 -1 15,693 -1 17,515 -1 x(1) x(2) x(3) 14,063 -1 15,693 -1 17,515 -1United States of America 35,907 -1 43,633 -1 ... 34,519 -1 44,015 -1 ... 34,672 -1 43,966 -1 ...Other UOE countriesAlbania ... ... ... ... ... ... ... ... ...Bosnia and Herzegovina ... ... ... ... ... ... ... ... ...Bulgaria ... ... ... ... ... ... ... ... ...Croatia ... ... ... ... ... ... ... ... ...Cyprus ... ... ... ... ... ... ... ... ...Estonia 10,459 -1 9,419 -1 13,015 -1 10,459 -1 9,419 -1 13,015 -1 10,459 -1 9,419 -1 13,015 -1Israel 14,099 16,466 23,009 14,099 16,466 23,009 14,099 16,466 23,009Latvia ... ... ... ... ... ... ... ... ...Liechtenstein ... ... ... ... ... ... ... ... ...Lithuania ... ... ... ... ... ... ... ... ...Malta ... ... ... ... ... ... ... ... ...Romania ... ... ... ... ... ... ... ... ...Slovenia 27,190 -1 31,754 -1 33,630 -1 27,190 -1 31,754 -1 33,630 -1 27,190 -1 31,754 -1 33,630 -1The former Yugoslav Rep. of Macedonia ... ... ... ... ... ... ... ... ...Note: Teachers’ annual salaries are expressed as gross salaries without additional bonuses.Source for OECD countries and OECD Partner countries is the OECD publication Education at a Glance (Table D3.1). For details, see technical note F in the Reader’s Guide.Please refer to the Reader’s Guide for more information on the data and symbols used in each table.251
T a b l e24PRIMARY AND SECONDARY EDUCATION / ISCED 1, 2 and 3 / Teachers’ annual salariesin public institutions as a percentage of GDP per capita / 2008 (WEI and UOE countries)Country or territoryPrimary education(ISCED 1)Lower secondary education(ISCED 2)Upper secondary education(ISCED 3)general programmesStartingsalarySalary after15 years ofexperienceSalary at topof scaleStartingsalarySalary after15 years ofexperienceSalary at topof scaleStartingsalarySalary after15 years ofexperienceSalary at topof scale1 2 3 4 5 6 7 8 9WEI countriesArgentina 82 -1 102 -1 124 -1 69 -1 92 -1 111 -1 69 -1 92 -1 111 -1Brazil ... ... ... ... ... ... ... ... ...Chile 79 -1 94 -1 127 -1 79 -1 94 -1 127 -1 79 -1 98 -1 133 -1China ... ... ... ... ... ... ... ... ...Egypt 53 85 201 53 85 201 53 85 201India ... ... ... ... ... ... ... ... ...Indonesia 40 51 58 43 58 63 50 65 70Jamaica ... ... ... ... ... ... ... ... ...Jordan 149 203 484 149 203 484 149 203 484Malaysia ... ... ... ... ... ... ... ... ...Paraguay 127 -1 127 -1 127 -1 189 -1 189 -1 189 -1 189 -1 189 -1 189 -1Peru 94 94 . 93 93 . 93 93 .Philippines 145 160 173 145 160 173 145 160 173Russian Federation ... ... ... ... ... ... ... ... ...Sri Lanka 76 90 157 76 90 157 86 109 157Thailand ... ... ... ... ... ... ... ... ...Tunisia 123 173 ... 185 234 ... 185 234 ...Uruguay ... 61 -2 89 -2 ... 61 -2 89 -2 ... 65 -2 94 -2OECD countriesAustralia 92 -1 126 -1 126 -1 92 -1 128 -1 128 -1 92 -1 128 -1 128 -1Austria 75 -1 100 -1 149 -1 79 -1 108 -1 155 -1 80 -1 111 -1 164 -1Belgium (Fl.) … … … … … … … … …Belgium (Fr.) … … … … … … … … …Canada … … … … … … … … …Czech Republic 89 -1 121 -1 147 -1 89 -1 121 -1 147 -1 94 -1 129 -1 158 -1Denmark 98 -1 111 -1 111 -1 98 -1 111 -1 111 -1 97 -1 136 -1 136 -1England … … … … … … … … …Finland 82 -1 106 -1 133 -1 91 -1 113 -1 143 -1 92 -1 125 -1 161 -1France 70 -1 94 -1 139 -1 77 -1 102 -1 147 -1 78 -1 102 -1 148 -1Germany 126 -1 155 -1 168 -1 139 -1 169 -1 189 -1 150 -1 181 -1 208 -1Greece 92 -1 112 -1 134 -1 92 -1 112 -1 134 -1 92 -1 112 -1 134 -1Hungary 60 -1 77 -1 102 -1 60 -1 77 -1 102 -1 68 -1 96 -1 129 -1Iceland 62 -1 70 -1 81 -1 62 -1 70 -1 81 -1 70 -1 89 -1 94 -1Ireland 71 -1 118 -1 134 -1 71 -1 118 -1 134 -1 71 -1 118 -1 134 -1Italy 82 -1 99 -1 121 -1 88 -1 108 -1 133 -1 88 -1 111 -1 139 -1252
G l o b a l e d u c a t i o n d i g e s t 2 0 1 0 C o m p a r i n g e d u c a t i o n s t a t i s t i c s a r o u n d t h e w o r l dCountry or territoryPrimary education(ISCED 1)Lower secondary education(ISCED 2)Upper secondary education(ISCED 3)general programmesStartingsalarySalary after15 years ofexperienceSalary at topof scaleStartingsalarySalary after15 years ofexperienceSalary at topof scaleStartingsalarySalary after15 years ofexperienceSalary at topof scale1 2 3 4 5 6 7 8 9Japan 81 -1 145 -1 183 -1 81 -1 145 -1 183 -1 81 -1 145 -1 188 -1Luxembourg 62 -1 86 -1 127 -1 90 -1 112 -1 156 -1 90 -1 112 -1 156 -1Mexico 101 -1 133 -1 221 -1 130 -1 170 -1 281 -1 ... ... ...Netherlands 89 -1 115 -1 129 -1 92 -1 127 -1 141 -1 93 -1 164 -1 186 -1New Zealand 70 -1 135 -1 135 -1 70 -1 135 -1 135 -1 70 -1 135 -1 135 -1Norway 60 -1 68 -1 75 -1 60 -1 68 -1 75 -1 64 -1 73 -1 79 -1Portugal 94 -1 154 -1 241 -1 94 -1 154 -1 241 -1 94 -1 154 -1 241 -1Republic of Korea 117 -1 202 -1 324 -1 117 -1 202 -1 323 -1 117 -1 202 -1 323 -1Scotland … … … … … … … … …Spain 107 -1 124 -1 154 -1 120 -1 139 -1 170 -1 122 -1 142 -1 173 -1Sweden 75 -1 87 -1 100 -1 77 -1 89 -1 101 -1 81 -1 95 -1 109 -1Switzerland 103 -1 133 -1 164 -1 118 -1 152 -1 185 -1 137 -1 179 -1 212 -1Turkey 107 -1 120 -1 134 -1 x(1) x(2) x(3) 107 -1 120 -1 134 -1United States of America 81 -1 98 -1 ... 77 -1 99 -1 ... 78 -1 99 -1 ...Other UOE countriesAlbania … … … … … … … … …Bosnia and Herzegovina … … … … … … … … …Bulgaria … … … … … … … … …Croatia … … … … … … … … …Cyprus … … … … … … … … …Estonia 51 -1 46 -1 64 -1 51 -1 46 -1 64 -1 51 -1 46 -1 64 -1Israel 52 -1 60 -1 84 -1 52 -1 60 -1 84 -1 52 -1 60 -1 84 -1Latvia … … … … … … … … …Liechtenstein … … … … … … … … …Lithuania … … … … … … … … …Malta … … … … … … … … …Romania … … … … … … … … …Slovenia 101 -1 118 -1 125 -1 101 -1 118 -1 125 -1 101 -1 118 -1 125 -1The former Yugoslav Rep. of Macedonia … … … … … … … … …Please refer to the Reader’s Guide for more information on the data and symbols used in each table.253
RELATIVE PROPORTIONS OF PUBLIC AND PRIVATE EXPENDITURE ON EDUCATIONALT a b l e25 INSTITUTIONS / 2008 (WEI and UOE countries)Pre-primary(ISCED 0)Primary, secondary and post-secondary non-tertiary(ISCED 1-4)Country or territoryPublicsourcesHouseholdexpenditurePrivate sourcesExpenditure ofother privateentitiesAll privatesources kPrivate,of whichsubsidisedPublicsourcesHouseholdexpenditurePrivate sourcesExpenditure ofother privateentitiesAll privatesources k1 2 3 4 5 6 7 8 9 10Private,of whichsubsidisedWEI countriesArgentina 75.1 -1 24.9 -1 - -1 24.9 -1 ... 90.9 -1 9.1 -1 - -1 9.1 -1 ...Brazil ... ... ... ... ... ... ... ... ... ...Chile 70.9 -1 29.1 -1 - 29.1 -1 - -1 72.8 -1 24.6 -1 2.6 -1 27.2 -1 0.1 -1China ... ... ... ... ... ... ... ... ... ...Egypt ... ... ... ... ... ... ... ... ... ...India ... ... ... ... ... ... ... ... ... ...Indonesia ... ... ... ... ... ... ... ... ... ...Jamaica ... ... ... ... ... ... ... ... ... ...Jordan 100.0 -1 . -1 . -1 . -1 . -1 100.0 -1 . -1 . -1 . -1 . -1Malaysia ... ... ... ... ... ... ... ... ... ...Paraguay 77.3 -1 22.7 -1 . -1 22.7 -1 0.1 -1 ... ... . -1 ... ...Peru 78.8 21.2 - 21.2 ... 70.4 ... ... 29.6 ...Philippines … . -1 ... ... . -1 ... ... ... ... . -1Russian Federation ... ... ... ... ... ... ... ... ... ...Sri Lanka ... ... ... ... ... ... ... ... ... ...Thailand ... ... ... ... ... ... ... ... ... ...Tunisia ... ... ... ... ... ... ... ... ... ...Uruguay ... ... ... ... ... ... ... ... ... ...OECD countriesAustralia 40.5 -1 59.1 -1 0.4 -1 59.5 -1 5.6 -1 81.1 -1 15.7 -1 3.2 -1 18.9 -1 6.1 -1Austria 68.9 -1 18.4 -1 12.7 -1 31.1 -1 19.5 -1 96.0 -1 2.8 -1 1.2 -1 4.0 -1 1.4 -1Belgium 96.4 -1 3.4 -1 0.2 -1 3.6 -1 0.7 -1 95.2 -1 4.6 -1 0.2 -1 4.8 -1 1.2 -1Canada x(6) x(7) x(8) x(9) … 88.7 r,-2 4.0 r,-2 7.3 r,-2 11.3 r,-2 ...Czech Republic 90.7 -2 7.7 -2 1.6 -2 9.3 -2 - -2 90.8 -2 7.2 -2 2.1 -2 9.2 -2 - -2Denmark 81.4 r,-2 18.6 r,-2 - r,-2 18.6 r,-2 - r,-2 97.9 -2 2.1 -2 - -2 2.1 -2 - -2Finland 90.8 r,-2 x(4) x(4) 9.2 r,-2 - r,-2 99.0 r,-2 x(9) x(9) 1.0 r,-2 - r,-2France 95.5 -2 4.5 -2 - -2 4.5 -2 - -2 92.5 -2 6.2 -2 1.3 -2 7.5 -2 1.6 -2Germany 72.2 r,-2 x(4) x(4) 27.8 r,-2 . r,-2 87.0 r,-2 x(9) x(9) 13.0 r,-2 ...Greece ... ... ... ... ... ... ... ... ... ...Hungary 93.8 r,-2 x(4) x(4) 6.2 r,-2 - r,-2 94.7 r,-2 x(9) x(9) 5.3 r,-2 - r,-2Iceland 72.7 -1 23.3 -1 4.0 -1 27.3 -1 - -1 96.1 -1 3.6 -1 0.2 -1 3.9 -1 ...Ireland 96.8 -1 3.2 -1 x(2) 3.2 -1 ... 97.7 -1 2.3 -1 x(7) 2.3 -1 ...Italy 93.1 -1 6.9 -1 - -1 6.9 -1 - -1 96.8 -1 3.2 -1 - -1 3.2 -1 0.4 -1Japan 43.8 -1 38.7 -1 17.5 -1 56.2 -1 - -1 89.9 -1 7.6 -1 2.5 -1 10.1 -1 x(9)Luxembourg ... ... ... ... ... ... ... ... ... ...254
G l o b a l e d u c a t i o n d i g e s t 2 0 1 0 C o m p a r i n g e d u c a t i o n s t a t i s t i c s a r o u n d t h e w o r l dTertiary education(ISCED 5-6)All levelsPublicsourcesHouseholdexpenditurePrivate sourcesExpenditure ofother privateentitiesAll privatesources kPrivate,of whichsubsidisedPublicsourcesHouseholdexpenditurePrivate sourcesExpenditure ofother privateentitiesAll privatesources k11 12 13 14 15 16 17 18 19 20Private,of whichsubsidisedCountry or territoryWEI countries79.9 -1 10.4 -1 9.7 -1 20.1 -1 ... 87.3 -1 10.8 -1 1.9 -1 12.7 -1 ... Argentina... ... ... ... ... ... ... ... ... ... Brazil16.1 -1 82.5 -1 1.4 -1 83.9 -1 5.9 -1 55.6 -1 42.4 -1 2.0 -1 44.4 -1 1.8 -1 Chile... ... ... ... ... ... ... ... ... ... China... ... ... ... ... ... ... ... ... ... Egypt... ... ... ... ... ... ... ... ... ... India... ... ... ... ... ... ... ... ... ... Indonesia... ... ... ... ... ... ... ... ... ... Jamaica... ... ... ... ... … … … … … Jordan... ... ... ... ... ... ... ... ... ... Malaysia55.3 -1 44.7 -1 . -1 44.7 -1 - -1 74.8 -1 25.2 -1 . -1 25.2 -1 0.3 -1 Paraguay33.8 66.2 - 66.2 ... 60.8 39.2 - 39.2 ... Peru... ... ... ... . -1 … . -1 ... ... . -1 Philippines... ... ... ... ... ... ... ... ... ... Russian Federation... ... ... ... ... ... ... ... ... ... Sri Lanka... ... ... ... ... 67.6 -2 32.2 -2 0.2 -2 32.4 -2 ... Thailand... ... ... ... ... ... ... ... ... ... Tunisia... ... ... ... ... ... ... ... ... ... UruguayOECD countries44.3 -1 38.1 -1 17.6 -1 55.7 -1 0.6 -1 69.5 -1 23.0 -1 7.5 -1 30.5 -1 4.4 -1 Australia85.4 -1 5.7 -1 8.9 -1 14.6 -1 8.1 -1 91.0 -1 4.8 -1 4.1 -1 9.0 -1 4.6 -1 Austria90.3 -1 4.6 -1 5.1 -1 9.7 -1 4.1 -1 94.4 -1 4.4 -1 1.2 -1 5.6 -1 1.7 -1 Belgium53.4 -2 22.2 -2 24.4 -2 46.6 -2 0.6 -2 73.8 -2 11.7 -2 14.5 -2 26.2 -2 ... Canada82.1 r,-2 9.0 r,-2 8.9 r,-2 17.9 r,-2 ... 88.9 -2 7.6 -2 3.6 -2 11.1 -2 - -2 Czech Republic96.4 -2 3.6 -2 - -2 3.6 -2 - -2 91.9 -2 4.5 -2 3.5 -2 8.1 -2 - -2 Denmark95.5 r,-2 x(14) x(14) 4.5 r,-2 - r,-2 97.5 r,-2 x(19) x(19) 2.5 r,-2 - r,-2 Finland83.7 -2 10.1 -2 6.2 -2 16.3 -2 2.4 -2 90.9 -2 6.8 -2 2.3 -2 9.1 -2 1.6 -2 France85.0 r,-2 x(14) x(14) 15.0 r,-2 ... 85.2 r,-2 x(19) x(19) 14.8 r,-2 ... r,-2 Germany... ... ... ... ... ... ... ... ... ... Greece77.9 r,-2 x(14) x(14) 22.1 r,-2 - r,-2 90.5 r,-2 x(19) x(19) 9.5 r,-2 - r,-2 Hungary91.0 -1 8.3 -1 0.7 -1 9.0 -1 ... 90.1 -1 8.6 -1 1.3 -1 9.9 -1 ... Iceland87.4 -1 12.6 -1 2.3 -1 14.9 -1 x(14) 95.3 -1 4.7 -1 0.6 -1 5.3 -1 x(19) Ireland69.9 -1 22.0 -1 8.1 -1 30.1 -1 5.7 -1 91.1 -1 7.3 -1 1.6 -1 8.9 -1 0.2 -1 Italy32.8 -1 51.6 -1 15.6 -1 67.2 -1 x(14) 66.9 -1 21.8 -1 11.4 -1 33.1 -1 ... Japan... ... ... ... ... ... ... ... ... ... Luxembourg255
RELATIVE PROPORTIONS OF PUBLIC AND PRIVATE EXPENDITURE ON EDUCATIONALT a b l e25 INSTITUTIONS / 2008 (WEI and UOE countries)Country or territoryPublicsourcesHouseholdexpenditurePre-primary(ISCED 0)Private sourcesExpenditure ofother privateentitiesAll privatesources kPrivate,of whichsubsidisedPrimary, secondary and post-secondary non-tertiary(ISCED 1-4)PublicsourcesHouseholdexpenditurePrivate sourcesExpenditure ofother privateentitiesAll privatesources k1 2 3 4 5 6 7 8 9 10Private,of whichsubsidisedMexico 81.9 18.1 0.1 18.2 0.2 82.2 17.8 0.1 18.0 1.4Netherlands 98.6 -2 1.4 -2 . -2 1.4 -2 1.0 -2 86.9 -2 5.1 -2 7.9 -2 13.1 -2 2.2 -2New Zealand 62.4 -1 32.4 -1 5.3 -1 37.6 -1 ... 86.6 -1 13.3 -1 0.1 -1 13.4 -1 ...Norway 91.0 -1 9.0 -1 ... 9.0 -1 - -1 ... ... ... ... ...Poland 85.8 -1 14.2 -1 ... 14.2 -1 - -1 98.6 -1 1.4 -1 x(7) 1.4 -1 ...Portugal ... ... ... ... ... 99.9 r,-2 0.1 r,-2 x(7) 0.1 r,-2 ...Republic of Korea 49.7 -1 47.7 -1 2.6 -1 50.3 -1 15.0 -1 77.8 -1 20.1 -1 2.1 -1 22.2 -1 1.1 -1Slovakia 83.9 -1 13.9 -1 2.2 -1 16.1 -1 1.0 -1 89.3 -1 7.0 -1 3.7 -1 10.7 -1 0.2 -1Spain 78.2 -1 21.8 -1 ... 21.8 -1 - -1 92.9 -1 7.1 -1 ... 7.1 -1 - -1Sweden 100.0 -1 - -1 . -1 - -1 - -1 100.0 -1 - -1 . -1 - -1 - -1Switzerland ... ... ... ... ... 86.6 -2 - -2 13.4 -2 13.4 -2 0.7 -2Turkey ... ... ... ... ... ... ... ... ... ...United Kingdom 92.7 -2 7.3 -2 - -2 7.3 -2 - -2 76.8 -2 13.7 -2 9.5 -2 23.2 -2 15.8 -2United States of America 77.6 -2 22.4 -2 . -2 22.4 -2 . -2 91.5 -2 8.5 -2 . -2 8.5 -2 . -2Other UOE countriesAlbania ... ... ... ... ... ... ... ... ... ...Bosnia and Herzegovina ... ... ... ... ... ... ... ... ... ...Bulgaria 91.9 -1 8.1 -1 - -1 8.1 -1 . -1 97.5 -1 1.9 -1 0.6 -1 2.5 -1 . -1Croatia ... ... ... ... ... ... ... ... ... ...Cyprus 78.9 -1 17.2 -1 3.8 -1 21.1 -1 - -1 91.5 -1 7.6 -1 0.9 -1 8.5 -1 - -1Estonia 98.8 -1 1.2 -1 - -1 1.2 -1 - -1 98.8 -1 1.1 -1 0.1 -1 1.2 -1 ...Israel 77.9 -1 20.3 -1 1.8 -1 22.1 -1 - -1 92.7 -1 4.5 -1 2.8 -1 7.3 -1 1.3 -1Latvia 98.4 -1 1.5 -1 0.1 -1 1.6 -1 x(4) 97.3 -1 2.5 -1 0.2 -1 2.7 -1 x(9)Liechtenstein ... ... ... ... - -1 ... ... ... ... - -1Lithuania ... ... ... ... - -1 99.3 -1 0.2 -1 0.5 -1 0.7 -1 - -1Malta ... ... ... ... ... ... ... ... ... ...Romania 96.9 -1 2.1 -1 1.0 -1 3.1 -1 . -1 98.6 -1 0.8 -1 0.7 -1 1.4 -1 . -1Slovenia 83.9 -1 16.0 -1 0.1 -1 16.1 -1 - -1 90.4 -1 9.1 -1 0.6 -1 9.6 -1 - -1The former Yugoslav Rep. of Macedonia ... ... ... ... ... ... ... ... ... ...krIncluding subsides attributable to payments to educational institutions received from public sources.Revised data, for more details see the OECD publication Education at a Glance (Tables B3.2a, B3.2b and B3.1). For details, see technical note F in the Reader’s Guide.Notes: To calculate private funds net of subsidies, subtract public subsidies (columns 5, 10, 15) from private funds (columns 4, 9, 14).To calculate total public funds, including public subsidies, add public subsidies (columns 5, 10, 15) to direct public funds (columns 1, 6, 11).Please refer to the Reader’s Guide for more information on the data and symbols used in each table.256
G l o b a l e d u c a t i o n d i g e s t 2 0 1 0 C o m p a r i n g e d u c a t i o n s t a t i s t i c s a r o u n d t h e w o r l dTertiary education(ISCED 5-6)All levelsPublicsourcesHouseholdexpenditurePrivate sourcesExpenditure ofother privateentitiesAll privatesources kPrivate,of whichsubsidisedPublicsourcesHouseholdexpenditurePrivate sourcesExpenditure ofother privateentitiesAll privatesources k11 12 13 14 15 16 17 18 19 20Private,of whichsubsidisedCountry or territory71.7 28.3 0.4 28.7 1.1 80.4 19.6 0.2 19.8 1.2 Mexico73.4 -2 15.5 -2 11.1 -2 26.6 -2 0.8 -2 84.3 -2 7.5 -2 8.2 -2 15.7 -2 1.7 -2 Netherlands63.0 -1 37.0 -1 - -1 37.0 -1 x(14) 79.9 -1 19.7 -1 0.4 -1 20.1 -1 ... New Zealand97.0 -1 3.0 -1 ... 3.0 -1 ... 98.7 -1 1.3 -1 ... 1.3 -1 ... Norway71.5 -1 28.5 -1 ... 28.5 -1 - -1 90.6 -1 9.4 -1 ... 9.4 -1 x(19) Poland66.7 -2 27.6 -2 5.7 -2 33.3 -2 x(14) 92.0 -2 6.7 -2 1.4 -2 8.0 -2 ... Portugal20.8 -1 52.7 -1 26.5 -1 79.2 -1 2.4 -1 57.6 -1 30.8 -1 11.5 -1 42.4 -1 2.1 -1 Republic of Korea76.2 -1 8.7 -1 15.1 -1 23.8 -1 ... 86.2 -1 7.9 -1 5.9 -1 13.8 -1 ... Slovakia79.0 -1 16.6 -1 4.4 -1 21.0 -1 1.8 -1 87.3 -1 11.7 -1 1.1 -1 12.7 -1 0.4 -1 Spain89.3 -1 - -1 10.7 -1 10.7 -1 . -1 97.4 -1 - -1 2.6 -1 2.6 -1 - -1 Sweden... ... ... ... ... ... ... ... ... ... Switzerland... ... ... ... ... ... ... ... ... ... Turkey64.8 -2 26.6 -2 8.6 -2 35.2 -2 - -2 75.3 -2 16.0 -2 8.7 -2 24.7 -2 12.3 -2 United Kingdom34.0 -2 36.3 -2 29.7 -2 66.0 -2 ... 68.0 -2 20.3 -2 11.8 -2 32.0 -2 ... United States of AmericaOther UOE countries... ... ... ... ... ... ... ... ... ... Albania... ... ... ... ... ... ... ... ... ... Bosnia and Herzegovina55.0 -1 43.9 -1 1.1 -1 45.0 -1 . -1 85.0 -1 14.4 -1 0.6 -1 15.0 -1 . -1 Bulgaria... ... ... ... ... ... ... ... ... ... Croatia48.0 -1 50.6 -1 1.4 -1 52.0 -1 7.3 -1 82.5 -1 16.3 -1 1.2 -1 17.5 -1 1.4 -1 Cyprus77.1 -1 21.0 -1 1.9 -1 22.9 -1 5.6 -1 93.5 -1 6.0 -1 0.5 -1 6.5 -1 1.4 -1 Estonia51.9 -1 33.2 -1 14.9 -1 48.1 -1 5.6 -1 77.8 -1 16.0 -1 6.2 -1 22.2 -1 2.2 -1 Israel65.8 -1 33.5 -1 0.6 -1 34.2 -1 x(14) 89.6 -1 10.1 -1 0.3 -1 10.4 -1 ... Latvia... ... ... ... - -1 ... ... ... ... - -1 Liechtenstein66.7 -1 26.4 -1 6.9 -1 33.3 -1 - -1 90.7 -1 7.1 -1 2.2 -1 9.3 -1 - -1 Lithuania... ... ... ... ... ... ... ... ... ... Malta67.1 -1 29.8 -1 3.0 -1 32.9 -1 . -1 87.9 -1 10.6 -1 1.4 -1 12.1 -1 . -1 Romania77.2 -1 16.7 -1 6.2 -1 22.8 -1 - -1 86.7 -1 11.6 -1 1.7 -1 13.3 -1 - -1 Slovenia... ... ... ... ... ... ... ... ... ... The former Yugoslav Rep. of Macedonia257
T a b l e26DISTRIBUTION OF TOTAL PUBLIC EXPENDITURE ON EDUCATION BY DESTINATIONOF FUNDS / 2008 (WEI and UOE countries)Country or territoryDirect publicexpenditure onpublic institutionsPrimary, secondary andpost-secondary non-tertiary(ISCED 1-4)Direct publicexpenditure onprivate institutionsIndirect publictransfers and paymentsto the private sectorDirect publicexpenditure onpublic institutionsTertiary(ISCED 5-6)Direct publicexpenditure onprivate institutionsIndirect publictransfers and paymentsto the private sector1 2 3 4 5 6WEI countriesArgentina 86.6 -1 12.1 -1 1.3 -1 96.2 -1 3.1 -1 0.7 -1Brazil (p) 98.4 -1 - -1 1.6 -1 90.0 -1 - -1 10.0 -1Chile 60.2 -1 39.3 -1 0.5 -1 27.7 -1 24.8 -1 47.5 -1China … … … … … …Egypt … … … … … …India 76.9 -2 ... ... 81.7 -2 18.0 -2 0.3 -2Indonesia … … … … … …Jamaica 94.2 x(1) 4.6 99.3 x(4) 0.7Jordan 100.0 -1 . -1 . -1 ... ... ...Malaysia … … … … … …Paraguay 92.7 -1 5.7 -1 1.7 -1 100.0 -1 . -1 . -1Peru 99.2 . 0.8 99.0 . 1.0Philippines 97.7 -1 . -1 2.3 -1 100.0 -1 . -1 . -1Russian Federation (p) ... . -2 ... ... . -2 ...Sri Lanka ... ... ... ... ... ...Thailand 92.7 -1 7.3 -1 - -1 … … …Tunisia 100.0 -1 . -1 . -1 100.0 -1 . -1 . -1Uruguay 100.0 -2 . -2 - -2 100.0 -2 . -2 - -2OECD countriesAustralia 71.9 -1 16.9 -1 11.3 -1 68.2 -1 0.4 -1 31.4 -1Austria 97.8 -1 x(1) 2.2 -1 76.5 -1 x(4) 23.5 -1Belgium 44.3 -1 53.2 -1 2.5 -1 40.7 -1 45.0 -1 14.2 -1Canada … … … … … …Czech Republic … … … … … …Denmark 82.7 -2 6.8 -2 10.5 -2 70.5 -2 - -2 29.5 -2Finland 90.2 -1 6.6 -1 3.1 -1 76.9 -1 7.4 -1 15.7 -1France 84.2 -2 12.6 -2 3.1 -2 86.6 -2 5.4 -2 8.0 -2Germany 84.9 -2 10.4 -2 4.7 -2 79.4 -2 1.1 -2 19.5 -2Greece … … … … … …Hungary 82.9 -2 12.8 -2 4.4 -2 74.1 -2 10.8 -2 15.1 -2Iceland 96.7 -1 2.2 -1 1.1 -1 67.0 -1 10.5 -1 22.5 -1Ireland 91.0 -2 - -2 9.0 -2 85.6 -2 - -2 14.4 -2Italy 96.4 -1 1.1 -1 2.4 -1 78.0 -1 2.4 -1 19.6 -1Japan 96.4 -1 3.6 -1 0.1 -1 62.9 -1 12.6 -1 24.6 -1258
G l o b a l e d u c a t i o n d i g e s t 2 0 1 0 C o m p a r i n g e d u c a t i o n s t a t i s t i c s a r o u n d t h e w o r l dCountry or territoryDirect publicexpenditure onpublic institutionsPrimary, secondary andpost-secondary non-tertiary(ISCED 1-4)Direct publicexpenditure onprivate institutionsIndirect publictransfers and paymentsto the private sectorDirect publicexpenditure onpublic institutionsTertiary(ISCED 5-6)Direct publicexpenditure onprivate institutionsIndirect publictransfers and paymentsto the private sector1 2 3 4 5 6Luxembourg … … … … … …Mexico 94.2 - 5.8 95.7 . 4.3Netherlands 91.2 -2 . -2 8.8 -2 70.4 -2 . -2 29.6 -2New Zealand 88.8 -1 3.8 -1 7.4 -1 55.4 -1 2.3 -1 42.3 -1Norway 87.2 -1 3.7 -1 9.1 -1 53.9 -1 2.3 -1 43.8 -1Poland (p) … … … … … …Portugal 91.6 -2 6.8 -2 1.6 -2 87.2 -2 1.1 -2 11.6 -2Republic of Korea 80.8 -1 17.7 -1 1.5 -1 58.6 -1 28.5 -1 13.0 -1Slovakia 88.5 -1 6.9 -1 4.6 -1 79.4 -1 - -1 20.6 -1Spain 84.1 -2 14.1 -2 1.8 -2 90.5 -2 1.6 -2 7.9 -2Sweden 84.7 -1 9.8 -1 5.5 -1 70.7 -1 5.5 -1 23.8 -1Switzerland (p) 89.8 -1 7.4 -1 2.8 -1 88.3 -1 6.4 -1 5.3 -1Turkey (p) 97.8 -2 . -2 2.2 -2 83.1 -2 . -2 16.9 -2United Kingdom 74.9 -2 6.6 -2 18.5 -2 . -2 73.6 -2 26.4 -2United States of America 99.8 -1 0.2 -1 . -1 71.2 -1 7.4 -1 21.5 -1Other UOE countriesAlbania ... ... ... ... ... ...Bosnia and Herzegovina ... ... ... ... ... ...Bulgaria 83.5 -1 . -1 16.5 -1 90.7 -1 . -1 9.3 -1Croatia ... ... ... ... ... ...Cyprus 99.6 -1 0.4 -1 - -1 40.0 -1 1.0 -1 59.0 -1Estonia 95.6 -1 1.2 -1 3.2 -1 23.8 -1 63.6 -1 12.7 -1Israel 74.0 -1 24.6 -1 1.4 -1 4.8 -1 84.1 -1 11.0 -1Latvia 94.9 -1 0.3 -1 4.8 -1 3.5 -1 91.4 -1 5.1 -1Liechtenstein 99.5 -1 0.5 -1 - -1 - -1 100.0 -1 - -1Lithuania 97.7 -1 0.3 -1 2.0 -1 84.9 -1 0.7 -1 14.5 -1Malta ... ... ... ... ... ...Romania 98.3 -1 0.1 -1 1.6 -1 96.2 -1 0.1 -1 3.8 -1Slovenia 95.2 -1 0.7 -1 4.1 -1 75.8 -1 1.4 -1 22.8 -1The former Yugoslav Rep. of Macedonia ... ... ... ... ... ...(p) Public institutions only.Please refer to the Reader’s Guide for more information on the data and symbols used in each table.259
A N N E XAGlossaryCapping. Indicators that surpass a theoretical maximum of 100% are adjusted using acapping factor. Net enrolment rates in primary education are capped using a factor thattakes into account the enrolment of primary school-age children in pre-primary, primaryand secondary education by sex. For all other indicators regarding male, female and bothsexes combined, the highest value (whether for male or female) is set to 100%. The othertwo indicators are then re-calculated so that the gender parity index of the new set of valuesremains the same as for the original values.Class. A class is made up of the students who are following a common course of study.Pupils/students are grouped together in a class based on the highest number of commoncourses, usually compulsory studies. A class is the pedagogical structure in which eachstudent is registered. Regardless of the level of study, a student is registered in only oneclass. Students from different grades may be present in the same class, as occurs in oneteacheror two-teacher schools. Conversely, a school may have a number of classes for thesame grade.Compulsory education. The number of years or age span during which children are legallyobliged to attend school.Duration. The number of grades or years in a given level of education.Early Childhood Care and Education (ECCE). Programmes that, in addition to providingchildren with care, offer a structured and purposeful set of learning activities either in aformal institution (pre-primary or ISCED 0) or as part of a non-formal child developmentprogramme. ECCE programmes are typically designed for children aged 3 years and up,occurring before primary education, and include organized learning activities that run onaverage for an equivalent of at least two hours per day and 100 days per year.Educational attainment. The educational attainment of an individual is defined as the ISCEDlevel corresponding to the highest educational programme successfully completed.Educational institutions (public and private). Educational institutions are defined asentities that provide instructional or education-related services to individuals and othereducational institutions. Whether or not an entity qualifies as an educational institution isnot contingent upon which public authority (if any) has responsibility for it.Educational institutions are classified as either public or private according to whether apublic agency or a private entity has the ultimate power to make decisions concerning theinstitution’s affairs.An institution is classified as public if it is controlled and managed directly by a publiceducation authority or agency; or controlled and managed either by a government agencydirectly or by a governing body (council, committee, etc.), most of whose members areeither appointed by a public authority or elected by public franchise.261
g l o s s a r yAn institution is classified as private if it is controlled and managed by a non-governmentalorganisation (e.g. a church, trade union or business enterprise), or if its governing boardconsists mostly of members not selected by a public agency. In general, the ultimatemanagement control over an institution rests with who has the power to determine thegeneral activity of the school and appoint the managing officers. The extent to whichan institution receives its funding from public or private sources does not determine theclassification status of the institution.A distinction is made between government-dependent and independent privateinstitutions on the basis of the degree of a private institution’s dependence on funding fromgovernment sources. A government-dependent private institution is one that receives morethan 50% of its core funding from government agencies. An independent private institutionis one that receives less than 50% of its core funding from government agencies. Corefunding refers to the funds that support the basic educational services of the institution.It does not include funds provided specifically for research projects, payments for servicespurchased or contracted by private organisations, or fees and subsidies received forancillary services such as lodging and meals. Additionally, institutions should be classifiedas government-dependent if their teaching staff are paid by a government agency, eitherdirectly or indirectly.Enrolment. The number of pupils or students officially enrolled in a given grade or levelof education, regardless of age. Typically, these data are collected at the beginning of theschool year.Entrance age (theoretical). The age at which pupils or students have entered a givenprogramme or level of education assuming they had started at the official entrance agefor the lowest level of education, had studied full-time throughout, and had progressedthrough the system without repeating or skipping a grade.Expenditure on educationTotal public expenditure on education. The sum of all expenditure on education andeducation administration made by local, regional and national/central governments,including municipalities. Intergovernmental transfers are excluded.Current expenditure on education. Expenditure for goods and services consumedwithin the current year and which would be renewed if needed in the following year. Itincludes expenditure on staff salaries, pensions and benefits; contracted or purchasedservices; other resources, including books and teaching materials; welfare services;and other current expenditure, such as subsidies for students and households, minorequipment, minor repairs, fuel, telecommunications, travel, insurance and rents.Capital expenditure on education. Expenditure for assets that last longer than one year.It includes expenditure for construction, renovation and major repairs of buildings andthe purchase of heavy equipment or vehicles.Public subsidies. Public subsidies to households and other private entities consist oftransfers to the private sector for educational institutions and transfers for studentliving costs and other education-related costs that occur outside educationalinstitutions.262
G l o b a l e d u c a t i o n d i g e s t 2 0 1 0 C o m p a r i n g e d u c a t i o n s t a t i s t i c s a r o u n d t h e w o r l dPublic subsidies to households and other private entities for educational institutionsare composed of government transfers and certain other payments to students orhouseholds, insofar as these translate into payments to educational institutions foreducational services (for example, fellowships, financial aid or student loans for tuition).They also include government transfers and other payments (mainly subsidies) toprivate entities other than households, including, for example, subsidies to firms orlabour organisations that operate apprenticeship programmes and interest subsidies toprivate financial institutions that provide student loans, etc.Public subsidies to households that are not attributable to payments to educationalinstitutions include subsidies for student living costs and the value of special subsidiesprovided to students, either in cash or in kind, such as free or reduced-price travel onpublic transport or family allowances that are contingent on student status.Fields of education (broad)Science and technology fieldsScience: life sciences; physical sciences; mathematics and statistics; computer sciences.Engineering, manufacturing and construction: engineering and engineering trades;manufacturing and processing; architecture and building.Other fieldsAgriculture: agriculture, forestry and fishery; veterinary science.Education: teacher training; education science; educational assessment.Health and welfare: medicine; medical services; nursing; dental services; social care;social work.Humanities and arts: religion and theology; foreign languages and cultures; nativelanguages; interpretation and translation; linguistics; comparative literature; history;archaeology; philosophy; ethics. Fine arts; performing arts; graphic and audio-visualarts; design; craft skills.Social science, business and law: social and behavioural science; journalism andinformation; business and administration; law.Services: personal services; transport services; environmental protection; securityservices.Basic programmes, literacy, numeracy and personal development – together with programmesfor which the field is unknown – are classified as “not known or unspecified”.Graduate. A person who has successfully completed the final year of a level or sub-level ofeducation. In some countries, completion occurs as a result of passing an examination or aseries of examinations. In other countries, it occurs after a requisite number of course hourshave been accumulated. Sometimes both types of completion occur within a country. ForUOE survey participating countries, graduations, instead of graduates, are used to calculatepercentages by field of education (due to the UOE instrument design). Graduations referto the number of qualifications obtained during the reference period; one graduation iscounted once for every qualification obtained.263
g l o s s a r yGross domestic product (GDP). The sum of gross value added by all resident producers inthe economy, including distributive trades and transport, plus any product taxes and minusany subsidies not included in the value of the products.GDP per capita. The gross domestic product divided by the mid-year population.Gross national income (GNI). The sum of gross value added by all resident producers in theeconomy, including distributive trades and transport, plus any product taxes, minus anysubsidies not included in the value of the products, plus net receipts of income from abroad.Since net receipts from abroad may be positive or negative, it is possible for GNI to begreater or smaller than GDP. GNI is also referred to as Gross National Product (GNP).Intended instruction time for students. Refers to the number of hours per year that pupilsare instructed according to the compulsory and flexible part of the intended curriculum.The total number of intended instruction hours per year is calculated by multiplying thetotal number of classroom sessions per year by the duration of one session. The intendedcurriculum is the subject matter content, as defined by the government or the educationsystem. The intended curriculum is embodied in textbooks, curriculum guides, the contentof examinations, and in policies, regulations and other official statements generated todirect the education system. The intended curriculum comprises compulsory subjects, aswell as the flexible part of the curriculum (subjects of the intended curriculum).International Standard Classification of Education (ISCED). A classification system thatprovides a framework for the comprehensive statistical description of national educationalsystems and a methodology that translates national educational programmes intointernationally comparable levels of education. The basic unit of classification in ISCED isthe educational programme. ISCED also classifies programmes by field of study, programmeorientation and destination (see Annex C).International (or internationally mobile) students. Students who have crossed a national orterritorial border for the purposes of education and are now enrolled outside their countryof origin.Instruction time (teaching time). Statutory instruction time (sometimes also referred toas teaching time) is defined as the total number of hours per year for which a full-timeclassroom teacher is responsible for teaching a group or class of students, according to theformal policy in the specific country. Periods of time formally allowed for breaks betweenlessons or groups of lessons may be excluded. Teaching hours per year are calculated on thebasis of teaching hours per day multiplied by the number of teaching days per year, or onthe basis of teaching hours per week multiplied by the number of weeks per year that theschool is open for teaching. The number of hours per year that fall on days when the schoolis closed are excluded. When no formal data are available, the number of teaching hours isestimated from survey data.Literacy. The ability to read and write, with understanding, a simple statement related toone’s daily life. It involves a continuum of reading and writing skills, and often includes basicarithmetic skills (numeracy).264
G l o b a l e d u c a t i o n d i g e s t 2 0 1 0 C o m p a r i n g e d u c a t i o n s t a t i s t i c s a r o u n d t h e w o r l dNew entrants. Pupils or students entering a given level of education, grade or programmefor the first time.Orientation of educational programmesGeneral education. This type of programme is designed mainly to lead pupils to adeeper understanding of a subject or group of subjects, especially, but not necessarily,with a view to preparing pupils for further education at the same or higher level.These programmes are typically school-based and may contain vocational elements.Successful completion of these programmes may or may not lead to an academicqualification. However, they do not typically allow successful completers to enter aparticular occupation, trade, or class of occupations or trades without further training.General education has a technical or vocational content of less than 25%, but pretechnical/pre-vocationalprogrammes (i.e. programmes with a technical/vocationalcontent of more than 25% that do not lead to a labour-market relevant vocational ortechnical qualification) are typically reported with general programmes.Technical and vocational education. This type of programme is designed mainly tolead pupils to acquire the practical skills, know-how and understanding necessary foremployment in a particular occupation or trade (or class of occupations or trades).Successful completion of such programmes normally leads to a labour-market relevantvocational qualification recognised by the competent authorities (e.g. Ministry ofEducation, employers’ associations, etc.) in the country in which it is obtained.Purchasing power parity (PPP). Purchasing power parities (PPPs) are the currency exchangerates that equalise the purchasing power of different currencies. This means that a givensum of money, when converted into U.S. dollars at the PPP rate (PPP dollars), will buy thesame basket of goods and services in all countries. In other words, PPPs are the rates ofcurrency conversion which eliminate the differences in price levels among countries.Thus, comparisons between countries reflect only differences in the volume of goods andservices purchased.Repeater. Pupil enrolled in the same grade for a second or further year.School-age population. Population of the age group theoretically corresponding to a givenlevel of education, as indicated by theoretical entrance age and duration.School life expectancy. The number of years a person of school entrance age can expect tospend within the specified levels.StudentsStudents/pupils. Pupils refer to children enrolled in an educational programme, whereaschildren or adults enrolled at more advanced levels are students.Full-time students. Students engaged in an educational programme for a number ofhours of study statutorily regarded as full-time at a particular level of education in agiven country.Part-time students. Students whose statutory study hours are less than those requiredof full-time students in a given level and country.265
g l o s s a r yFull-time equivalent number of students. These are generally calculated inperson‐years. The unit for the measurement of full-time equivalence is a full-timestudent. Thus, a full-time student equals one full-time equivalent. The full-timeequivalence of part-time students is determined by calculating the ratio of their hoursstudied to the statutory hours studied by a full-time student during the school year. Forexample, a student who studied one-third of the statutory hours of a full-time studentequals one-third of a full-time equivalent student.TeachersTeaching staff. Persons employed full-time or part-time in an official capacity forthe purpose of guiding and directing the learning experience of pupils and students,irrespective of their qualification or the delivery mechanism (i.e. whether face-to-faceor at a distance). This definition excludes educational personnel who have no activeteaching duties (e.g. headmasters, headmistresses or principals who do not teach) orwho work occasionally or in a voluntary capacity in educational institutions.Trained teachers. Teachers who have received the minimum organised teacher training(pre-service or in-service) required for teaching at the relevant level in a given country.Full-time teachers. Persons engaged in teaching for a number of hours of workstatutorily regarded as full-time at the particular level of education in a given country.Part-time teachers. Teachers whose statutory working hours are less than thoserequired of full-time teachers in a given country.Full-time equivalent number of teachers. The equivalent is calculated in person-years.The unit for the measurement of full-time equivalence is a full-time teacher. Thus, afull-time teacher equals one full-time equivalent. The full-time equivalence of part-timeteachers is determined by calculating the ratio of their hours worked to the statutoryhours worked by a full-time teacher during the school year. For example, a teacherwho works one-third of the statutory hours of a full-time teacher equals one-third of afull‐time equivalent teacher.Teachers’ salaries. Teachers’ salaries are expressed as statutory salaries, which arescheduled salaries according to official pay scales. They refer to the average scheduledgross salary per year for a full-time teacher with the minimum training necessary tobe fully qualified at the beginning of his or her teaching career. Reported salaries aredefined as the sum of wages (total sum of money paid by the employer for the laboursupplied) minus the employer’s contribution to social security and pension funding(according to existing salary scales). Bonuses that constitute a regular part of thesalary (such as holidays or regional bonuses) are included in the figures. Additionalbonuses (for example, remuneration for teachers in remote areas, for participating inschool improvement projects or special activities, or for exceptional performance) areexcluded from the reported gross salaries. Salaries at 15 years’ experience refer to thescheduled annual salary of a full-time classroom teacher with the minimum trainingnecessary to be fully qualified and with 15 years of experience. The maximum salariesreported refer to the scheduled maximum annual salary (top of the salary scale) of a266
G l o b a l e d u c a t i o n d i g e s t 2 0 1 0 C o m p a r i n g e d u c a t i o n s t a t i s t i c s a r o u n d t h e w o r l dfull‐time classroom teacher with the minimum training to be fully qualified for his or herjob. Salary data are reported in accordance with formal policies for public institutions.For more definitions, please refer to the UIS multilingual online glossary atwww.uis.unesco.org/glossary267
A N N E XBDefinitions of indicatorsClass size. Class size is the number of enrolled students divided by the number of classesfor the whole country. In order to ensure comparability among countries, special needsprogrammes have been excluded. Data include only regular programmes at primary andlower secondary levels of education and exclude teaching in sub-groups outside the regularclassroom setting.Education financeEducational expenditure by nature of spending as a percentage of total educationalexpenditure on public institutions, by level. Spending by nature (salaries, other current,total current or capital) expressed as a percentage of the expenditure for publiceducational institutions of the specified level. Salaries and other current expenditureadd up to total current expenditure. Public subsidies to the private sector andadministrative costs should be excluded.Public expenditure per pupil, or student by level as a percentage of GDP per capita.Total public expenditure per student in the specified level expressed as a percentage ofGDP per capita.Total public expenditure per pupil, or student, by level (PPP US$). Total publicexpenditure per pupil or student in the specified level expressed in U.S. dollars andadjusted in terms of purchasing power parity.Total expenditure on educational institutions and educational administration as apercentage of GDP, by source. Expenditure from public, private and internationalsources spent on educational institutions (i.e. schools, universities and similarinstructional institutions) and administration at a given level of education expressed asa percentage of GDP. This indicator excludes public subsidies to the private sector. Thus,data on public expenditure on educational institutions and educational administrationdiffer from total public expenditure on education.Total public expenditure on education as a percentage of GDP. Current and capitalexpenditures on education by local, regional and national governments, includingmunicipalities (household contributions are excluded), expressed as a percentage ofGDP.Total public expenditure on education as a percentage of total governmentexpenditure. Current and capital expenditures on education by local, regional andnational governments, including municipalities (household contributions are excluded),expressed as a percentage of total government expenditure on all sectors (includinghealth, education, social services, etc.).268
G l o b a l e d u c a t i o n d i g e s t 2 0 1 0 C o m p a r i n g e d u c a t i o n s t a t i s t i c s a r o u n d t h e w o r l dExpected gross intake ratio to the last grade of primary (EGIRLG). Total number of newentrants to the first grade of primary education in a given year, regardless of age, who areexpected to reach the last grade, regardless of repetition, expressed as a percentage ofthe population at the theoretical entrance age to primary education in the same year. Itis calculated by multiplying the gross intake ratio to primary education by the probabilityof survival to the last grade. It estimates future gross intake to the last grade of primaryeducation based on current new entrants to the first grade, assuming current gradetransition and repetition rates remain unchanged. It therefore predicts the effect on lastgrade intake of current education policies on entrance to primary education and futureyears of schooling.Gender parity index (GPI). The ratio of female-to-male values of a given indicator. A GPI of 1indicates parity between sexes.Gross intake ratio (GIR). Total number of new entrants in the first grade of primaryeducation, regardless of age, expressed as a percentage of the population at official primaryschool entrance age.Gross intake ratio to the last grade of primary (GIRLG). The total number of new entrantsin the last grade of primary education, regardless of age, expressed as a percentage of thepopulation of theoretical entrance age to the last grade.Gross enrolment ratio (GER). The number of pupils or students enrolled in a given level ofeducation, regardless of age, expressed as a percentage of the population in the theoreticalage group for the same level of education. For the tertiary level, the population used is the5-year age group following the official secondary school graduation age.Gross entry ratio. Total number of new entrants to a given programme, regardless of age,expressed as a percentage of the population of theoretical entrance age to this programme.Gross graduation ratio. Total number of graduates, regardless of age, from a given level orprogramme expressed as a percentage of the population at the theoretical graduation agefor that level or programme.Literacy rate. Total number of literate persons in a given age group, expressed as apercentage of the total population in that age group. The adult literacy rate measuresliteracy among persons aged 15 years and above, and the youth literacy rate measuresliteracy among persons aged 15 to 24 years.Mobility ratiosInbound mobility rate. Total number of students from abroad studying in a givencountry as a percentage of total tertiary enrolment in that country.Outbound mobility ratio. Total number of students from a given country studyingabroad as a percentage of total tertiary enrolment in that country.Net enrolment rate (NER). Total number of pupils or students in the theoretical age groupfor a given level of education enrolled in that level, expressed as a percentage of the totalpopulation in that age group.269
D e f i n i t i o n s o f i n d i c a t o r sPrimary net enrolment rate (adjusted) (ANER). Total number of pupils of the official primaryschool age who are enrolled in primary or secondary education, expressed as a percentageof the corresponding population. It assesses the level of achievement of the universalprimary education (UPE) goal and measures actual school participation of the officialprimary school age population.Net flow ratio of mobile students. Total number of tertiary students from abroad (inboundstudents) studying in a given country minus the number of students at the same levelof education from that country studying abroad (outbound students), expressed as apercentage of total tertiary enrolment in that country.Net intake rate (NIR). Total number of new entrants in the first grade of primary educationwho are of the theoretical primary school entrance age, expressed as a percentage of thepopulation of the same age.Net intake rate (adjusted) (ANIR). Total enrolment in primary education of pupils of officialprimary school entrance age, expressed as a percentage of the population of the same agein a given school year. It is the equivalent of the age-specific enrolment rate of the officialprimary entrance age. It measures the actual level of access to primary education of thepopulation of the official primary school entrance age.Percentage of female students. Total number of female students in a given level ofeducation, expressed as a percentage of the total number of students enrolled at that levelof education.Percentage of new entrants to primary education with ECCE experience. Total numberof new entrants to primary education who have attended some form of organised EarlyChildhood Care and Education (ECCE) programmes, expressed as a percentage of the totalnumber of new entrants to primary education.Percentage of private enrolment. Total number of pupils or students at a given level ofeducation enrolled in institutions that are not operated by a public authority but controlledand managed, whether for profit or not, by a private body (e.g. non-governmentalorganisation, religious body, special interest group, foundation or business enterprise)expressed as a percentage of the total number of pupils or students enrolled at the givenlevel of education.Percentage of repeaters. Total number of pupils or students who are enrolled in the samegrade as the previous year, expressed as a percentage of total enrolment in the given gradeof education.Percentage of technical/vocational enrolment. Total number of students enrolled intechnical/vocational programmes at a given level of education, expressed as a percentageof the total number of students enrolled in all programmes (technical/vocational andgeneral) at that level.Percentage of trained teachers. Total number of teachers who have received the minimumorganised teacher-training (pre-service or in service) required for teaching at the relevantlevel of education in a given country, expressed as a percentage of the total number ofteachers at the given level of education.270
G l o b a l e d u c a t i o n d i g e s t 2 0 1 0 C o m p a r i n g e d u c a t i o n s t a t i s t i c s a r o u n d t h e w o r l dPupil/teacher ratio. The average number of pupils per teacher at a level of educationspecified in a given school year, based on headcounts for both pupils and teachers.Regional averages. Regional averages are weighted averages, taking into account therelative size of the relevant population of each country. The figures for the countries withlarger populations thus have a proportionately greater influence on the regional aggregates.The averages are derived from published data complemented by imputed values for missingcountries. Imputations are based on publishable data for the same countries from previousyears. When imputing an indicator, information from related indicators are used to informabout trends. In the case of Afghanistan, China, Haiti, India, Pakistan, Papua New Guinea,the Russian Federation and Somalia imputations are partly based on UIS estimates.School life expectancy. The sum of age-specific enrolment rates for the levels of educationspecified. To compensate for the lack of reliable data by age for tertiary education, the grossenrolment ratio for tertiary education is multiplied by 5 and used as a proxy for age-specificenrolment rates. At all other ISCED levels, enrolment that is not distributed by age is dividedby the school-age population and multiplied by the duration of the given level before beingadded to the sum of the age-specific enrolment rates.School survival rates. The percentage of a cohort of pupils or students enrolled in thefirst grade of a given level or cycle of education in a given school year who are expected toreach a given grade, regardless of repetition. The school survival rates are calculated on thebasis of the reconstructed cohort method, which uses data on enrolment by grade for twoconsecutive years and repeaters by grade for the last year of these two years.Transition rate from primary to secondary general education. The number of new entrantsto the first grade of secondary education (general programmes only) in a given year,expressed as a percentage of the number of pupils enrolled in the final grade of primaryeducation in the previous year.For more definitions, please refer to the UIS multilingual online glossary atwww.uis.unesco.org/glossary271
A N N E XCInternational Standard Classification of Education (ISCED97)DESCRIPTION OF ISCED97 LEVELS, CLASSIFICATION CRITERIA AND SUB-CATEGORIES0 PRE-PRIMARY LEVEL OF EDUCATION Main criteriaInitial stage of organized instruction, designed primarily to introduce very young children toa school-type environment.Should be centre- or school-based, be designed to meet the educational and developmental needs of children of at least 3 years of age, andhave staff that are adequately trained (i.e. qualified) to provide an educational programme for children.1 PRIMARY LEVEL OF EDUCATION Main criteriaNormally designed to give pupils a sound basic education in reading, writingand mathematics.Beginning of systematic studies characteristic of primary education, e.g. reading, writing and mathematics. Entry into the nationallydesignated primary institutions or programmes. The commencement of reading activities alone is not a sufficient criteria for classificationof an educational programme at ISCED level 1.2 LOWER SECONDARY LEVEL OF EDUCATION Main criteriaThe lower secondary level of education generally continues the basic programmesof the primary level, although teaching is typically more subject-focused, oftenemploying more specialised teachers who conduct classes in their field of specialisation.Programmes at the start of level 2 correspond to the point where programmes are beginning to be organised in a more subjectorientedpattern, using more specialised teachers conducting classes in their field of specialisation.If this organizational transition point does not correspond to a natural split in the boundaries between national educational programmes,then programmes should be split at the point where national programmes begin to reflect this organisational change.3 UPPER SECONDARY LEVEL OF EDUCATION Main criteriaThe final stage of secondary education in most countries. Instruction is oftenmore organised along subject-matter lines than at ISCED level 2 and teachers typically needto have a higher level, or more subject-specific, qualification than at ISCED 2.National boundaries between lower secondary and upper secondary education should be the dominant factor for splitting levels 2 and 3.Admission into programmes at this level usually requires the completion of ISCED 2 for admission, or a combination of basic education andlife experience that demonstrates the ability to handle ISCED 3 subject matter.4 POST-SECONDARY NON-TERTIARY Main criteriaThese programmes straddle the boundary between upper secondary and postsecondaryeducation from an international point of view, even though they might clearlybe considered as upper secondary or post-secondary programmes in a national context.Students entering ISCED 4 programmes will typically have completed ISCED 3.They are often not significantly more advanced than programmes at ISCED 3 but they serveto broaden the knowledge of participants who have already completed a programme at level3. The students are typically older than those in ISCED 3 programmes.ISCED 4 programmes typically have a duration of 6 months to 2 years.5 FIRST STAGE OF TERTIARY EDUCATION Classification criteria for level and sub-categories (5A and 5B)ISCED 5 programmes have an educational content more advanced than those offeredat levels 3 and 4.Entry into these programmes normally requires the successful completion of ISCED level 3A or 3B or a similar qualification at ISCED level 4A.5A5BISCED 5A programmes are largely theoretically based and are intended to provide sufficientqualifications for gaining entry into advanced research programmes and professions withhigh skills requirements.ISCED 5B programmes are generally more practical/technical/occupationally specificthan ISCED 5A programmes.1. have a minimum cumulative theoretical duration (at tertiary level) of three years;2. typically require that the faculty have advanced research credentials;3. may involve completion of a research project or thesis;4. provide the level of education required for entry into a profession with high skills requirements or an advanced research programme.1. are more practically oriented and occupationally specific than programmes at ISCED 5A and do not prepare students for direct access toadvanced research programmes;2. have a minimum of two years’ duration;3. the programme content is typically designed to prepare students to enter a particular occupation.6 SECOND STAGE OF TERTIARY EDUCATION (LEADING TO AN ADVANCED RESEARCH QUALIFICATION)This level is reserved for tertiary programmes that lead to the award of an advanced researchqualification. The programmes are devoted to advanced study and original research.1. requires the submission of a thesis or dissertation of publishable quality that is the product of original research and represents asignificant contribution to knowledge;2. are not solely based on course-work;3. prepare participants for faculty posts in institutions offering ISCED 5A programmes, as well as research posts in government andindustry.272
G l o b a l e d u c a t i o n d i g e s t 2 0 1 0 C o m p a r i n g e d u c a t i o n s t a t i s t i c s a r o u n d t h e w o r l dFor a complete version of the ISCED97 classification, please see http://www.uis.unesco.org/publications/ISCED97Auxilary criteriaSub-categoriesPedagogical qualifications for the teaching staff; implementation of a curriculumwith educational elements.Auxilary criteriaIn countries where the age of compulsory attendance (or at least the age atwhich virtually all students begin their education) comes after the beginningof systematic study in the subjects noted, the first year of compulsoryattendance should be used to determine the boundary between ISCED 0 andISCED 1.Auxilary criteriaDestination for which the programmes havebeen designed to prepare students:Programme orientationIf there is no clear break-point for this organisational change, however,then countries should artificially split national programmes into ISCED 1 and 2 atthe end of six years of primary education.AProgrammes designed to prepare students for direct accessto level 3 in a sequence which would ultimately lead totertiary education, that is, entrance to ISCED 3A or 3B.GeneralEducation which is not designed explicitly to prepare participantsfor a specific class of occupations or trades or for entry intofurther vocational/technical education programmes.In countries with no system break between lower secondary and uppersecondary education, and where lower secondary education lasts for more than3 years, only the first 3 years following primary education should be counted aslower secondary education.BCProgrammes designed to prepare students for direct accessto programmes at level 3C.Programmes primarily designed for direct access to thelabour market at the end of this level (sometimes referred toas ‘terminal’ programmes).VocationalEducation which prepares participants for direct entry, withoutfurther training, into specific occupations. Successful completionof such programmes leads to a labour-market relevant vocationalqualification.Modular programmesDestination for which the programmes havebeen designed to prepare students:Programme orientationAn educational qualification is earned in a modular programme bycombining blocks of courses, or modules, into a programme meeting specificcurricular requirements.A Programmes designed to provide direct access to ISCED 5A.GeneralEducation which is not designed explicitly to prepare participantsfor a specific class of occupations or trades or for entry intofurther vocational/technical education programmes.A single module, however, may not have a specific educational or labourmarket destination or a particular programme orientation.B Programmes designed to provide direct access to ISCED 5B.CProgrammes not designed to lead directly to ISCED 5A or5B. Therefore, these programmes lead directly to the labourmarket, ISCED 4 programmes or other ISCED 3 programmes.VocationalEducation which prepares participants for direct entry, withoutfurther training, into specific occupations. Successful completionof such programmes leads to a labour-market relevant vocationalqualification.Types of programmes which can fit into level 4Destination for which the programmes havebeen designed to prepare students:Programme orientationThe first type are short vocational programmes where either the content isnot considered tertiary in many countries or the programmes do not meetthe duration requirement for ISCED 5B – at least two years.These programmes are often designed for students who have completed level 3,although a formal ISCED level 3 qualification may not be required for entry.A Programmes designed to provide direct access to ISCED 5A or 5B.GeneralEducation which is not designed explicitly to prepare participantsfor a specific class of occupations or trades or for entry intofurther vocational/technical education programmes.The second type of programmes are nationally considered as uppersecondary programmes, even though entrants to these programmes will havetypically already completed another upper secondary programme (i.e. secondcycleprogrammes).BProgrammes not designed to lead directly to ISCED 5A or5B. These programmes lead directly to the labour market orother ISCED 4 programmes.VocationalEducation which prepares participants for direct entry, withoutfurther training, into specific occupations. Successful completionof such programmes leads to a labour-market relevant vocationalqualification.Cumulative theoretical duration at tertiaryPosition in the national degree and qualificationsstructureA Duration categories: less than 5 years; 5 years or more. A Categories: First; Second or further.B Duration categories: None. B Categories: None.273
A N N E XDRegionsArab States (20 countries or territories)Respondents to UIS questionnaires:Algeria, Bahrain, Djibouti, Iraq, Kuwait, Lebanon, Libyan Arab Jamahiriya, Mauritania,Morocco, Oman, Palestinian Autonomous Territories, Qatar, Saudi Arabia, Sudan, SyrianArab Republic, United Arab Emirates, Yemen.Respondents to UOE or WEI questionnaires:Egypt, Jordan, Tunisia.Central and Eastern Europe (21 countries or territories)Respondents to UIS questionnaires:Belarus, Montenegro, Republic of Moldova, Serbia, Ukraine.Respondents to UOE or WEI questionnaires:Albania, Bosnia and Herzegovina, Bulgaria, Croatia, Czech Republic, Estonia, Hungary,Latvia, Lithuania, Poland, Romania, Russian Federation, Slovakia, Slovenia, The formerYugoslav Republic of Macedonia, Turkey.Central Asia (9 countries or territories)Respondents to UIS questionnaires:Armenia, Azerbaijan, Georgia, Kazakhstan, Kyrgyzstan, Mongolia, Tajikistan, Turkmenistan,Uzbekistan.East Asia and the Pacific (34 countries or territories)Respondents to UIS questionnaires:Brunei Darussalam, Cambodia, Cook Islands, Democratic People’s Republic of Korea, Fiji,Hong Kong Special Administrative Region of China, Kiribati, Lao People’s DemocraticRepublic, Macao (China), Marshall Islands, Micronesia (Federated States of), Myanmar,Nauru, Niue, Palau, Papua New Guinea, Samoa, Singapore, Solomon Islands, Timor-Leste,Tokelau, Tonga, Tuvalu, Vanuatu, Viet Nam.Respondents to UOE or WEI questionnaires:Australia, China, Indonesia, Japan, Malaysia, New Zealand, Philippines, Republic of Korea,Thailand.274
G l o b a l e d u c a t i o n d i g e s t 2 0 1 0 C o m p a r i n g e d u c a t i o n s t a t i s t i c s a r o u n d t h e w o r l dLatin America and the Caribbean (41 countries or territories)Respondents to UIS questionnaires:Anguilla, Antigua and Barbuda, Aruba, Bahamas, Barbados, Belize, Bermuda, Bolivia, BritishVirgin Islands, Cayman Islands, Colombia, Costa Rica, Cuba, Dominica, Dominican Republic,Ecuador, El Salvador, Grenada, Guatemala, Guyana, Haiti, Honduras, Montserrat, NetherlandsAntilles, Nicaragua, Panama, Saint Kitts and Nevis, Saint Lucia, Saint Vincent and theGrenadines, Suriname, Trinidad and Tobago, Turks and Caicos Islands, Venezuela.Respondents to UOE or WEI questionnaires:Argentina, Brazil, Chile, Jamaica, Mexico, Paraguay, Peru, Uruguay.North America and Western Europe (29 countries or territories)Respondents to UIS questionnaires:Andorra, Gibraltar, Holy See, Monaco, San Marino.Respondents to UOE or WEI questionnaires:Austria, Belgium, Canada, Cyprus, Denmark, Finland, France, Germany, Greece, Iceland, Ireland,Israel, Italy, Liechtenstein, Luxembourg, Malta, Netherlands, Norway, Portugal, Spain, Sweden,Switzerland, United Kingdom of Great Britain and Northern Ireland, United States of America.South and West Asia (9 countries or territories)Respondents to UIS questionnaires:Afghanistan, Bangladesh, Bhutan, Iran (Islamic Republic of), Maldives, Nepal, Pakistan.Respondents to UOE or WEI questionnaires:India, Sri Lanka.Sub-Saharan Africa (45 countries or territories)Respondents to UIS questionnaires:Angola, Benin, Botswana, Burkina Faso, Burundi, Cameroon, Cape Verde, Central AfricanRepublic, Chad, Comoros, Congo, Côte d’Ivoire, Democratic Republic of the Congo, EquatorialGuinea, Eritrea, Ethiopia, Gabon, Gambia, Ghana, Guinea, Guinea-Bissau, Kenya, Lesotho,Liberia, Madagascar, Malawi, Mali, Mauritius, Mozambique, Namibia, Niger, Nigeria, Rwanda,Sao Tome and Principe, Senegal, Seychelles, Sierra Leone, Somalia, South Africa, Swaziland,Togo, Uganda, United Republic of Tanzania, Zambia, Zimbabwe.275
A N N E XEElectronic resourcesData centreThe printed version of the Global Education Digest provides a subset of the internationallycomparable statistics found in the UIS Data Centre, which can be accessed free of charge viathe Institute’s website at http://stats.uis.unesco.org.The Data Centre contains more than 500 education indicators and underlying data. It coversall levels of education from pre-primary to tertiary and includes topics such as access,participation, progression, completion, teachers and finance. For example, users will findstatistical information on:• Enrolment by grade and level of education• Repeaters by grade• Tertiary enrolment by fields of study.The Data Centre also includes a range of tools to facilitate data access and analysis,including:• Country profiles highlighting key education indicators• Tools to build and store statistical tables and graphs• UIS survey instruments, classifications and methodological <strong>document</strong>s.Time seriesThe Data Centre contains indicators and underlying data for 1999 onwards, based on theISCED 1997 classification. In addition, the UIS incorporated a smaller set of indicators in aseparate historical database covering indicators on education participation, progression andresources for the period 1970 to 1999.Data updatesThe Data Centre is updated in January, April and October of each year. This report containsthe April 2010 data release. Data received from countries after this date will be incorporatedin the October release.Documentation and publicationsAll UIS publications and surveys are posted on the UIS website in different languageversions.Alert servicePlease consult the UIS website in order to subscribe to the alert service and receive e-mailnotifications of new reports and data releases.CD-ROMAdditional electronic resources and a detailed set of raw data and indicators are availableon the Global Education Digest CD-ROM. To order a copy, please send your request topublications@uis.unesco.org.276
The 2010 Global Education Digest focuses specifically on gender and education to mark“Beijing +15” – the 15th anniversary of the Fourth World Conference on Women. Thisedition presents a rich set of cross-nationally comparable data compiled by the UIS aswell as information from household surveys and assessments of learning achievementthat capture the scope of gender disparities across the world.The international community pledged to eliminate gender disparities in all levels ofeducation by 2015 as part of the Millennium Development Goals (MDGs). Yet accordingto the UIS, which is responsible for monitoring the international education targets, 63%of countries (out of 157 with available data) are still faced with gender disparities inprimary and secondary education and these imbalances will probably persist in nearlyhalf of countries in 2015.The Digest presents a wide range of education indicators and data for the school yearending in 2008 or the latest available year, as well as data for 2009 for a small number ofcountries. It includes data tables from the World Education Indicators programme, whichare comparable across a group of 62 countries, including members of the Organisationfor Economic Co-operation and Development (OECD). These indicators can helpbenchmark the performance of national education systems.The UNESCO Institute for Statistics (UIS) is the statistical office of the United NationsEducational, Scientific and Cultural Organization (UNESCO) and is the UN depositoryfor comparable statistics in the fields of education, science and technology, culture, andcommunications.UNESCO Institute for StatisticsP.O. Box 6128, Succursale Centre-VilleMontreal, Quebec H3C 3J7CanadaTo access online resources related to the Digest – including statistical tables, time series data andaccompanying metadata – please consult: www.uis.unesco.org/publications/GED2010.To order the interactive database on CD-Rom, please contact: publications@uis.unesco.org.