Watershed Development and Livestock Rearing.pdf - sapplpp
Watershed Development and Livestock Rearing.pdf - sapplpp
Watershed Development and Livestock Rearing.pdf - sapplpp

You also want an ePaper? Increase the reach of your titles
YUMPU automatically turns print PDFs into web optimized ePapers that Google loves.
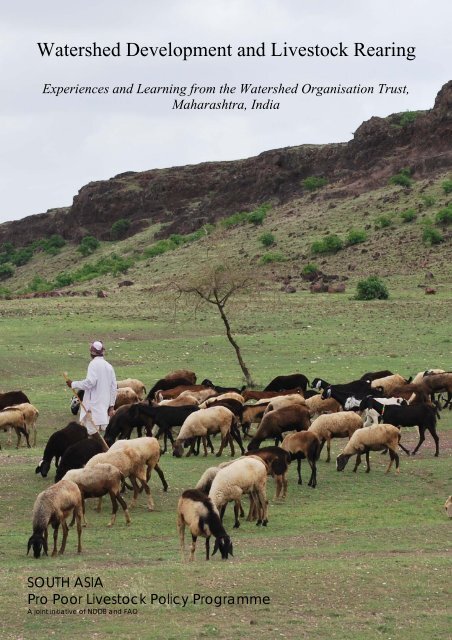
<strong>Watershed</strong> <strong>Development</strong> <strong>and</strong> <strong>Livestock</strong> <strong>Rearing</strong>Experiences <strong>and</strong> Learning from the <strong>Watershed</strong> Organisation Trust,Maharashtra, IndiaSOUTH ASIAPro Poor <strong>Livestock</strong> Policy ProgrammeA joint initiative of NDDB <strong>and</strong> FAO
This report has been developed by K Bhavana Rao <strong>and</strong> Mihir Mathur for SA PPLPP, <strong>and</strong> documents theexperiences of the <strong>Watershed</strong> Organisation Trust in implementing the Indo German <strong>Watershed</strong> <strong>Development</strong>Programme (IGWDP) in Maharashtra, India. The documentation is based on project completion reports, extensivefield visits <strong>and</strong> discussions with field staff <strong>and</strong> livestock rearing communities.Photo credits: K Bhavana Rao <strong>and</strong> <strong>Watershed</strong> Organisation Trust (WOTR)
AcknowledgementsWhereas there are many studies documenting <strong>and</strong> assessing the impact of watershed development onagriculture, natural resources <strong>and</strong> the income of participating communities, this study enabled us todocument the results of watershed development on the livelihoods of livestock rearers. We are awarethat this is a preliminary assessment <strong>and</strong> we are happy that <strong>Watershed</strong> Organisation Trust (WOTR)will take this learning forward.We are indebted to households in the four sample watersheds of Darewadi, Mhasw<strong>and</strong>i, M<strong>and</strong>wa <strong>and</strong>Wanjulshet, for patiently responding to our numerous questions. Without their active involvement <strong>and</strong>cooperation, this study would not have been possible.Our special thanks to the South Asia Pro Poor <strong>Livestock</strong> Policy Programme (SA PPLPP) for giving usthis opportunity <strong>and</strong>, in particular, to Ms Tinni Sawhney <strong>and</strong> Ms Sheila Koyyana for their inputs <strong>and</strong>critical review of each draft of this report. We would also like to thank Ms Lucy Maarse <strong>and</strong> Dr.Mamta Dhawan, who were earlier with SA PPLPP, <strong>and</strong> with whom this study was first identified ashaving potential for a more detailed assessment.Before thanking all our colleagues at WOTR for their support, we wish to thank our dearest colleagueMr. Ashok Sangle, who is no more with us. If it were not for his support <strong>and</strong> ideas, we would havenever reached this far. We would also like to thank Ms Chhaya Nikrad, Mr. Prakash Keskar, Mr.Prashant Roham, Ms Sushama Bhingardave, Mr. Rajith Jadav, Mr. Rajesh Rajak <strong>and</strong> ECO-Studentsfor their cooperation in making available relevant documents, organising meetings <strong>and</strong> surveys, <strong>and</strong>providing inputs on technical aspects <strong>and</strong> other advice.Lastly, we would like to record our special thanks to Dr. Marcella D’souza <strong>and</strong> Mr. Crispino Lobo fortheir overall guidance <strong>and</strong> their patience in responding to our many questions that would arise fromdata analysis <strong>and</strong> field visits!In addition, a special thanks to Mr. Kamal Kishore, Dr. N. K<strong>and</strong>aswamy <strong>and</strong> Dr. RamkumarBendapudi for critically reviewing the findings of this document <strong>and</strong> for accompanying us on some ofthe field visits.We also thank Mr. Iqbal David <strong>and</strong> his colleagues at CRTDP, a partner NGO of WOTR, for organisingthe field visits <strong>and</strong> focus group discussions (FGD) in the M<strong>and</strong>wa watershed.K. Bhavana Rao <strong>and</strong> Mihir MathurFebruary 2012
ContentsExecutive Summary Page 1Chapter 1: Introduction Page 4Chapter 2: Background Page 5Chapter 3: Key Elements of the Good Practice Page 8Chapter 4: The Problem <strong>and</strong> Alternative Strategies Page 12Chapter 5: Outcomes Page 14Chapter 6: Key Lessons <strong>and</strong> Elements of Success Page 33Abbreviations Page 38References Page 39Annexure 1a Page 40Annexure 1b Page 43Annexure 1c Page 44Annexure 1d Page 46Annexure 2 Page 47Annexure 3 Page 53Annexure 4 Page 55
Executive SummaryThe <strong>Watershed</strong> Organisation Trust (WOTR) is a pioneer in the conceptualization <strong>and</strong> implementation ofwatershed development programmes (WDPs) in the country, <strong>and</strong> notably in the design <strong>and</strong>implementation of the Indo-German <strong>Watershed</strong> <strong>Development</strong> Programme (IGWDP). IGWDPcommenced in 1992 in Maharashtra following a bilateral agreement between the governments of India<strong>and</strong> Germany. WOTR played the role of a resource support organisation <strong>and</strong>, in partnership with 78grass-root Non-Government Organisations (NGOs), implemented the programme in 146 villagescovering 137,000 ha. The programme is still on-going with two new resource support organisations, inaddition to WOTR.IGWDP had a robust institutional, technical <strong>and</strong> social framework, <strong>and</strong> focused on the overalldevelopment of the village rather than on just water recharge <strong>and</strong> increased agricultural productivity. Anumber of innovative strategies were implemented such as the ridge-to-valley approach; facilitatingcollaboration <strong>and</strong> convergence between key government departments through a state governmentresolution that enabled the treatment of forest l<strong>and</strong> in the upper reaches of designated watershed areas;the design <strong>and</strong> implementation of a distinct capacity building phase to enable community participation<strong>and</strong> resolution of inter-village <strong>and</strong> intra-village conflicts; clear processes to ensure the participation of allhouseholds (HHs) in a village; voluntary labour contribution (shramdan) <strong>and</strong> the creation of a fund tofacilitate post-project maintenance of watershed structures.The treatment of l<strong>and</strong> in the designated watersheds, which often comprised common l<strong>and</strong> <strong>and</strong> met thegrazing needs of livestock rearing communities, was implemented through two non-negotiable strategies– (i) a complete ban on grazing <strong>and</strong> (ii) a ban on tree-felling in these areas. Whereas these interventionshad benefits in the long-run, they often led to adverse short-term impact on those who depended on thesel<strong>and</strong>s for their livelihood, primarily livestock rearers.In order to underst<strong>and</strong> the changes in livestock rearing practices <strong>and</strong> the impact of watersheddevelopment on livestock rearing, a study was conducted in four sample watersheds, where watershedtreatment was completed over a decade ago. The study included a comparative assessment of baselinedata for households that witnessed no change in l<strong>and</strong> category, with the current status of livestock <strong>and</strong>incomes earned. The selected watersheds were located in different agro-ecological zones of the State, <strong>and</strong>were selected based on the following criteria:• Selected watersheds needed to have baseline data, feasibility study reports (FSR) projectcompletion reports <strong>and</strong> other information from the commencement of the project.• <strong>Watershed</strong> interventions should have been completed at least 10 years ago.• The selected watersheds should have similar characteristics such as livestock preference <strong>and</strong>population, l<strong>and</strong>-holding size, village size, area under common property resources (CPRs), tomost of the other watersheds in the same agro-ecological zone.• More than 70 % of the HHs should be dependent on livestock in the pre-watershed period <strong>and</strong>own all types of livestock (viz., cows, buffaloes, bullocks, goats, sheep <strong>and</strong> poultry).Of the several watersheds completed in Phase 1 of IGWDP, four watersheds (Darewadi, M<strong>and</strong>wa,Mhusw<strong>and</strong>i, <strong>and</strong> Wanjulshet) met the above criteria <strong>and</strong> were selected for the study.Some of the key findings of the study were that changes in livestock preference <strong>and</strong> production systemsprimarily depended on the increased availability of water for agriculture <strong>and</strong> livestock rearing; improvedaccess to agriculture markets <strong>and</strong> dairy cooperatives; <strong>and</strong> price fluctuations of agricultural produce. Ageneral reduction in livestock numbers per HH for all livestock species was observed but there was anoverall increase in livestock population in the watershed. This was mainly due to an increase in thenumber of HHs in the watershed village as many joint families split into nuclear families over the 15-yearperiod. This change from joint to nuclear families also resulted in reduction in person power to managelivestock as well as l<strong>and</strong>-holding per household. The increase in agriculture work-load as a result of morel<strong>and</strong> being brought under cultivation <strong>and</strong> improvements in income, led HHs to invest in better education,which increased migration of youth to cities for better jobs. The reduction in additional ‘work-h<strong>and</strong>s’ atthe HH level led to a reduction in livestock numbers in each HH.Page 1 of 56
As informed by communities, the main reason for rearing indigenous cattle pre-watershed developmentwas to earn some income from the sale of farm animals rather than the sale of milk. The lack of access tograzing resources, particularly forests (following the Government Order issued after the drought in 1972),followed by the ban on grazing in treated areas under IGWDP were stated to be the key reasons forreduction in the rearing of indigenous cattle. Over time, this led to a severe shortage of bullocks forploughing agricultural l<strong>and</strong>s <strong>and</strong> a significant increase in the price of a pair of bullocks, making this anunaffordable <strong>and</strong> unmanageable asset for small <strong>and</strong> marginal farmers. Currently, even though adequatefodder is available from the regenerated commons, farmers have not increased the number of animals,especially small ruminants <strong>and</strong> indigenous cattle. The priority has now shifted to agriculture <strong>and</strong> theperson power required for grazing animals at the HH level is low.In the context of securing crop <strong>and</strong> livestock-based livelihoods, the technical principle of treating awatershed from ridge to valley, thereby undertaking required soil <strong>and</strong> moisture conservation works on alltypes of l<strong>and</strong> <strong>and</strong> not only on agricultural l<strong>and</strong> or l<strong>and</strong> below the ridge proved highly beneficial. Evenafter 15 years <strong>and</strong> three major droughts during this period, the watersheds are still able to providecontinuous environmental services <strong>and</strong> support the water intensive crop-livestock production systemsdespite this being a drought-prone zone.External drivers, improved access to markets <strong>and</strong> increase in water availability for extended parts of theyear have led to farmers adopting water intensive crop-livestock production systems. The study shows,that until now, on account of the impact of IGWDP, the ecosystem is still able to provide adequate waterresources supporting the shift to intensive production systems. The key question, however, is for howlong can the eco-system continue to sustain these water intensive livelihood strategies? This questioncentre-stages the need for watershed development interventions, to necessarily include norms for waterbudgeting <strong>and</strong> limiting the extraction of water.Case studies of the four sample watersheds detail the coping mechanisms that communities adopted inlieu of the ban on grazing in treated areas. Whereas Mhusw<strong>and</strong>i adopted an innovative CPR leasingsystem, in collaboration with the Forest Protection Committee, M<strong>and</strong>wa continued to follow a traditionalgrazing system, employing a grazer (charaiya), who took the village livestock for grazing beyond thetreated areas.In spite of the considerable focus on conflict resolution, shepherd communities in the watershed areaswere in the short term adversely affected by the ban on grazing on common l<strong>and</strong>s. Shepherds reportedhaving to reduce herd size or temporarily shift their flocks to neighbouring areas. In Darewadi, this wasresolved by treating the area in a phased manner <strong>and</strong> by enforcing the grazing ban only in areas that weretreated. This enabled the achievement of both objectives of CPR regeneration as also meeting the fodderneeds of the shepherd community. However, it was also difficult for the shepherd community to negotiatebetter terms on account of being smaller in number. In the Mhusw<strong>and</strong>i <strong>and</strong> Wanjulshet watersheds,communities with small ruminants willingly reduced their flock size <strong>and</strong> adhered to the grazing ban, inthe expectation of receiving benefits of water, which was perceived as a much greater need. In M<strong>and</strong>wa,due to the availability of CPRs in adjoining areas of the watershed, no compromise was made by thecommunities <strong>and</strong>, in fact, they were not only able to treat the whole area but were also successful inkeeping the high potential zones enclosed.A key finding, therefore, is that the livelihoods of livestock-dependent communities, particularly thosedependent on common l<strong>and</strong>s, can be secured; while simultaneously regenerating <strong>and</strong> reviving CPRsunder WDPs through the development of alternative sites, a phased treatment plan, <strong>and</strong> the protection<strong>and</strong> management of high potential recharge zones.The study brought out that in the sample watersheds, there was a clear shift to rearing cross-bred cowssince regular income from milk is perceived as economic security. This was more prominent inwatersheds where external factors such as assured water <strong>and</strong> fodder availability, market access <strong>and</strong> roads,<strong>and</strong> the presence of dairy cooperatives were in place. However, the 15-year time-frame demonstrates atrend of a sudden increase in cross-bred cows immediately after the WDP, following which there is dropin animal numbers <strong>and</strong>, thereafter, stabilization at a certain level. The sudden drop was primarily onaccount of a lack of expertise in managing cross-bred cows, including feeding capacity, heat stressPage 2 of 56
problems <strong>and</strong> high disease incidence. This led to death/sale of the animals, reduction in milk yields <strong>and</strong>fertility problems. Stabilization of numbers resulted from those who were able to successfully raise <strong>and</strong>build their cross-bred stock, maintaining numbers. The only exception to this trend is the Mhasw<strong>and</strong>iwatershed, where even farmers’ falling in the 0–1 ha category are successfully rearing cross-bred cowson account of the assured availability of fodder through the CPR leasing system. Another trend noticed insome villages, was a shift from the rearing of cross-bred cows to the rearing of buffaloes. This was onaccount of the higher price of buffalo milk, a better adaptation to local weather conditions, <strong>and</strong> thecomparatively lower resource requirements as compared to cross-bred cows.Whereas the shift to cross-bred cows has increased income through milk production, it has led to adecline in the availability of bullocks <strong>and</strong> farmyard manure. A pair of bullocks in these areas now costsbetween Rs 50,000 <strong>and</strong> Rs 70,000, as compared to the price of Rs 10–15,000 in 2000.Goat farming in the M<strong>and</strong>wa watershed has emerged as a key support system to input intensive cashcropping whereas in Mhusw<strong>and</strong>i it is cross-bred cows. <strong>Livestock</strong> rearing in most cases has moved frombeing the primary source of income to a secondary, yet key source of income.The interest in rearing backyard poultry (BYP) is still found among tribal HHs but not with othercommunities post watershed development. Increase in agriculture production 1 was the main reason statedby communities for reducing the rearing of birds. However, many women <strong>and</strong> HHs with small l<strong>and</strong>holdingswhose homes are located at a distance from agricultural fields, expressed a keen interest to rearlocal birds. There are, currently, no programmes/schemes that support basic requirements such as theprovision of night shelters <strong>and</strong> preventive health care. The theft of poultry is also a major problem.Hence, there is a strong need to lobby for a separate programme for BYP because the dem<strong>and</strong> for bothpoultry meat <strong>and</strong> eggs has increased <strong>and</strong> traditional marketing systems are already in place. The price ofpoultry meat, eggs <strong>and</strong> live birds (Rs 450 per kg; Rs 4 to Rs 8 per egg, <strong>and</strong> Rs 250 to Rs 500,respectively) is much higher than meat <strong>and</strong> eggs from commercial <strong>and</strong> improved poultry (Rs 120 per kg;Rs 1.50 to Rs 3 per egg, <strong>and</strong> there is no dem<strong>and</strong> for live birds). Further, the absence of sustainedprogrammes on promoting BYP is proving counter-productive to the nutritional <strong>and</strong> financial security ofpoor HHs. There is a lack of underst<strong>and</strong>ing of the value of BYP <strong>and</strong> its significant contribution to theincome <strong>and</strong> food security of resource poor HHs, being a zero-to-low input production system.With regard to goats, it is difficult to conclude that there is a reduction in the number of animals per HHeven though data collection at three points of time shows a decreasing trend except in the case of theM<strong>and</strong>wa watershed. This is because, during the study period, high fluctuations were observed in goatpopulations at the HH level, as per needs/risk that the HH faced as also market dem<strong>and</strong> (increasingduring Bakr Id <strong>and</strong> tribal festivals in March each year).In the case of sheep, the herd size has reduced, primarily on account of the shift from joint to nuclearfamilies, <strong>and</strong> the adoption of settled agriculture.During interviews with the community in the four watersheds, it was clearly evident that the intake ofanimal products by HHs has decreased even though milk production has increased. This is because themilk of cross-bred cows is not preferred <strong>and</strong> is produced primarily for sale. However, goat milk is usedfor home consumption if indigenous cows are not kept.As demonstrated by this study, watershed development has immense scope to secure livestock-basedlivelihoods <strong>and</strong>, at the same time, build the natural resource base. This is possible, provided key elementssuch as securing availability <strong>and</strong> access to CPRs; investments in CPR regeneration with ridge (largelycomprising forest l<strong>and</strong>s)-to-valley approach; integration of grazing-based livestock systems <strong>and</strong> waterbudgeting in watershed planning; protection of ‘high potential recharge zones’; <strong>and</strong> utilizing traditionallivestock systems to manage watersheds post-project are in place.1 Scavenging poultry are viewed as pests as they tend to eat seeds <strong>and</strong> seedlings in the fields.Page 3 of 56
1. IntroductionAreas that receive an annual rainfall of 750–800 mm <strong>and</strong> have less than 30 per cent irrigated l<strong>and</strong> areclassified as rain-fed regions, according to the Central Research Institute for Dry-l<strong>and</strong> Agriculture(CRIDA). Rain-fed areas are ecologically fragile, with degraded soils <strong>and</strong> acute water scarcity that oftenmakes the l<strong>and</strong> uncultivable. Shallow soil depth with severe soil erosion adversely affects soilproductivity, limiting cultivation to a single rain-dependent crop each year. These regions are droughtprone <strong>and</strong>, on an average, face drought once every three years. India’s rain-fed regions are home to 43 percent of its population <strong>and</strong> 60 per cent of its livestock. Nine states (Rajasthan, Madhya Pradesh,Maharashtra, Gujarat, Chhattisgarh, Jharkh<strong>and</strong>, Andhra Pradesh, Karnataka <strong>and</strong> Tamil Nadu) account forover 80% of India’s rain-fed areas. 2Agriculture in rain-fed areas is characterized by low productivity, degraded natural resources <strong>and</strong>widespread poverty. The rural poor in these regions are heavily dependent on agriculture <strong>and</strong> naturalresources for their livelihoods (Kerr, 2002). The development <strong>and</strong> management of a watershed 3 isperceived as a viable approach for reviving degraded l<strong>and</strong>s <strong>and</strong> improving livelihoods dependent on thesel<strong>and</strong>s (Bendapudi et al, 2007).Whereas the acceptability <strong>and</strong> recognition of watershed development as a viable development approachfor rain-fed areas is relatively recent in India, work on soil <strong>and</strong> water conservation began in the early1960s by the Ministry of Agriculture under a centrally sponsored scheme—Soil Conservation Work in theCatchments of River Valley Projects (RVP)—with the objective of stabilizing catchments of reservoirs<strong>and</strong> controlling siltation. Following the implementation of another scheme (Integrated <strong>Watershed</strong>Management in the Catchments of Flood Prone Rivers, FPR, 1980–81) <strong>and</strong> emerging lessons from otherwatershed development projects, supported by both government <strong>and</strong> bilateral programmes, the concept ofintegrated watershed development was institutionalized as the National <strong>Watershed</strong> <strong>Development</strong>Programme for Rain-fed Areas (NWDPRA) in 1990. It is operational in 99 districts in 16 states of India(Source: From Hariyali to Neeranchal, Report of the Technical Committee on <strong>Watershed</strong> Programmes inIndia, Department of L<strong>and</strong> Resources, Ministry of Rural <strong>Development</strong>, Government of India (January,2006)).In India, Maharashtra has the largest area under rain-fed conditions, accounting for 14.49 million ha. Torevive these highly degraded l<strong>and</strong>s <strong>and</strong> improve the livelihoods of the rural poor, WOTR 4 took theinitiative to design <strong>and</strong> implement a WDP under the IGWDP. Among the many NGOs working onwatershed development in India, WOTR is a pioneer <strong>and</strong> played a key role in launching <strong>and</strong> designingthe state-wide IGWDP (Kerr 2002).This document describes the key strategies designed <strong>and</strong> implemented by WOTR that helped in makinglivestock-based livelihoods more sustainable <strong>and</strong> profitable without compromising the already fragileenvironment. It details the changes in livestock rearing practices by livestock rearers <strong>and</strong> farmingcommunities in four sample watersheds <strong>and</strong> their adaptation to <strong>and</strong> sustainable use of the improvednatural resource base as a result of watershed development interventions. Key lessons <strong>and</strong> learning forpossible replication <strong>and</strong> up-scaling are also detailed.2Vijay Shankar P.S., http://www.india-seminar.com/2006/564/564_p_s_vijay_shankar.htm3 A watershed is defined as a geo-hydrological unit, comprising all l<strong>and</strong> <strong>and</strong> water within the confines of a drainagedivide. <strong>Watershed</strong> management is, therefore, the integrated use, regulation <strong>and</strong> treatment of water <strong>and</strong> l<strong>and</strong>resources of a watershed to accomplish stated objectives (Soil Conservation Society of America, 1982).4 WOTR was set up for the implementation of IGWDP in Ahmednagar district, Maharashtra.Page 4 of 56
2. Background2.1 The Project LocationMaharashtra is the third largest state ofIndia located between 16 <strong>and</strong> 22 N latitudes<strong>and</strong> 72 <strong>and</strong> 80 E longitudes. It encompassesan area of 308,000 sq km <strong>and</strong> is located inthe north centre of peninsular India. Itsdominant physical trait is its plateaucharacter <strong>and</strong> only 17% of the state covercomprises forests (See Figure 1). The statehas a diverse agro-climate <strong>and</strong> receivesrainfall ranging from 500 mm in the dryareas of the rain-shadow belt to over 4,000mm in the Western Ghats. A major portionof the state is semi-arid but lies in the rainshadow belt of the Western Ghats. Based onits geographical features, Maharashtra isdivided into three natural regions - theKonkan, the Western Ghats <strong>and</strong> the Deccanplateau. The soils of Maharashtra areshallow <strong>and</strong> poor, with acute watershortage. Only 11% of the net sown area inthe state is irrigated.2.2 Study MethodologyThe IGWDP was implemented by WOTR in 146 villages, covering about 137,000 ha of l<strong>and</strong> with 78grass-roots level NGOs (WOTR, 2002). To illustrate the impact of watershed development on livestockbasedlivelihoods in the IGWDP, the following criteria were used for selecting watersheds for the currentstudy:• The selected watersheds were to be located in different agro-ecological zones of the State.• The selected watersheds needed to have baseline data, FSRs, project completion reports <strong>and</strong>other information from the commencement of the project.• The watershed project should have been completed at least 10 years ago.• The selected watersheds shouldhave similar characteristics suchas livestock preference <strong>and</strong>population, l<strong>and</strong> holding size,village size, area under CPRs, tomost of the other watersheds inthe same agro-ecological zone.• More than 70% of the HHsshould have been dependent onlivestock in the pre- watershedperiod <strong>and</strong> owned all types oflivestock (viz., cows, buffaloes,bullocks, goats, sheep <strong>and</strong>poultry).Of the several watersheds completed inPhase 1 of IGWDP, four watersheds metthe above criteria <strong>and</strong> were selected forthe study. These were Darewadi,M<strong>and</strong>wa, Mhasw<strong>and</strong>i, <strong>and</strong> Wanjulshet watersheds (See Figure 2).Page 5 of 56
The qualitative <strong>and</strong> quantitative data are from baseline reports, internal project monitoring <strong>and</strong> projectcompletion reports, post-project field surveys undertaken in 2011, as also FGDs with Village<strong>Development</strong> Committees (VDCs)/ Village <strong>Watershed</strong> Committees (VWCs)/ Gram Panchayats (GPs)/Self Help Groups (SHGs)/ milk association members <strong>and</strong> interviews with large <strong>and</strong> small farmers <strong>and</strong>l<strong>and</strong>less villagers on livestock composition <strong>and</strong> production systems in the pre- <strong>and</strong> post-watershedperiods. Since the watershed village was taken as a whole, a first step was the categorization of HHs inthe village into five groups, based on l<strong>and</strong> ownership. 5 A fresh survey was then conducted to map thechange in average livestock holding per l<strong>and</strong>holding category, post-watershed development. Tounderst<strong>and</strong> the changes in livelihood economics <strong>and</strong> production systems from crops <strong>and</strong> livestock, an indepthinterview was conducted with two livestock keepers/farmers per category. This was then crosscheckedwith 10 r<strong>and</strong>omly selected HHs falling in the same category <strong>and</strong> practising similar croplivestockfarming systems, to ensure consistency of data <strong>and</strong> information.Indicators Developed for the StudyThe hypothesis of the study is that the poor <strong>and</strong> the l<strong>and</strong>less, dependent on livestock as a primary sourceof income, which in turn is dependent on natural resources, benefit from WDPs. To verify thishypothesis, the following indicators were used.i. Increase in income levels even though the number of animals kept by livestock rearers per HH hasdecreased in the post-watershed period.ii. Ability of communities to manage the natural resource base in a sustainable way <strong>and</strong> maintain anoptimal flock/ herd size, thereby securing livestock-based livelihoods.iii.iv.Access to <strong>and</strong> involvement in the use <strong>and</strong> management of CPRs by the poor.Livelihood stability/ security of the poor as compared to larger farmers with more l<strong>and</strong> <strong>and</strong> largerlivestock holding.2.3 Limitations of the StudyThere are many differences in the way communities choose to maintain <strong>and</strong> depend on livestock in thepost-watershed phase, <strong>and</strong> often changes in livestock rearing practices are triggered by external factors.Therefore, not all changes described here are the result of watershed development interventions. Anotherproblem faced was that many parameters required for the analysis were not available, particularly thoserelated to livestock, even though adequate baseline data was available for all four watersheds under thestudy. Therefore, the recall method was used to obtain the nearest pre-watershed picture <strong>and</strong> differentapproaches were identified to cross-check this. This approach was time-consuming <strong>and</strong> only qualitativeinformation <strong>and</strong> some quantitative data were obtained accurately.Along with this, as work in the selected watersheds was completed almost 15 years back, a large numberof HHs had moved from joint to nuclear families with considerable changes in the l<strong>and</strong>-holding pattern.Considering that the aim of the study was to highlight the actual change in livestock-basedlivelihoods, pre- <strong>and</strong> post-watershed, only those HHs that did not change their l<strong>and</strong>holdingcategory were taken into account because there was too much variation to calculate economicbenefits to study indicator 1 (Table 1). However, all general trends <strong>and</strong> observations have beenrecorded <strong>and</strong> shared in the study.Table 1: L<strong>and</strong>holding Categories<strong>Watershed</strong>sWanjulshetChange in l<strong>and</strong>holdingcategory (number of HHs)No change in l<strong>and</strong>holdingcategory (number of HHs)L<strong>and</strong>holding category0–1 ha 1–2 ha 2–4 ha 4–8 ha20(38.4%)52(45.2%)23(44.2%)39(33.9%)7(13.4%)18(15.6%)2(3.8%)6(5.2%)Total HHs521155 L<strong>and</strong>holding categories are l<strong>and</strong>less, 0–1 ha, 1–2 ha, 2–4 ha, 4–8 ha <strong>and</strong> above 8 ha.Page 6 of 56
Table 1: L<strong>and</strong>holding Categories<strong>Watershed</strong>sDarewadiChange in l<strong>and</strong>holdingcategory (number of HHs)No change in l<strong>and</strong>holdingcategory (number of HHs)Mhasw<strong>and</strong>iChange in l<strong>and</strong>holdingcategory (number of HHs)No change in l<strong>and</strong>holdingcategory (number of HHs)M<strong>and</strong>waChange in l<strong>and</strong>holdingcategory (number of HHs)No change in l<strong>and</strong>holdingcategory (number of HHs)L<strong>and</strong>holding category0–1 ha 1–2 ha 2–4 ha 4–8 ha15(17.8%)13(12.3%)52(63.4%)79(56.4%)24(41%)10(38%)32(30%)9(8.5%)22(26.8%)43(30.7%)27(46%)10(38%)30(35.7%)18(17.1%)6(7.3%)15(10.7%)5(8%)2(8%)7(8.3%)5(4.7%)2(2.4%)3(2%)3(5%)3(12%)Total HHs8445821405925Note: Based on data, there is a clear trend indicating a change in l<strong>and</strong>holding size from the existingcategory to the next lower category as l<strong>and</strong>holding gets divided among siblings. It was necessary to studythe changes in l<strong>and</strong>holding size over time because this directly influences the type of livestock maintainedby the HH. Those HHs whose l<strong>and</strong>holding size did not change comprise the sample HHs for the presentstudy. Specifically, the sample size for each study watershed is: Wanjulshet 115 HHs; Darewadi 45 HHs;Mhasw<strong>and</strong>i 145 HHs <strong>and</strong> M<strong>and</strong>wa 25 HHs.Page 7 of 56
3. Key Elements of the Good Practice3.1 IGWDP <strong>and</strong> its OriginMany of the concepts underlying IGWDP weredeveloped in the late 1980s at the Social Centrefounded in 1968 by a Jesuit priest, FatherHermann Bacher, in Ahmednagar, Maharashtra.Father Bacher was involved in developmentwork in India; he saw an opportunity <strong>and</strong>conceived a large-scale community-drivenprogramme for poverty reduction, centred onregenerating the natural resource base, using theprinciples of watershed development.The Social Centre first began its work onwatershed development in 1988 in a villagecalled Pimpalgaon Wagha. As preparations forthe first phase of the IGWDP were initiated atthe same time, the successful rehabilitation ofthis watershed generated many lessons whichwere incorporated into the IGWDP guidelines.3.2 The Institutional Set-upIGWDP was launched in 1992 in Maharashtra,following a bilateral agreement between thegovernments of India <strong>and</strong> Germany.The programme was an NGO-GO multistakeholderprogramme with severalcollaborators at the international, national, state,district <strong>and</strong> local levels. At the internationallevel, the German Ministry for EconomicCooperation (BMZ), the German Bank for<strong>Development</strong> (KfW) <strong>and</strong> the German Agencyfor Technical Cooperation (GTZ) were financialKey Lessons, Incorporated in IGWDP Guidelines,from the Rehabilitation of Pimpalgaon Wagha<strong>Watershed</strong>• Social mobilization in the village <strong>and</strong> support froman external agency in setting up a VWC, which thenbecame the implementing agency for the project• Building confidence <strong>and</strong> ownership among villagersthrough their participation in the design <strong>and</strong>implementation of watershed improvements• Inflow of external funds, especially in the form ofwages, to stimulate the involvement of those whoselivelihoods depend on common pool resources• Links with government departments from the outset,to provide technical guidance <strong>and</strong> support,particularly with respect to forest department l<strong>and</strong>where many common pool resources (for example,fodder <strong>and</strong> trees) are located• Training to communities at agricultural universities;credit from banks for both on-farm <strong>and</strong> off-farmlivelihood activities• Limits on the period of involvement of externalsupport agencies such as the Social Centre• Strategy to allow each partner (VWCs, governmentdepartments, agricultural universities) autonomy intheir sphere of competence while ensuring jointresponsibility for successful project management• Strategy to manage social tensions, which allowedthe legitimate interests of dominant groups to be metonly if the interests of weaker groups were also met.Source: (Farrington <strong>and</strong> Lobo 1997)partners of IGWDP. Another unique feature was the creation of a position of Programme Coordinator,who was responsible for overall coordination of the programme. The institutional base for the IGWDPProgramme Coordinator was in WOTR.The IGWDP had two main phases—the Capacity Building Phase (CBP) <strong>and</strong> the Full ImplementationPhase (FIP). At the national level, the FIP was funded by KfW through the National Bank for Agriculture<strong>and</strong> Rural <strong>Development</strong> (NABARD), <strong>and</strong> the CBP was funded by GTZ through WOTR. At the locallevel, the key stakeholder was the gram sabha, which nominated the VWC, which in turn worked incollaboration with the Forest Protection Committee wherever forest l<strong>and</strong> treatment was required.WOTR was responsible for the CBP because it was both a coordinating <strong>and</strong> a technical serviceorganisation, <strong>and</strong> NABARD was responsible for the FIP. Together with capacity building on varioustechnical <strong>and</strong> social mobilization skills, WOTR also monitored the progress of physical work in thewatersheds.Page 8 of 56
3.3 Implementation StrategyThe IGWDP had a robust institutional, technical <strong>and</strong> social framework, <strong>and</strong> focused on the overalldevelopment of the village rather than on just water recharge <strong>and</strong> increased agricultural productivity. Thissection highlights a few key implementation strategies that have had an impact on the livelihoods ofcommunities dependent on livestock rearing during <strong>and</strong> after the completion of the programme.i. An integrated multi-stakeholder approachA unique feature of the IGWDP, conceptualized by WOTR, was the ‘Ridge-to-Valley’ 6 approach. WOTRlobbied extensively with relevant line departments of the Government of Maharashtra regarding thebenefits of treating a complete watershed. It focused on the convergence of three critical linedepartments—Agriculture, Soil <strong>and</strong> Water Conservation <strong>and</strong> Forests—which made IGWDP distinct fromother programmes under implementation at that time. Ministers overseeing these departmentssuccessfully promoted a Cabinet Resolution in 1992 in support of the programme, <strong>and</strong> a specialgovernment resolution (GR) No. IGP-1091/ 43015/CR-36/JAL-7 along with other supporting GRs wereissued (Annexure 1). This GR was issued by the Department of Water Conservation with the concurrenceof the agriculture <strong>and</strong> the forest departments (FDs). It was an order that laid the foundation for facilitatingconvergence between different stakeholders. 7The GR laid the basis for all watershed development work in Maharashtra because it provided therequired political <strong>and</strong> administrative approval to treat government-owned l<strong>and</strong>s, that is, revenue l<strong>and</strong>s aswell as forest l<strong>and</strong>s, even though the l<strong>and</strong>s were under the jurisdiction of different governmentdepartments. In addition, the GR set up a Project Sanctioning Committee at the State level, with6 The ‘Ridge-to-Valley’ approach is a terminology generally used in watershed projects for the development of rainfedareas by providing different treatments starting from the ‘ridge’ point to the ‘valley’ of a selected watershedarea. The treatment, to be given at various points in the selected watershed area, varies, depending upon the l<strong>and</strong>class <strong>and</strong> its capability <strong>and</strong> is decided as part of a holistic <strong>and</strong> comprehensive approach for development of theentire watershed as a unit. This approach is adopted because sporadic <strong>and</strong> scattered treatments, at different pointswithout proper integration <strong>and</strong> coordination may not yield the desired results (Source: www.nabard.org/databank).7 The departments were secondary <strong>and</strong> not primary stakeholders; therefore, no funds were routed through them.They contributed to the watershed projects by way of their on-going schemes. In the case of the FD, whereas theyput in their own funds, the project also funded them to undertake work on forest l<strong>and</strong>s where required. This isbecause each project has a time period of 4–5 years whereas the working plans of the FD are not tailored to thistime-frame. And since IGWDP followed a Ridge-to-Valley approach, it was necessary to complete treatment in theupper reaches first, which primarily comprised forest l<strong>and</strong>.Page 9 of 56
secretaries of the departments of Agriculture, Water Conservation <strong>and</strong> Forests, created space for NGOs<strong>and</strong> made relevant data available to NGOs <strong>and</strong> village-level institutions. The above measures made itpossible for WOTR to implement IGWDP in an integrated <strong>and</strong> comprehensive way by taking up soil <strong>and</strong>water conservation treatment of non-arable l<strong>and</strong>, arable l<strong>and</strong>s <strong>and</strong> drainage line treatment within themicro watershed.ii. Protection of ‘high potential recharge zones’ in the watershedWith the objective of facilitating regeneration of tree <strong>and</strong> grass cover in the watershed, two nonnegotiablestrategies were developed <strong>and</strong> implemented by IGWDP. These were (a) a ban on tree felling<strong>and</strong> (b) a ban on free grazing of livestock in treated areas.The ban on grazing was restricted to high potential recharge zones, 8 where l<strong>and</strong> treatment activities weretaken up first. The other areas were left open for grazing. Treated areas were enclosed <strong>and</strong> protected for afive-year period after which access was opened. The ban on tree felling, on the other h<strong>and</strong>, was appliedthroughout the watershed, but fuel-wood collection for domestic use was permitted.iii. Well-designed pedagogy can make communities envision their future <strong>and</strong> contribute to improvedconflict resolutionTo achieve sustainable benefits for the community as a whole, there was a strong need for activeparticipation by communities as well as their commitment to abide by certain rules that were nonnegotiable.To bring this about, WOTR developed a unique training <strong>and</strong> capacity building curriculum,which was implemented in the CBP. The CBP not only contributed to the management of such a largeproject but also enabled communities to visualize <strong>and</strong> envision the future <strong>and</strong> resolve conflicts, keepingin mind the interests of all stakeholders. It was designed in such a way that it systematically built up theinstitutional, organizational <strong>and</strong> operational capacities of NGOs as well as members of the VWCs <strong>and</strong>other CBOs involved in the programme. In addition to specific approaches to facilitate communityparticipation, particularly of marginalized groups within the village (including women), the CBP includeda component of practical treatment of a micro-watershed, to build community knowledge on watershedtechniques. The participatory methodologies <strong>and</strong> technical training were discussed/ disseminated in thegram sabha, using audiovisual aids, exposure visits <strong>and</strong> awareness tools. The CBP was for 12–18 monthsafter which the FIP started. The FIP funds were approved only after the draft proposal prepared <strong>and</strong>submitted by the Village <strong>Watershed</strong> Committee (VWC) was considered. WOTR continued to providetechnical support during the FIP phase.iv. Bridging the gap between fund disbursement <strong>and</strong> implementation enhances the outcomes of CPRbased activitiesComplicated fund disbursement mechanisms of government departments <strong>and</strong> the involvement of multistakeholdersin natural resource management (NRM) programmes often cause delays in projectimplementation. The delays, if not managed, have a drastic impact on the motivation of participatingcommunities <strong>and</strong> cause hardship to those villagers dependent on wage labour in the project. Delays alsodisrupt the implementation of NRM activities thereby reducing the impact of watershed developmentwhen done in tune with the seasonal cycle. In order to ensure that there was no break in the flow offunds, an instrument called the “Disposition Fund” was created to bridge the gap between the end ofthe CBP <strong>and</strong> the beginning of the FIP. It ensured the smooth <strong>and</strong> continued flow of work in thewatershed which had a direct impact on the regeneration of CPRs.v. Ensuring post project continuity by creating a “Maintenance Fund”IGWDP was the first programme of its kind to place large sums of money in the h<strong>and</strong>s of villagersthemselves with partner NGOs as co-signatories. During the FIP phase, only the management costsrequired for the NGO were disbursed directly to them, whereas project funds were disbursed directly tothe joint account of the VWC <strong>and</strong> the NGO.Based on learning from completed watershed programmes, WOTR realized that the assets created duringproject implementation needed to be maintained so as to draw sustained benefits from the programme. As8 Recharge zone is an area where permeable soil or rock allows water to seep into the ground to replenish an aquiferor groundwater reserves (Source: www.groundwater.org).Page 10 of 56
maintenance requires financial resources, once the rehabilitation works were complete, half of the 20 %contribution made by the village to the cost of unskilled labour was returned to the VWC to form aMaintenance Fund. The funds from this account were to be used for the maintenance of publicstructures <strong>and</strong> common l<strong>and</strong> treatment.Page 11 of 56
4. The Problem <strong>and</strong> Alternative StrategiesTo ensure sustainability of water harvesting structures <strong>and</strong> facilitate ground-water recharge, treatment ofcatchment areas in the upper reaches of a watershed is a critical approach in WDPs. Treatment <strong>and</strong>regeneration of l<strong>and</strong> in the upper reaches, which is often common l<strong>and</strong>, requires that this l<strong>and</strong> is leftundisturbed to allow root-stock to regenerate <strong>and</strong> newly planted trees <strong>and</strong> grasses to grow. While suchinterventions have benefits in the long-term, they often lead to adverse short term impacts on those whodepend on these l<strong>and</strong>s for their livelihood. These are most often livestock keepers.Many HHs depended on livestock as an important source of income pre-watershed in all four l<strong>and</strong>categories. The predominant livelihood strategy was a livestock-crop farming system, where HHs withlarger l<strong>and</strong> holdings kept larger herds of mixed livestock than HHs with smaller l<strong>and</strong>holdings. The typeof livestock <strong>and</strong> herd/ flock size of animals was directly linked to the size of l<strong>and</strong> holding. The averagelivestock owned by large farmers (2-4 hectares) ranged between 10-15 cows, 2-4 pairs of bullocks <strong>and</strong>for marginal farmers with small l<strong>and</strong> holdings (0-1 ha <strong>and</strong> 1-2 ha), livestock owned comprised a pair ofbullocks, 3-4 cows <strong>and</strong> 15-20 goats. Sheep rearing was practised only by the Danghar community whokept around 100-200 sheep per family. (Source: FGDs <strong>and</strong> Field survey conducted in 2010). However, awide variation was found in different watersheds on livestock preference. This depended on type ofcommunity, location of watershed/village, extent of farming activity <strong>and</strong> agro-climatic zone. Sinceagricultural productivity was very low, the main source of fodder was forest l<strong>and</strong>s <strong>and</strong> CPRs.Table 2 below indicates dependence on livestock as primary <strong>and</strong> secondary sources of income in eachl<strong>and</strong>holding category in the four sample watersheds before the commencement of IGWDP, that is, prewatershed.The primary source of income indicates those HHs that were earning a constant income fromlivestock as the main livelihood activity. The secondary source of income indicates HHs for whichincome from livestock was a key income source but not the main livelihood activity. HHs that keptlivestock for farming or as a minor supplementary source of income once in a while are not included inthe table but form part of the sample of HHs studied. As mentioned in section 2.3, the study sample isrestricted to HHs whose l<strong>and</strong> category did not change over the 15-year time period <strong>and</strong> does not includeall HHs in the village.Table 2: Percentage of HHs Dependent on <strong>Livestock</strong> Pre-watershed (L<strong>and</strong> Category-wise)<strong>Watershed</strong> <strong>and</strong>(No. of HHs)Dependence on <strong>Livestock</strong>Sample Size0–1 ha 1–2 ha 2–4 ha 4-8 haTotalWanjulshet Primary source of income 6 2 0 0 7.60%115 HHs Secondary source of income 4 8 11 3 25.70%Darewadi45 HHsMhasw<strong>and</strong>i140 HHsM<strong>and</strong>wa25 HHsPrimary source of income 1 8 8 2 42.20%Secondary source of income 0 0 1 4 11.10%Primary source of income 22 17 4 1 31.40%Secondary source of income 4 11 7 0 15.70%Primary source of income 0 0 0 0 0.00%Secondary source of income 4 0 1 0 23.10%Implementation of the non-negotiable strategies - the ‘ban on tree felling <strong>and</strong> free grazing in treatedareas’- resulted in inter-community conflicts because it further decreased the limited sources of fodder 9for livestock. These conflicts disrupted the programme in several villages. However, another keyapproach in IGWDP was the building of consensus between all communities in a village, <strong>and</strong> for all HHsto jointly agree to adhere to norms <strong>and</strong> to the non-negotiable strategies. Hence, the challenge that layahead for WOTR was to convince livestock owners- sheep rearers, in particular - to be part of theprogramme even though it would cause hardship for them in the first few years.9A ban on grazing in forest areas imposed by the state FD was already underway.Page 12 of 56
Approach taken by WOTR to reduce problems that emerged:To reduce hardship to livestock owners, watershed treatment was initially done only in those areas thatwere most essential to facilitate ground water recharge. These areas were designated as high potentialrecharge zones, <strong>and</strong> were selected on the basis of the topography <strong>and</strong> the location of the catchment area.<strong>Watershed</strong> treatment was not only limited to soil <strong>and</strong> moisture conservation interventions but alsoincluded plantation of trees <strong>and</strong> grass, <strong>and</strong> the promotion of horti-pasture models. This too was done in aparticipatory manner with members of the VWC. The final decision on what activities were to beimplemented on which sites was taken in the presence of all villagers.The ban on grazing was restricted only to the treated area, <strong>and</strong> to reduce problems for livestock keepers,the treatment was taken up in phases. The ban on grazing in the high potential recharge zones continuedfor at least 4–5 years but fodder could be harvested through the cut-<strong>and</strong>-carry system after the first year.To ensure regeneration, penalties were levied on those who entered the restricted area <strong>and</strong> this includedHHs from within the village as well as migratory livestock keepers. Conflicts were resolved in the GP inthe presence of all villagers <strong>and</strong> VWC members, <strong>and</strong> a common fine was levied on those who broke therule. To underst<strong>and</strong> the need for social discipline, exposure visits to Ralegaon Siddhi <strong>and</strong> Hivre Bazaarwere also organized, during the CBP. These watershed development <strong>and</strong> l<strong>and</strong> treatment projects werealready operational in Ahmednagar district <strong>and</strong> had strong elements of social discipline <strong>and</strong> communityeffort. Interactions in these villages helped communities underst<strong>and</strong> the benefits of social discipline <strong>and</strong>how to better h<strong>and</strong>le inter-village <strong>and</strong> intra-village conflicts. WOTR also involved all relevantgovernment officials <strong>and</strong> political leaders in the district to explain the benefits of IGWDP as well asencourage communities to participate in the programme.Page 13 of 56
5. OutcomesImpact on livestock-based livelihoods: Documentation of select case studiesThis section illustrates the outcomes of the IGWDP by describing a few general achievements <strong>and</strong>documents case studies that describe the changes in livestock-based livelihoods post-watersheddevelopment.a) Treatment of large areas of non-arable l<strong>and</strong>s by applying the ridge-to-valley approach led to anincrease in fodder availability from CPRs <strong>and</strong> agriculture:Applying the ridge-to-valley approach <strong>and</strong> treating non-arable l<strong>and</strong>s in the upper reaches of thewatershed yielded positive results in terms of improved ground water recharge <strong>and</strong> regeneration of CPRs.This has led to increased agriculture productivity as also increase in fodder availability both through cropresidue <strong>and</strong> fodder from regenerated common l<strong>and</strong>s. Most farmers now also cultivate fodder crops, a newpractice initiated after the commencement of IGWDP, primarily to maintain the cross-bred cattle.b) Changes in livestock-based livelihoods post-watershed development:The ban on grazing in forests is still applicable today; however, the initiation of WDPs in 1997 broughtabout a few changes in both agriculture <strong>and</strong> livestock-based livelihoods. It is to be noted that all changesseen in livestock-based livelihoods cannot be viewed solely as the results of the watershedprogramme because discussions with communities revealed that there were many other externalfactors that induced these changes. As each watershed has distinct livestock-related livelihoods, thefindings specific to each watershed are detailed below as brief case studies. Graphs showing thepercentage change in livestock holding primarily capture the current status. However, wherever possiblean attempt has been made to document change over time <strong>and</strong> the reasons for this change, based on dataavailable <strong>and</strong> information obtained through FGD.Page 14 of 56
Case Study 1: Improving the quality of life for sheep rearers through watershed development,Darewadi watershed, Sangamner Taluka, District AhmednagarDarewadi is a remote village located in the Sangamner block of Ahmednagar district. It falls in the rainshadowregion of Maharashtra. The watershed area comprises 1,535.24 ha, of which 1,063.43 ha isprivate l<strong>and</strong>, 306.53 ha is forest l<strong>and</strong>, 147.59 ha is revenue l<strong>and</strong> <strong>and</strong> 17.69 ha is community grazing l<strong>and</strong>(gyran). The village has 131 HHs largely comprising the Maratha <strong>and</strong> Vanjiri castes. Forty per cent ofthe HHs belong to the Dhangar community (the traditional shepherd community of Maharashtra).Prior to the commencement of IGWDP, water was scarce <strong>and</strong> the l<strong>and</strong> was so unproductive that evenduring years of good rainfall, only 3–4 months of agriculture wage labour was possible. Darewadi was onthe verge of desertification when IGWDP was initiated in 1996. Drinking water was supplied by tankersfrom February till July every year. Migration in search of work was high <strong>and</strong> livestock rearing was thenext viable source of income for many HHs.Pre-watershed, Darewadi had the highest percentage of HHs dependent on livestock, particularly smallruminants. Table 3 shows HHs that depended on livestock as a primary <strong>and</strong> secondary source ofincome. 10 Table 3: Dependence of Households on <strong>Livestock</strong> as Primary <strong>and</strong> SecondarySources of Income0–1 ha 1–2 ha 2–4 ha 4–8 ha %Darewadi (Pre-watershed)Primary 1 8 8 2 42.20%Secondary - - 1 4 11.10%Darewadi (Post-watershed )Primary - 5 5 1 24.40%Secondary - 1 5 1 15.60%Graph 1: <strong>Livestock</strong> Holding Per L<strong>and</strong>holding Category Pre-watershed in Darewadi (1995)1,6001,4001,2001,000800600400200-0-1 ha 1-2 ha 2-4 ha 4-8 haSheep Goat Bullocks Indigenous Cattle Crossbred Cattle10 These are from among the sample HHs for the study, which witnessed no change in the l<strong>and</strong>holding category, pre<strong>and</strong>post-watershed. As detailed in Table 2, Section 4 above, the number of sample HHs for Darewadi watershedwas 45. The table details the number of HHs of this sample for whom livestock rearing was either a primary or asecondary occupation. HHs that maintained livestock only for agriculture, or only seasonally, have not beenincluded in this table.Page 15 of 56
Impact of IGWDP on Darewadi <strong>Watershed</strong>IGWDP substantially increased the water table in Darewadi (Graphs 2 <strong>and</strong> 3). This, along with socialfencing of treated common l<strong>and</strong>s, increased fodder availability both on common l<strong>and</strong>s as well as onprivate agricultural l<strong>and</strong>s. Sheep rearers also claim that there has been considerable increase in palatablespecies in the CPRs within the watersheds (however no bio-diversity based studies have been carried outby WOTR). The once barren <strong>and</strong> rocky terrain, with nothing but shrubs <strong>and</strong> cactus, now has several trees<strong>and</strong> grass (See pre- <strong>and</strong> post-watershed photographs). The survival <strong>and</strong> vigour of plant growth itself iswitness to the changes that have taken place.Graph 2: Rainfall <strong>and</strong> Vegetation Pre- <strong>and</strong> Post-<strong>Watershed</strong> <strong>Development</strong>20001500100050001996 1999Rainfall (mm)(Source: WOTR data base)VegetationVegetation values assessed visually fromremote sensing satellite data9008007006005004003002001000Graph 3: Increasing Water Table of Darewadi <strong>Watershed</strong>1995 1996 1997 1998 1999 2000 2005 2007 20080-1-2-3-4-5-6-7Rainfall (mm)WL below Ground LevelPage 16 of 56
Darewadi: Pre- (1996) <strong>and</strong> Post–watershed (2008)In Darewadi, as also in the other sample watersheds, there was an increase in both the area undercultivation as also cropping intensity. With increased water recharge, farmers are now able to take threecrops from their l<strong>and</strong>s. The results are detailed in Table 4. Following the IGWDP, the watershedwitnessed a sudden shift to cross-bred cows; however due to lack of knowledge on rearing <strong>and</strong>management practices, a drastic fall in cross-bred cows was subsequently observed (Graph 4). Graph 5shows current changes in livestock holding with farmers across different l<strong>and</strong>holding categories. A shiftfrom cross-bred cows to buffaloes was also observed; however, it was restricted only to farmers in the 1–2 ha category. FGDs with farmers revealed that there is an acute shortage of bullocks <strong>and</strong> these are nowunaffordable for many farmers. The price of a pair of bullocks has increased from just Rs 10–15,000 apair to Rs 50–70,000 a pair. The main reason for this is that many farmers do not rear indigenous/nondescriptcows anymore. Due to a reduction in the numbers of large ruminants, primarily due to a shift tocross-bred cows <strong>and</strong> the ban on grazing in forests, there is an acute shortage of farmyard manure muchneeded for agriculture. This has led to an increased use of chemical fertilizers <strong>and</strong> a resultant increase inagriculture input costs.Table 4: Impact of <strong>Watershed</strong> <strong>Development</strong> on Fodder, Agriculture <strong>and</strong> Water AvailabilityAgriculture <strong>and</strong> Livelihood Pre-watershed 1996 Post-watershed 2001 2009ParametersIrrigated areaPerennial 0 ha 13.31 ha 18.40 haSeasonal 197.23 ha 329 ha 470 haMilk production Insignificant 788 l/per day 360 l/per dayAgriculture employment 3–4 months 9–10 months 9–10 monthsFodder production 1,054 tonnes/year 2,848 tonnes/year 3,915 tons/yearNumber of wells 23 63 173Average depth of water table 6.5 m 3.5 m 2.5 mPage 17 of 56
Graph 4: Percentage Change in Cross-bred Cows with Farmers in Different L<strong>and</strong>holdingCategories (2009)0%-20%0-1 ha1-2 ha2-4 ha 4-8 ha 8 ha <strong>and</strong> above-40%-60%-80%-100%-120%Graph 5: Percentage Change in <strong>Livestock</strong>Holding inDifferent L<strong>and</strong>holdingCategories(2009)150%100%50%0%-50%0-1 ha1-2 ha2-4 ha 4-8 ha 8 ha <strong>and</strong> above-100%-150%SheepGoatBullocksIndigenous CattleBYPBuffaloDarewadiwas the only watershedthat had sheep rearers; therefore, in-depth interviews <strong>and</strong> FGDs wereconductedd with them. Pre-watershed, the average flock size managed by the Dhangars was around 100–200 sheepper HH <strong>and</strong>3–4 members were involved full-time in the occupation. Atthat time, all familieswere largely joint families. Even under such conditions, at times extra labour wasemployed to managethe flocks. As fodder<strong>and</strong> water for livestockwere scarce, migrationwas common, often for over sixmonths each year. The shepherds would travel 400–500 km in searchof fodder because the flock sizewas large. Sheep rearing was primarily based on the fodder available in the CPRs <strong>and</strong> forests, <strong>and</strong>grazing on agriculture fields where available. The average income earned per month was around Rs16,000 per HH, including the sale of animals, sheep milk as well as sheep wool. Sheep were largelyreared under a traditional loan system called rakholi. 11During the early daysof the watershed programme, shepherds faced many problems because more CPRl<strong>and</strong> came under theban on grazing, <strong>and</strong> entry into forest l<strong>and</strong>s was alreadyrestricted. However,participation in regular IGWDP meetings brought in clarity about theprogramme. Although faced withhardships, the Dhangar community agreed to abide by therules set because there was hope that IGWDPwould lead to an improvement in water availability. However, shepherd families also indicatedd that theywere too few in number to negotiate with the larger villagefor greater accessibility to CPRs.The discussions revealed that perceptions onthe benefits from the watershed programme among theDhangar community varied. This was mainly due to the location of their l<strong>and</strong> in the watershed.However,practicallyall agreed that there is much more water available through the watershed programme <strong>and</strong> thatthe vegetation has also improved.They further said that the impact of the WDP is more in terms of an11 Rakholi is a loan system, in which a rich l<strong>and</strong>lord gives a loanto buy animals <strong>and</strong> rear them. At the end of eachyear, the sheep rearer needs to return not only the principal loan amount but also all the female progeny in the flockto the l<strong>and</strong>lord.Page 18 of 56
improvement in the overall quality of life <strong>and</strong> increase in other sources of income rather than benefits tosheep rearing. They now practise mixed crop-livestock farming <strong>and</strong>, with the more settled lifestyle, theyare also able to send their children to school. Some families shared that the main impact is that they arenow out of the rakholi system <strong>and</strong> the animals they raise are their own. The sudden increase in incomefrom agriculture as a result of watershed development activities enabled them to get out of the viciousloan cycle <strong>and</strong> invest in their own livestock.Due to increased cases of theft during the past few years, the Danghars feel it is difficult to maintain aflock size of more than 50–80 sheep per HH. Further, the available person power per family has alsoreduced because some family members are now involved in settled agriculture. They continue to migratefor over six months each year, <strong>and</strong> the grazing route has decreased to just 100 km because the flock sizeper HH has also reduced.They concluded by saying that access to grazing l<strong>and</strong>s is still an issue because the FD has banned themfrom entering forest areas for grazing. However, after the WDP, they are able to stay back in the villagefor a longer time, especially during the monsoon season. IGWDP brought more l<strong>and</strong> under agricultureproduction which has increased l<strong>and</strong> available for grazing post harvest. The main source of fodder nowcomes from farmers’ fields, which is often in exchange for sheep manure, <strong>and</strong>, therefore, available freefor the shepherds. At times, they also get paid for penning their sheep in agricultural fields, which is anincreasing trend due to the decreased availability of farmyard manure. They added that even now thevillagers do not allow them to graze in the treated areas <strong>and</strong> no measures to support their grazing needsare taken up. However, no action is taken against those who cut trees in Darewadi, <strong>and</strong> they hoped thatmeasures would be taken in this regard.Apart from the above, the main benefit to shepherd communities has resulted from an increase in theprice of meat <strong>and</strong> animals, adoption of settled agriculture <strong>and</strong> changes in rearing <strong>and</strong> managementpractices. Table 1 in Annexure 2 shows the change in income <strong>and</strong> profit of a sheep rearer over 15 years. Itis worth noting here that even though the flock size has reduced, the revenue <strong>and</strong> net profit has increasedsubstantially. In this case, the economies of scale are working in favour of the sheep rearers as the profitper sheep has gone up even though the total flock size has gone down. The reasons for this growth aredoubling of the sale price of animals; negligible labour cost due to reduced flock size <strong>and</strong> grazing route(family members now manage the flock <strong>and</strong> external labour need not be hired); lower mortality <strong>and</strong>morbidity rates (perhaps on account of improved feed availability <strong>and</strong> shifting back to rearing localbreeds 12 ) <strong>and</strong>, most important, a shift out of the traditional loan system, rakholi.12 Group discussions with sheep rearers revealed that they tried to rear other sheep breeds that gained weight fasterthan local breeds (mainly cross-bred sheep, but the breed could not be identified) due to higher dem<strong>and</strong> for meat.However, losses due to high mortality, morbidity <strong>and</strong> unsuitable climate made them shift to keeping mixed flocks.This strategy also failed miserably due to disease spread <strong>and</strong>, ultimately, led them to shift back to rearing localbreeds. The local breed raised is distinct to this area, <strong>and</strong> WOTR is working on a formal recognition of this breed.Page 19 of 56
InterviewName of Person: Shivaji Rambhau Kar<strong>and</strong>eAge: 38Education: 7 th St<strong>and</strong>ardOccupation: Sheep rearer belonging to the Dhangharcommunity <strong>and</strong> member of the VDC of Darewadi<strong>Watershed</strong>Address: Darewadi <strong>Watershed</strong>, Sangamner, DistrictAhmednagarBefore the IGWDP started in our village, WOTRorganized a meeting to brief the community regarding the programme, the implementation structure, thebenefits <strong>and</strong> the social discipline systems that needed to be followed in the village. I learnt that one nonnegotiableprinciple in the project was a ‘ban on grazing in watershed treatment areas’. I did see theimportance of this but also knew it would not be accepted by my community. Of 140 HHs, 40-60 familiesreared sheep <strong>and</strong> goat, including myself. But the many meetings <strong>and</strong> trainings organized changed mythinking. Fodder in the village was only available for two months due to which we had to migrate forlong periods of time over large distances. I could underst<strong>and</strong> that after the watershed development work,this may change <strong>and</strong>, due to increased moisture in the soil, there would be more fodder for our sheep.With this underst<strong>and</strong>ing, I supported the ban on free grazing even though I had the largest flock of sheepin the village. I temporarily shifted my sheep out of the village <strong>and</strong> being a member of the VWC startedtelling others also to support the ban on free grazing in treated areas <strong>and</strong> aim to increase the vegetativecover in the watershed.I was looked upon as an enemy by other sheep rearers but I did not give up <strong>and</strong> continued telling peoplethe importance of the watershed treatment work <strong>and</strong> the returns we would get. As I practised what Ipreached, others slowly began to underst<strong>and</strong> the concept. I also thought that rather than just rearingsheep, I could start agriculture <strong>and</strong> also rear dairy animals because I knew the effect on our l<strong>and</strong>s ofhaving too many sheep. Since many of us did not have the capacity to shift our livestock out of thevillage, the conflicts did not subside. We then came up with the idea of dividing the treated l<strong>and</strong>s intoblocks, <strong>and</strong> enforcing the ban on grazing in a rotational manner. We also allocated a separate patch ofl<strong>and</strong> for grassl<strong>and</strong> development <strong>and</strong> grazing.Today, along with sheep <strong>and</strong> goats I have a few indigenous cattle <strong>and</strong> poultry, <strong>and</strong> I cultivate four acres ofmy l<strong>and</strong>. I earn almost Rs 200,000 just from my livestock every year!Page 20 of 56
Case Study 2: Traditional livestock systems support improved watershed management <strong>and</strong> livelihoodsecurity, M<strong>and</strong>wa watershed 13 , Nagpur DistrictM<strong>and</strong>wa is located in the Hingna block of Nagpur district in Maharashtra, <strong>and</strong> falls in the moderaterainfall zone of Maharashtra. The watershed is remotely located, accessible by a kaccha road. The nearestmilk collection centre is 8 km away <strong>and</strong> the nearest market is 17 km away. M<strong>and</strong>wa is 40 km away fromthe Nagpur district headquarters.The area gets 59 days of rainfall on an average from June to September each year, adding up to 1,161mm. The monsoons bring storms of high intensity. Therefore, high soil erosion is observed in thewatershed area. The climate in summer is very dry <strong>and</strong> hot <strong>and</strong> the humidity is down to just 20%. Theaverage temperature in the summer months is 48º C <strong>and</strong>, in the winter, it drops to a minimum of 20ºC.The area under the watershed is 912 ha, of which 404 ha is forest l<strong>and</strong>, covered by thin forest. Of 218 haof revenue l<strong>and</strong>, 88 ha has been encroached upon <strong>and</strong> is de-facto private l<strong>and</strong>. Of the 290 ha private l<strong>and</strong>,80 ha is irrigated <strong>and</strong> the rest is rain-fed. Under IGWDP, 667.44 ha have been treated. There are 29 wellsin the village; only one well is perennial <strong>and</strong> serves as a drinking water source for the village.The village had 65 HHs when IGWDP started <strong>and</strong> now has 88 HHs. More than 90% belong to theScheduled Tribe category (Gonds, Mama, Mali, Dhivan, Teli <strong>and</strong> Kunabi). The average l<strong>and</strong>holding sizeis 4.86 ha/ HH. However, the ownership of l<strong>and</strong> is highly skewed, with 30% of the population owning65% of the l<strong>and</strong>.Graph 6: <strong>Livestock</strong> Holding Per L<strong>and</strong>holding Category—Pre-watershed in M<strong>and</strong>wa (1995)201510500-1 ha 1-2 ha 2-4 ha 4-8 ha 8 ha <strong>and</strong> aboveSheep Goat BullocksIndigenous Cattle Crossbred Cow BYPBuffaloIn the pre-watershed scenario M<strong>and</strong>wa had problems similar to the other sample watersheds, <strong>and</strong> wasplagued by unproductive l<strong>and</strong>, recurrent droughts, acute poverty <strong>and</strong> migration. During the pre-watershedperiod, more than 90% of the area was under rain-fed agriculture, with only three HHs having wells forirrigation. Agriculture was primarily subsistence <strong>and</strong> livestock rearing was a primary source of income.As depicted in Graph 6, 14 goat rearing <strong>and</strong> the sale of farm animals was a key source of income. Poultryrearing was a widespread practice both for home consumption as also for the sale of eggs <strong>and</strong> birds.FGDs revealed that since livestock rearing was an important source of livelihood for farmers in M<strong>and</strong>wa,they found it difficult to abide by the ban on grazing in treated areas. However, due to the effort <strong>and</strong> timeon the part of the implementing agencies, compliance to the rule was brought about even though thecommunity was not fully convinced of the positive effects of the ban. The remote location of thewatershed facilitated compliance of the ban, as there was enough wastel<strong>and</strong> beyond the treated area forgrazing livestock, thereby reducing hardship. This may be the reason why the numbers of bothindigenous cattle <strong>and</strong> goat population are still considerably high post-watershed, in comparison to othersample watersheds.13 The watershed programme in this watershed was implemented by a Nagpur-based NGO called the ComprehensiveRural Tribal <strong>Development</strong> Project (CRTDP) with capacity building support from WOTR under IGWDP.14 The graph shows no HHs in the 4–8 ha category because they fall in the sample of HHs that have witnessed achange in l<strong>and</strong> category post-watershed <strong>and</strong>, hence, have not been considered.Page 21 of 56
There have been numerous positive post-watershed impacts (See Table 5). A recent study undertaken byAFPRO (2008) shows a striking change in the income level, <strong>and</strong> the farm sector has emerged as a majorprimary source of income, with a ten-fold increase in income, primarily on account of the cultivation ofcash crops. However, the contribution of livestock (sale of milk, farm animals, eggs, birds <strong>and</strong> milkproducts) to HH income has decreased considerably post-watershed. As informed by the community,there is no deficit in both grass <strong>and</strong> tree fodder for livestock post-watershed development.Table 5: Impact of <strong>Watershed</strong> <strong>Development</strong> on Fodder, Agriculture <strong>and</strong> Water AvailabilityAgriculture <strong>and</strong> Livelihood Pre-watershed Post-watershed2008Parameters19952001Cultivated areaPerennial 15 ha 40 ha 200 haSeasonal 300 ha 260 ha 100 haVegetable cultivation 04 ha 40 ha 60 haProduction—crop yield (Rs/acre) 20,000 75,000 1,25,000Milk production 20 litres per day 200–270 litres per 200 litres per daydayAgriculture employment 3–4 months 9–10 months All year roundFodder production tonnes/year 8 12 Surplus (it was notpossible to quantify thisbecause only grazing ispractised now.)Number of wells 3 20 33Depth of the well(feet below ground level)20 8–10 6–7Graph 7: <strong>Livestock</strong> Holding Per L<strong>and</strong>holding Category—Post-watershed in M<strong>and</strong>wa (2009)20151050-50-1 ha 1-2 ha 2-4 ha 4-8 ha 8 ha <strong>and</strong>aboveSheep Goat BullocksIndigenous Cattle Crossbred Cow BYPGraph 7 shows the percentage change in livestock holding post-watershed. Even though fodderavailability has increased tremendously <strong>and</strong> the hardship faced in reaching the milk collection centre/other markets has reduced considerably (purchase of two wheelers) post-watershed, livestock rearing <strong>and</strong>the numbers of livestock have reduced at the HH level. This decrease, however, is mainly on account of ashift to an agriculture-based economy. Further, FGDs revealed that income from agricultural labour workis much more lucrative than rearing livestock, particularly if the number of animals is high. This isbecause HHs need to depend on the ‘charaiya’ (see description below) for grazing livestock since familymembers are busy in their agriculture fields. The increase in agriculture has augmented the dem<strong>and</strong> forlabour, resulting in an increase in wage rates, ranging from Rs 25,000 per annum for the relativelyyounger to Rs 18,000 for older people. Wage rates change as per the crop <strong>and</strong> the type of work requiredin the fields because vegetable crop production is highly labour-intensive. Agricultural labourers alsoreceive 500–600 kg of grain (wheat, jowar, etc.), in addition to the above wages.Despite the above, livestock-based livelihoods are more profitable <strong>and</strong> secure than in the pre-watersheddays, particularly for HHs falling in the 0–1 <strong>and</strong> 1–2 ha categories. This is because the increase inPage 22 of 56
agricultural production as well as successful watershed development has facilitated traditional livestockrearing systems, to emerge as a viable livelihood opportunity.The charaiya/ village herder: Parts of the treated area are still under the grazing ban in M<strong>and</strong>wa;therefore, grazing of livestock needs to be carried out on l<strong>and</strong> available at considerable distance from thevillage. A few HHs belonging to the 0–1 ha category generate a livelihood by grazing village livestock.They collect theanimals from the HHsin the morning, grazethem throughout theday in <strong>and</strong> around thewatershed <strong>and</strong> bringthem back towardsevening. Each charaiyamanages up to 40animals in the case oflarge ruminants <strong>and</strong>slightly more in thecase of smallruminants. The grazingfee (Rs 55 per animalper month) is the samefor both large <strong>and</strong> small ruminants. The HHs that have large flocks do not use the services of thecharaiya, who are few in number. In M<strong>and</strong>wa, currently there were three persons managing the totallivestock in the village, earning an income of Rs 26,400 each per annum. The appointment of a charaiyais a viable solution to the problem of overgrazing <strong>and</strong> facilitates the protection of enclosed areas moreeffectively.The sale of bullocks: As the price <strong>and</strong> dem<strong>and</strong> of bullocks has increased substantially, it has become ahighly lucrative livelihood option for the l<strong>and</strong>less <strong>and</strong> for farmers falling in the 0–1 ha category.Discussions revealed that they generally purchase calves around 2 years old, costing Rs 2,500–3,000each, rear them for two years <strong>and</strong> sell them for Rs 10,000 –12,000 each. Input costs are marginal sincethe calves are entirely grazed on common l<strong>and</strong>s. Cross-bred male calves are also sold. However, they arenot preferred because these animals are apparently unable to work in the heat <strong>and</strong>, as reported by thecommunity, have no aesthetic value.Grazing based dairy farming: Communities in the M<strong>and</strong>wa watershed found it difficult to underst<strong>and</strong> the‘cut-<strong>and</strong>-carry’ method of fodder harvesting, <strong>and</strong> it appeared a waste of time. Even now, they are of theopinion that cattle must be left free to graze, particularly with increased agricultural work in the postwatershedperiod. In this watershed, the community entirely depends on free grazing even for cross-bredcows <strong>and</strong> buffaloes! However, the community did recognise that there is a reduction in milk productionby cross-bred cows when they are grazed. This was, however, not a concern because a cross-bred cowwould produce between 5 <strong>and</strong> 7 litres of milk a day. Cross-bred cows are largely low-grade Jerseycrosses; therefore, health care costs are low <strong>and</strong> fodder requirement in a free grazing system is negligible.The only investment required is for feed concentrate (oil cake <strong>and</strong> cotton seed cake) <strong>and</strong> the monthly feeto the charaiya (Rs 55 per animal per month). Discussions revealed that pre-watershed, the farmers ofM<strong>and</strong>wa had put in a lot of effort in rearing <strong>and</strong> maintaining high yielding cow breeds, to earn incomefrom the sale of liquid milk; this continued in the initial post-watershed years. However, due toremoteness of the village, lack of roads, high disease incidence <strong>and</strong> failure of a diary initiative by a SelfHelp Group (SHG) as well as interventions by the Animal Husb<strong>and</strong>ry Department introducing a breedfrom Haryana, the community now prefers the rearing of low-grade Jersey cows. The failure ofinitiatives, based on higher grade crosses <strong>and</strong> new breeds were mainly due to animal death <strong>and</strong> disease,difficulties in accessing markets on account of remoteness <strong>and</strong> unmanageable workloads. This negativeexperience appears to have contributed to restricting community preference to low-grade cross jerseycows <strong>and</strong> the rearing of indigenous buffaloes, which is a recent trend.Page 23 of 56
Goats—critical support system to agriculture: Goat farming in the M<strong>and</strong>wa watershed shows anincreasing trend, together with more l<strong>and</strong> being brought under cultivation as a result of watersheddevelopment. Goat rearing has emerged as a key support system to input intensive cash cropping. Thegoats reared are often sold when inputs (fertilizers, seeds, labour, etc.) are required for agricultureproduction. FGDs revealed that the goat population was much higher before 2008, <strong>and</strong> reducedfollowing the occurrence of an epidemic that wiped out goat flocks. This instilled fear among many aboutrearing goats again. The nearest veterinary hospital is 8 km away <strong>and</strong> no health-care services areavailable within the village.Page 24 of 56
Case Study 3: CPR-based dairy farming, Mhasw<strong>and</strong>i <strong>Watershed</strong>, Sangamner Taluka, AhmednagardistrictVillage Mhasw<strong>and</strong>i is located in the foothills of the Sahayadri ranges of Western Maharashtra in theSangamner taluka of Ahmednagar district, <strong>and</strong> falls in the rain shadow zone. The average annual rainfallis 399 mm. The topography of the watershed is undulating with over half the total area under forest, withsteep slopes of over 25%, devoid of protective vegetative cover, resulting in extensive degradation <strong>and</strong>erosion. The area of the watershed is 1,145 ha of which 377.49 ha is arable l<strong>and</strong>, 20.75 ha is cultivablewastel<strong>and</strong> <strong>and</strong> 231.50 ha is uncultivable wastel<strong>and</strong>. Forest l<strong>and</strong> in the watershed is 502.10 ha <strong>and</strong>panchayat l<strong>and</strong> comprises 13.16 ha. Mhasw<strong>and</strong>i is home to 220 HHs spread across nine hamlets. Sixtyper cent are Marathas <strong>and</strong> other sub-castes such as Chambhar, Navhi, <strong>and</strong> Sutar. The remaining 40% areThakkar Adivasis.Prior to the commencement of IGWDP, water for both agriculture <strong>and</strong> domestic use was scarce in thevillage. Agriculture was primarily rain-fed with the irrigated area restricted to the valley <strong>and</strong> lower ridgeareas of the watershed. Residents depended on water tankers from nearby areas between April <strong>and</strong> Julyeach year. The pressure on cultivable l<strong>and</strong> was immense. This led to an over-exploitation of resourcessuch as l<strong>and</strong> <strong>and</strong> water, in order to meet basic requirements of grain, fodder <strong>and</strong> fuel. Village grassl<strong>and</strong>s<strong>and</strong> forest l<strong>and</strong>s were overgrazed by the existing livestock population, which mainly comprised nondescriptcattle <strong>and</strong> goats (Graph 8). Cattle were reared mainly to produce bullocks for sale <strong>and</strong> the milkproduced was consumed at home. Other sources of income were agricultural labour <strong>and</strong> migration insearch of work to cities such as Nashik, Pune or Mumbai. Those who did not get any employment startedbrewing <strong>and</strong> selling liquor in the village, which led to the deterioration of family <strong>and</strong> social life.400350300250200150100500Graph 8: <strong>Livestock</strong> Holdings in Mhasw<strong>and</strong>i <strong>Watershed</strong> (1994)(Source WOTR-IGWDP Database)0-1 ha 1-2 ha 2-4 ha 4-8 ha 8 ha <strong>and</strong>aboveSheepGoatBullocksIndigenous CattleCrossbred CowBYPBuffaloThe main impact of the watershed programme was the increase in l<strong>and</strong> under cultivation, <strong>and</strong> animprovement in the availability of water for irrigation. Increased agriculture productivity <strong>and</strong> wateravailability resulted in farmers moving away from the rearing of non-descript cows to rearing high grade75% Holstein Friesian cows. The cropping pattern also changed from the earlier focus on groundnut,pearl millet <strong>and</strong> sorghum to crops such as potato, tomato, onion, wheat, soya bean, floriculture, <strong>and</strong>fodder crops such as maize <strong>and</strong> hybrid napier. A general decrease in the numbers of all types of livestockin each l<strong>and</strong>holding category is observed. However, the total population of livestock in the watershed hasincreased over time. Currently, for many HHs, livestock rearing has become a key secondary source ofincome (See Tables 6 <strong>and</strong> 7, <strong>and</strong> Graphs 9 <strong>and</strong> 10). During FGD <strong>and</strong> specific interviews, farmers sharedthat market rates of agricultural 15 produce fluctuate so much that income from milk is a stable <strong>and</strong> securesource of income for all. In Mhasw<strong>and</strong>i too, farmers said that the ban on grazing in forests enforced bythe forest department is the main reason for reducing the numbers of indigenous cattle. The watersheddevelopment programme has enabled the rearing of cross-bred cows in this once very barren <strong>and</strong> waterdeficientvillage due to increased water availability. HHs that depend on goat-rearing, with larger flock15 Maharashtra, particularly district Ahmednagar <strong>and</strong> its adjoining districts, are the largest producers of tomato,onion <strong>and</strong> fruits in the country.Page 25 of 56
size, mentioned that access to grazing is still a major problem. This is because entry to forests iscompletely banned <strong>and</strong> the remaining area is under agriculture production.Table 6 0–1 ha 1–2 ha 2–4 ha 4–8 ha %Mhasw<strong>and</strong>i (pre-watershed)Primary 22 17 4 1 31.40%Secondary 4 11 7 0 15.70%Mhasw<strong>and</strong>i (post)Primary 11 5 1 0 12.50%Secondary 12 14 8 1 25.00%Note: The sample size for this watershed was 140 HHs <strong>and</strong>, of these, the above table details those forwhom livestock rearing was either a primary or secondary source of income. Primary source of incomeindicates those HHs that were getting a regular income from livestock to sustain their livelihoods withincome from other sources as secondary to this. A secondary source of income indicates that those HHsfor whom income from livestock is a key income source but is not the main source of income. HHs thatkept livestock for farming (for example bullocks for draft purpose) or for minor supplementary incomeonce in a while are not included.Table 7: Impact of <strong>Watershed</strong> Treatment on <strong>Livestock</strong> <strong>and</strong> Fodder AvailabilityItemsPre-watershedPrior to 1994Post-watershed2001 2006Irrigated areaPerennial 29 ha 70 ha 175 haSeasonal 35 ha 135 ha 423 haTotal 61 ha 205 ha 598 haDairy (milk)190 litres/day 790 litres/day 464 litres/day(in 1992, 70 litres/day)Agriculture employment (l<strong>and</strong>less HHs) 3 months 8 months Throughout theyearL<strong>and</strong> Value (Rs/ha)Agriculture Rs. 15000 Rs. 80,000 7.5 lakhsWastel<strong>and</strong> (Rain-fed) Rs. 5000 Rs. 45,000 1.25 lakhsFodder production 950 tons 1,920 tons 2,500 tons(Source: WOTR Database)Graph 9: Percentage Increase in Cross-bred Cows with Farmers in Different L<strong>and</strong>holdingCategories in Mhasw<strong>and</strong>i - 20098 ha <strong>and</strong> above4-8 ha2-4 ha1-2 ha0-1 ha0% 500% 1000% 1500% 2000% 2500% 3000% 3500%Page 26 of 56
Graph 10: Percentage Change in <strong>Livestock</strong> Holdingin Different L<strong>and</strong>holding Categories inMhasw<strong>and</strong>i 20090%-20%0-1 ha1-2 ha2-4 ha4-8 ha8 ha <strong>and</strong>above-40%-60%-80%-100%GoatBullocksIndigenous CattleBYPBuffaloCPR-based Dairy Farming SystemThe CPR-based dairyfarming system under implementation in Mhasw<strong>and</strong>i is managed by the forestprotectioncommittee (FPC) in collaboration with the GP, the VDC <strong>and</strong>the state FD. Under thisinitiative,502.10 haof forest l<strong>and</strong> <strong>and</strong> 13.16 ha of revenue l<strong>and</strong> (gyran) are protected <strong>and</strong>managed, to producefodder fordairy livestock in the village. This involves the division of CPRs into plots, ranging from 15 to30 ha, which are auctioned in thevillage in the presencee of the GP, FPC, VDC <strong>and</strong> the FDofficer incharge ofthe area. The price for each patch of l<strong>and</strong> starts from Rs 500 <strong>and</strong> goes up to Rs 3,500. Therationale for patch valuation depends on the quality <strong>and</strong> quantity of grass/fodder in the patch, which isevaluated by the GP, FPC <strong>and</strong> VDC members. The auctionis conducted annually <strong>and</strong> the fundsgeneratedaverage Rs 50,000 to Rs 60,000, depending onthe numberof plots auctioned. The money generated fromthis is deposited in theFPC account, <strong>and</strong> a register is maintained by the various committees. The fund isused for village development activities <strong>and</strong> community gatherings during festivals, etc. Once a patch ofl<strong>and</strong> has been allottedto a particular HH, it is in-charge of this <strong>and</strong> collects fodder from thel<strong>and</strong> onlythrough the cut-<strong>and</strong>-carry system.Surplus fodder is sold to other farmers within the watershed. As theplot sizes are large, groups of small farmer’s pool money to bid for thel<strong>and</strong>; re-bidding of the l<strong>and</strong> by theallottee isalso permitted. Once the plot is taken on lease for a year, the farmers divide it amongthemselves, dependingon how much money they contributed <strong>and</strong> thenumber ofcross-bred cows theyown. Similar to otherHHs in thevillage, l<strong>and</strong>less HHs are also eligible to bid for the plots, <strong>and</strong> sellfodder.As milk productionin thevillage increased considerablyfrom 190litres per day in1994 to 790 litres per day in2001, a milk association,managed by the VDC, wasformed in the village. Thedaily milkoutput after 2001has however come down fromthe high of 800 litres a day,stabilizingin the range of400-600 litres a day. This hasmainly been due to the initiallack ofknowledgeonmanagementpracticesforrearing cross-bred cows. The association currently comprises 40–50 farmers supplying milk on a dailybasis. A Bulk Milk Chilling Unit was set up in2004 in thevillage. Prior to this, there was a daily loss of150 litres on account of improper storage facilities. The association then invested close to Rs 200,000 foracquiring the Bulk Milk ChillingUnit with a storage capacity of 500–800 litres a day. Other capitalPage 27 of 56
investments incurred for the construction of the building <strong>and</strong> office were Rs 650,000. The VDC played akey role in leveraging these funds from different government schemes <strong>and</strong> from the district milkfederation. The net profit for the association has gone up mainly due to an increase in milk prices.Based on the number of cross-bred cows being reared by farmers (per HH) detailed interviews wereconducted <strong>and</strong> a comparison was done of input/output costs between farmers rearing one cross-bred cow<strong>and</strong> those rearing more than two cross-bred cows. As shown in Tables 2A <strong>and</strong> 2B in Annexure 2, theincome stream pre- <strong>and</strong> post-watershed for farmers in this category has shown remarkable improvementbecause the net income from milk sale has gone up, primarily due to the introduction of cross-bred cows.The net income per cow (6% inflation adjusted) has gone up from Rs 327 to Rs. 9,640 per annum, for a1–2 ha l<strong>and</strong>holding farmer whereas for farmers with l<strong>and</strong>holding below one hectare, it has gone up fromRs 800 to Rs 11,502. The drivers for such a prolific rise in net income have been the high yields of milkproduction, doubling of milk prices <strong>and</strong> entry of new income via manure sale. However, there is also asubstantial increase in the amount spent on top feed/fodder for cross-bred cows. Further, the CPRs takenon annual lease jointly with other farmers are now not yielding any income through fodder sale becausethe fodder is now being consumed within the village owing to a larger number of cross-bred cows.The net income per cow is more for a 0–1 ha l<strong>and</strong>holding farmer, who has one cross-bred, as compared toa 1–2 ha l<strong>and</strong>holding farmer, who has four adult <strong>and</strong> one cross-bred calf. Based on this preliminarycomparative analysis, indications are that increasing the number of cows beyond 2 adults <strong>and</strong> one calfwill not increase the net income because it does not result in incremental gains or higher profitability percow. Hence, a marginal farmer rearing one cross-bred appears to have a higher profitability per cow ascompared to a large farmer with a greater number of cross-bred cows.Page 28 of 56
Case Study 4: Mixed <strong>Livestock</strong> <strong>and</strong> Crop Farming, Wanjulshet <strong>Watershed</strong>, Akole Block, DistrictAhmednagarWanjulshet is a remote village located in the Sahyadri ranges of Akole block of Ahmednagar district. Theaverage annual rainfall is 950 mm <strong>and</strong> is largely confined to the monsoon months from June toSeptember. The soils are s<strong>and</strong>y <strong>and</strong> silty loam, with low water-holding capacity <strong>and</strong> diminishingproductivity on account of high soil erosion. The steep slopes, high rainfall, tree felling <strong>and</strong> bush clearinghad resulted in tremendous rainwater run-off increasing soil erosion. Approximately, 531.37 ha of thewatershed is hilly terrain, of which 277.17 ha are arable <strong>and</strong> 254.2 ha are uncultivable wastel<strong>and</strong>. Withregard to CPRs, around 56.07 ha are government forest l<strong>and</strong> <strong>and</strong> 20.35 ha are revenue/common l<strong>and</strong>.Private agricultural l<strong>and</strong> is 454.95 ha. Of 31 wells in the watershed, only 18 were seasonally functional atthe time of project commencement. The average water table in summer was about 0.40 m, <strong>and</strong> in winterit was 2.10 m. The population of the village is mostly tribal (Mahadev Koli) with Scheduled Castescomprising 3% of the population.4003002001000Graph 11: <strong>Livestock</strong> Holding per L<strong>and</strong>holding Category –Pre-watershed in Wanjulshet (FSR 1997)0-1 ha 1-2 ha 2-4 ha 4-8 haSheep Goat BullocksIndigenous Cattle Crossbred Cows BYPBefore the commencement of IGWDP, Wanjulshet was home to 131 HHs. The l<strong>and</strong> holding per HH atthat time was quite high, averaging 3.53 ha per HH. (Source: Feasibility Study Report (FSR) 1997)However, in spite of many HHs owning large l<strong>and</strong>holdings, hardly 2 acres of l<strong>and</strong> per HH was cultivable.Income from agriculture was low; thus, income from livestock rearing was crucial. HHs with smallerl<strong>and</strong>holdings had more livestock of all types compared to HHs with larger l<strong>and</strong>holdings. All HHs rearedBYP irrespective of l<strong>and</strong>holdings, with the number of birds increasing with decreasing l<strong>and</strong>holding.Small ruminants decreased with the increase in l<strong>and</strong>holding (See Graph 11 16 ). The Danghi cattle <strong>and</strong> anon-descript indigenous breed of buffalo were the main livestock breeds raised for milk production. Theincome from livestock was mostly through the sale of milk <strong>and</strong> milk products as a cooperative dairy wasestablished in Akole in the 1960s. Due to this, a few HHs in Wanjulshet were already rearing cross-bredcows much before the WDP began. Milk was sold at Rajur (a nearby town) at Rs 3 per litre. It was justenough for survival but not profitable. Prior to the commencement of the WDP, fodder availability forcattle was a major problem. The forests <strong>and</strong> CPRs were the main sources of fodder. HHs rearing livestockwould also migrate for up to six months each year, in search of fodder, under a system where a group of4–5 men would take all the cattle in the village for migration in turns. During migration, the incomeearned through the sale of milk was sent back to the family. There was no income from the sale ofmanure at that time. Migration for work to other parts of the state, <strong>and</strong> agriculture wage labour to otherareas outside the village were other sources of livelihood.In Wanjulshet, IGWDP was initiated in 1997 <strong>and</strong> completed in 2002. Details of watershed treatmentundertaken are provided in Annexure 3. Since the commencement of watershed development work, thenumber of HHs has increased to 166, with an average per capita l<strong>and</strong>holding of one hectare. The incomefrom agriculture has increased tremendously after the completion of the WDP (refer to Table 1 below).Farmers are now able to take three crops annually due to increase in water availability. From the16 For this graph, data from all HHs has been taken to show the general trend of livestock holding among farmersbelonging to all l<strong>and</strong>holding categories.Page 29 of 56
cultivation of just four crops (rice, millet, groundnut <strong>and</strong> Bengal gram), farmers now produce a variety ofvegetables, pulses, millets, paddy, wheat, etc., throughout the year.Table 8: Impact of <strong>Watershed</strong> <strong>Development</strong> on <strong>Livestock</strong> <strong>and</strong> Fodder(Source WOTR—FSR <strong>and</strong> PCR)Items Pre-watershed (1996) Post-watershed (2002)Cropped area (ha)a) Kharif 268.18 315.05b) Rabi 167.91 163.80c) Summer 19.00 37.50Irrigated area (ha)a) Perennial 19.00 38.00b) Seasonal 10.50 163.80Number of wells 31 36Milk (lit/day) 113 433Fodder production Area (ha) Total Annual Production Area (ha) Total AnnualProductionFrom agricultural cropsKharif 268.18 867.6 315.05 1103Rabi 167.91 60.73 163.8 298From grazing l<strong>and</strong>From forest l<strong>and</strong> - - 56.14 38.04From horti-pasture - - 67 178.89From grass <strong>and</strong>trees237.82 178.37 126.61 406.5Even though WOTR had no specificproject component to promote livestockdevelopment (for example, theintroduction of more productive breeds),the increase in income from agriculture<strong>and</strong> availability of water brought inmany changes. The survey as well asFGD with farmers conducted during thisstudy revealed that the livestockpopulation per HH has decreased withthe increase in l<strong>and</strong>holding, <strong>and</strong> a mixedcrop livestock farming system is nowbeing practised. However, the totallivestock population in the watershedhas increased. This is due to the increasein the number of HHs in the watershed.The rearing of livestock has become akey secondary source of income formany as seen in Table 9 below. 17Table 9 0–1 ha 1–2 ha 2–4 ha 4–8 ha Total %Wanjulshet (pre-watershed)Primary 6 2 0 0 7.60%Secondary 4 8 11 3 25.70%Wanjulshet (post-watershed)Primary 3 1 0 0 3.80%Secondary 4 12 12 9 31.80%17The sample size for Wanjulshet as mentioned in Table 9, Section 4 was 115 HHs <strong>and</strong> comprised HHs whose l<strong>and</strong>category did not change post-watershed.Page 30 of 56
Note: In this table, ‘Primary’ indicates those HHs that were getting constant income from livestock, tosustain their livelihoods with income from other sources assecondary to this. ‘Secondary’ indicates thoseHHs for whom income from livestock is a keyincome source but is not the main source of income. HHsthat kept livestock for farming (for example, bullocks for draft purpose) or forminor supplementaryincome once in a while are not included.Taking into consideration HHs that havenot witnesseda changein thel<strong>and</strong>holding category (the sample for thisstudy), a clear shift from an average herdsize of 10–15 Danghicattle to two low-This major shift is seen with regard tograde Jersey cows per HH is observedfarmers inthe 2–4 ha category (Graph12). Thesee HHs also raise goats primarilyas a source of milk for homeconsumption as well as tomeetemergency<strong>and</strong> immediate creditneeds.The mainsource of fodder is fromgrazing inthe CPRs <strong>and</strong> fallow agricultural l<strong>and</strong>s. Apart from this, agriculture cropresidue, oil cake <strong>and</strong>green fodder is also being fed astop feed for pregnant goats <strong>and</strong> fast weight gain of animals. Greenfodder <strong>and</strong>oil cake arepurchased from the towns of Igatpuri, Ghoti <strong>and</strong>Thane.Graph12: % Increase in Cross-bred Cows with Farmers in Different L<strong>and</strong>holding Categories8 ha <strong>and</strong> above4-8 ha2-4 ha1-2 ha0-1 ha100%0% 500% 1000% 1500% 2000%Graph 13: Percentage Change in<strong>Livestock</strong> Holding inDifferent L<strong>and</strong>holding categories in Wanjulshet50%0%-50%0-1 ha1-2 ha2-4 ha 4-8ha 8 ha <strong>and</strong>above-100%-150%GoatBullocksIndigenous CattleBYPBuffaloPage 31 of 56
Graph 13 18 shows the percentage change in livestock holding among farmers in different l<strong>and</strong>holdingcategories. FGDs <strong>and</strong> specific interviews with farmers belonging to all l<strong>and</strong>holding categories revealedthat the main reason for decrease in livestock per HH was less availability of person power for takingcare of livestock because most families are now nuclear families with smaller l<strong>and</strong>holdings than before.They shared that the ban on grazing in forests was the main reason for a reduction in livestock,particularly cattle. This was further aggravated when CPRs other than forest areas were brought under theIGWDP grazing restriction for five years. However due to tremendous increase in water availability <strong>and</strong>agricultural production post-watershed, they can now rear cross-bred cows. They also added that theclimate is unsuitable for cross-breds <strong>and</strong>, hence, rearing is restricted to low-grade Jersey cows (25%cross) instead of a higher percentage of Jersey or Holstein Friesian. The farmers added that there is nofodder scarcity as in the past since post-harvest agriculture l<strong>and</strong>s, uncultivable agriculture l<strong>and</strong>s <strong>and</strong>CPRs other than forests are available for grazing, together with fodder generated during the kharifseason. Due to this, migration for fodder has stopped completely for those who still rear indigenouscows, in particular. Farmers with goats shared that due to the availability of different kinds of fodder, theanimals gain weight faster <strong>and</strong> disease incidence is also low. As per field observations, factors likedecrease in water availability, signs of over grazing, degradation of environment, etc., were not seen orreported even after several years of completion of the WDP.The study tries to underst<strong>and</strong> the impact of watershed development on livestock-based livelihoods; thechange in farm economics of farmers’ pre- <strong>and</strong> post-watershed development in l<strong>and</strong> holding categories 0–1 <strong>and</strong> 2–4 ha, has therefore been illustrated in Tables 3a <strong>and</strong> 3b in Annexure 2. This is because themaximum change in livestock holding is seen in these categories.18 It is to be noted that field surveys of livestock holding were carried out in the summer season <strong>and</strong>, therefore, thenumber of goats <strong>and</strong> BYP reported are generally much lower than the usual numbers kept.Page 32 of 56
6. Key Lessons <strong>and</strong> Elements for SuccessAs demonstrated in the preceding watershed-specific case studies, there are many external factors thathave led to significant changes in livestock rearing practices <strong>and</strong> not just watershed development. In fact,successful watershed development has resulted in a stronger agricultural base <strong>and</strong> continuous wateravailability, enabling HHs (even those with small <strong>and</strong> marginal l<strong>and</strong>-holdings) to shift to a high-input,high-output livestock production system. The study also indicates that there is now an increasedvariability in livestock production systems within a district <strong>and</strong> documents how livestock supports otherlivelihood occupations.1. The impact of IGWDP on the concept <strong>and</strong> practice of watershed development in India <strong>and</strong> itsexpansion to other states through government <strong>and</strong> NGO programmes is evidence of the sustainability ofthis approach, particularly the adoption of its successful practices, such as CBP <strong>and</strong> Participatory NetPlanning (PNP) in other major programmes being implemented in the country. With the success inMaharashtra, WOTR has now spread this concept to four other states (Andhra Pradesh, Madhya Pradesh,Rajasthan <strong>and</strong> Gujarat). IGWDP has, in fact, provided the ‘blue-print’ for the National <strong>Watershed</strong><strong>Development</strong> Fund, which is carrying the experience <strong>and</strong> learning of over a decade-<strong>and</strong>-a-half to severalstates in the country. It has been widely studied <strong>and</strong> referred to as a prime example of successful publicprivate-civilsociety partnership, involving multi-sectoral interventions <strong>and</strong> extending from the local tothe regional, national <strong>and</strong> international levels. The key to its success has been its developmentphilosophy, a robust partnership amongst key actors, an enabling policy environment, firm political <strong>and</strong>government support on both the Indian <strong>and</strong> German sides, an innovative <strong>and</strong> path-breaking capacitybuilding pedagogy, unique institutional arrangements <strong>and</strong> secure funding. (Lobo, 2001)(See Annexure 4 for policy impacts of IGWDP).Critical to the success of IGWDP was the time investment in capacity building, with a distinct phase <strong>and</strong>institutional agency to implement the CBP. Another key element for success was the issuance of a GRthat facilitated collaboration between line departments <strong>and</strong> the watershed implementing agency. Theselearnings <strong>and</strong> institutional arrangements have however not been taken forward in other KfW-financedWDPs being implemented through NABARD or the rural development departments in other states ofIndia.2. The overall picture: Changes in livestock preference <strong>and</strong> production systems primarilydepended on the increased availability of water for agriculture <strong>and</strong> livestock rearing; climatic conditions;improved access to agriculture markets <strong>and</strong> dairy cooperatives; <strong>and</strong> price fluctuations of agriculturalproduce. A general reduction in livestock numbers per HH for all livestock species is observed but thereis an overall increase in livestock population in the watershed. This is mainly due to an increase in thenumber of HHs in the watershed village because many joint families have split into nuclear families overthis 15-year period. This change has also resulted in reduction in person power to manage livestock aswell as l<strong>and</strong>holdings per HH. Both factors have had a major impact on livestock numbers/change inspecies at the HH level. In addition to this, restricted grazing in forest areas, increase in agriculture workload,as a result of more l<strong>and</strong> being brought under cultivation, shift to cash crop cultivation <strong>and</strong> improvedaccess/availability of water have also impacted livestock rearing at the HH level. As incomes improved,HHs invested in better education, which resulted in increased migration of youth to cities for betterjobs. 19 A limited number of ‘work-h<strong>and</strong>s’ at the HH level also impacted livestock numbers, resulting in areduction in livestock at the HH level.As informed by communities, the main reason for rearing indigenous cattle earlier was to earn incomefrom the sale of farm animals rather than the sale of milk. The lack of access to grazing resources,particularly forests, followed by the ban on grazing in treated areas under IGWDP were stated as the keyreasons for reduction in the rearing of indigenous cattle. This has, over time, led to a severe shortage ofbullocks for ploughing agricultural l<strong>and</strong>s, <strong>and</strong> a significant increase in the price of a pair of bullocks,making this an unaffordable <strong>and</strong> unmanageable asset for small <strong>and</strong> marginal farmers. This change hashad a negative impact on agriculture. Currently, even though adequate fodder is available from the19 With an increase in income <strong>and</strong> access to better education, youth aspire for higher paying jobs in towns <strong>and</strong> cities.Page 33 of 56
egenerated commons, farmers have not increased the number of animals, especially of goats <strong>and</strong>indigenous cattle. The priority has now shifted to agriculture further reducing the person power requiredfor grazing animals at the HH level.3. Investment, protection <strong>and</strong> management of CPRs is critical for livelihood sustainability: Inthe context of securing crop-livestock-based livelihoods, the technical principle of treating a watershedfrom ridge to valley, thereby undertaking required soil <strong>and</strong> moisture conservation works on all types ofl<strong>and</strong> <strong>and</strong> not only agricultural l<strong>and</strong>s, or l<strong>and</strong>s below the ridge proved highly beneficial. Annexure 3provides details of treatment carried outin all four watersheds. Treating moreCPR l<strong>and</strong>s, together with the strategy ofenclosing the high-potential rechargezones continuously for five years (stillbeing protected in some watersheds)has proved highly rewarding. This isevident from the fact that even after 15years <strong>and</strong> three major droughts duringthis period, the watersheds are still ableto provide continuous environmentalservices <strong>and</strong> support the water intensivecrop-livestock production systemsdespite being a drought-prone zone (seeFigure 5). 20 In addition, temporaryclosure allows the flora of the region toreach flowering <strong>and</strong> seed dispersal stage<strong>and</strong> facilitates regeneration in other parts of the watershed thereby maintaining productivity of thewatershed l<strong>and</strong>scape. Hence, it can be concluded that enclosed protection of the high-potential rechargezones in the watershed ensures sustainability <strong>and</strong> continued environmental services offered by thewatershed. It can also support extensive livestock production systems as only a small part of thewatershed is protected at a time whereas the rest is available for grazing.4. Changing livestock production systems <strong>and</strong> vulnerability in rain-fed areas: External drivers,improved access to markets <strong>and</strong> increase in water availability for extended parts of the year have led tofarmers adopting water-intensive, crop-livestock production systems. The study shows, that until now, onaccount of the impact of IGWDP, the ecosystem is still able to provide adequate water resourcessupporting the shift to intensive production systems. The key question, however, is how long can the ecosystemcontinue to sustain these water-intensive, livelihood strategies?In three watersheds, except for M<strong>and</strong>wa, changes in livestock composition <strong>and</strong> rearing systems contributetowards much higher incomes than earlier; on the flip side, however, one can conclude that thevulnerability of both communities <strong>and</strong> the surrounding ecosystems has increased. Vulnerable groups areidentified as l<strong>and</strong>less, small <strong>and</strong> marginal farmers <strong>and</strong> women, the elderly <strong>and</strong> children in particular. Thereasons for increased vulnerability are:a) Increased dependence on high-grade, cross-bred cows, which is a water-intensive livestockproductionsystem.b) Significant reduction in the rearing of small livestock that can act as a buffer in times ofdistressc) Loss of multiple advantages provided by indigenous cattle (manure, bullock power, etc.)d) Loss of financial <strong>and</strong> nutritional security for women <strong>and</strong> children due to a reduction in smalllivestock- BYP <strong>and</strong> goats in particular.e) Absence of any norms <strong>and</strong> regulation for excessive use <strong>and</strong> extraction of water.The availability of CPRs <strong>and</strong> the continued practice of traditional livestock rearing systems, maintaininglow-grade cross-breds <strong>and</strong> goat farming, make the farmers of M<strong>and</strong>wa less vulnerable than the rest.20Except for the M<strong>and</strong>wa watershed, the other three watersheds under study are located in the red zone whichcomprises the drought-prone regions of the state.Page 34 of 56
Hence, it is essential to integrate extensive production systems, to reduce the vulnerability of bothcommunities <strong>and</strong> the watershed (systems suitable to the agro-ecological zone) <strong>and</strong> focus on sustainabilityrather than a sole focus on higher economic returns. In addition, water budgeting <strong>and</strong> regulation of wateruse is a critical requirement in post-project WDPs to support water- intensive <strong>and</strong> high-value, croplivestockproduction systems in a sustainable way.5. Multi-stakeholder platforms help in managing resources equitably <strong>and</strong> in a sustainableway: With high input costs in terms of feed, fodder <strong>and</strong> medical care, it is often difficult for small <strong>and</strong>marginal farmers to raise <strong>and</strong> maintain high-grade cross-breds. However, as demonstrated in theMhasw<strong>and</strong>i watershed, even small farmers in the 0–1 ha l<strong>and</strong>holding category are able to rear high-gradecross-bred cows <strong>and</strong> earn a substantial income. This is largely on account of the community led CPRleasing system. Bringing different village-level institutions to work together (Wasundhara Approach 21 ) isanother key element of the programme that not only assured post project continuity but helpedcommunities develop their own unique livelihood system.Whereas the complete enclosure of over 500 ha of forest l<strong>and</strong> <strong>and</strong> extracting fodder only through the cut<strong>and</strong>-carrysystem has a positive impact on controlling soil erosion, a view that is gaining ground in recentyears is that a complete ban on livestock grazing adversely affects grass bio-diversity <strong>and</strong> ultimately soilhealth. 22 A cut-<strong>and</strong>-carry system is also more labour-intensive <strong>and</strong> does not support small ruminant orindigenous cattle-based livelihoods. Therefore, a mix of both grazing <strong>and</strong> the cut-<strong>and</strong>-carry system isessential so that the watershed can continue to provide equitable environmental services.6. Traditional livestock systems can help manage watersheds better: The case of M<strong>and</strong>wa alsodemonstrates effective watershed management, without compromising in terms of reducing livestocknumbers or banning grazing completely to maintain the green cover. The traditional system of jointlyemploying a grazer/village herder called the charaiya, which has completely disappeared in other places,has been effective in maintaining the productivity of the watershed <strong>and</strong> also in controlling over-grazing<strong>and</strong> livestock numbers since only 2–3 people are responsible for grazing the entire livestock of thevillage. This has also become a good livelihood source for l<strong>and</strong>less people/ youth in the villages.The charaiya system also provides an opportunity for implementing agencies to develop specializedtraining, management <strong>and</strong> service delivery plans not only for NRM but also for animal health-careservices <strong>and</strong> breed conservation <strong>and</strong> development, contributing to a more robust system. This case alsodemonstrates the importance of CPRs for grazing <strong>and</strong> how ecologically suitable livestock productionsystems can co-exist with effective management of common l<strong>and</strong>s.7. In spite of the considerable focus on conflict resolution, shepherd communities in watershedareas were, in the short term, adversely affected by the ban on grazing on common l<strong>and</strong>s. In Darewadi,this was resolved by treating the area in a phased manner <strong>and</strong> by enforcing the grazing ban only in areasthat were treated. This helped achieve both objectives of CPR regeneration <strong>and</strong> meeting the fodder needsof the shepherd community. However, there is also recognition of the inability of the shepherdcommunity to negotiate better terms on account of being smaller in number. In the other two cases,Mhasw<strong>and</strong>i <strong>and</strong> Wanjulshet, communities with small ruminants willingly reduced their flock size <strong>and</strong>adhered to the grazing ban in the expectation of receiving benefits of water, which was perceived as amuch greater need. In M<strong>and</strong>wa, due to the availability of CPRs in adjoining areas of the watershed, no21 Constant reflection on the part of WOTR throughout IGWDP with the objective of improving project impact <strong>and</strong>reach culminated in the Wasundhara Approach. It was initiated in 2005 <strong>and</strong> attempted to strengthen localparticipation <strong>and</strong> address equity issues. The approach aims to build community capacity to dem<strong>and</strong> positive change<strong>and</strong> improved conditions. Here, participants are not treated as beneficiaries/recipients, but as protagonists of theirown development. As the wealth ranking <strong>and</strong> village envisioning exercises are done by the villagers themselves, itresulted in strengthening the involvement of poor HHs <strong>and</strong> identifying their priority needs more effectively.22 http://www.feedingtheheadlines.com/2011/07/22/greener-pastures-how-cows-could-help-in-the-fight-againstclimate-change/.In the watersheds visited, small ruminant rearers reported that enclosing the area <strong>and</strong> adoption ofthe cut-<strong>and</strong>-carry system has definitely increased biomass production but there is decrease in the speciescomposition in the area. This is being studied further by WOTR through the preparation of people’s biodiversityregisters <strong>and</strong> other support studies in select Climate Change Adaptation project villages.Page 35 of 56
compromise was made by the communities <strong>and</strong>, in fact, they were not only able to treat the whole areabut were also successful in keeping the high potential zones enclosed.The key finding is that the livelihoods of livestock-dependent communities, particularly those dependenton common l<strong>and</strong>s, can be secured; with CPRs being simultaneously regenerated <strong>and</strong> revived underWDPs with the development of alternative sites, a phased treatment plan <strong>and</strong> the protection <strong>and</strong>management of high potential recharge zones.7. <strong>Livestock</strong> is still a key source of income: There is a clear shift to rearing cross-bred cows, <strong>and</strong>in some villages there is a shift from cross-bred cows to the rearing of indigenous buffaloes becauseregular income from milk is perceived as economic security. This is more prominent in watersheds whereexternal factors such as assured water <strong>and</strong> fodder availability, market access <strong>and</strong> roads, <strong>and</strong> the presenceof dairy cooperatives are in place. However, the 15-year time frame demonstrates the trend of a suddenincrease in cross-bred cows immediately after the WDP, following which there is drop in animal numbers<strong>and</strong>, thereafter, stabilization at a certain level. (Seen in Mhasw<strong>and</strong>i, Darewadi <strong>and</strong> Wanjulshet. Source:WOTR database) The sudden drop was primarily on account of a lack of expertise in managing crossbredcows, including feeding capacity, fertility problems <strong>and</strong> heat stress issues, resulting in high diseaseincidence, <strong>and</strong> often death/sale of the animals. Stabilization of numbers resulted from those who wereable to successfully raise <strong>and</strong> build their cross-bred stock, maintaining numbers. The only exception tothis trend is the Mhasw<strong>and</strong>i watershed, where even farmers falling in the 0–1 ha category successfullyrear cross-bred cows. (See Case Study 3, for further details.)Whereas the shift to cross-bred cows has increased incomes through milk production, it has led to adecline in the availability of bullocks <strong>and</strong> farm-yard manure. A pair of bullocks in these areas now costsbetween Rs 50,000 <strong>and</strong> Rs 70,000, as compared to the price of Rs 10–15,000 in 2000.Goat farming in the M<strong>and</strong>wa watershed has emerged as a key support system to input intensive cashcropping whereas, in Mhasw<strong>and</strong>i, it is cross-bred cows. <strong>Livestock</strong> rearing, in most cases, has moved frombeing the primary source of income to a secondary, yet key source of income.Need for a special programme for BYP: The interest in rearing BYP is still found among tribal HHs butnot with other communities, post watershed development. The increase in agricultural production 23 wasthe main reason stated by communities forreducing the rearing of birds. The absenceof sustained programmes on promotingBYP is proving counter-productive to thenutritional <strong>and</strong> financial security of poorHHs. There is a lack of underst<strong>and</strong>ing onthe value of BYP <strong>and</strong> the benefits itprovides to poor HHs, being a zero-to-lowinput production system, with a significantcontribution to income <strong>and</strong> food security.The focus of the local animal husb<strong>and</strong>rydepartment is on promoting small-scalecommercial poultry or the distribution ofimproved <strong>and</strong> exotic birds.During discussions, many women <strong>and</strong> HHs with small l<strong>and</strong>holdings <strong>and</strong> whose homes are located at adistance from agricultural fields expressed a keen interest to keep more birds. There are, however, noprogrammes/schemes that support basic requirements such as the provision of night shelters <strong>and</strong>preventive health care. The theft of poultry is also a major problem. Hence, there is a strong need tolobby for a separate programme for BYP because the dem<strong>and</strong> for BYP (for both meat <strong>and</strong> eggs) hasincreased <strong>and</strong> traditional marketing systems are already in place. The price of meat, eggs <strong>and</strong> live birds(Rs 450 per kg; Rs 4 to Rs 8 per egg, <strong>and</strong> Rs 250 to Rs 500, respectively) is much higher than meat <strong>and</strong>23Scavenging poultry are viewed as pests as they tend to eat seeds <strong>and</strong> seedlings in the fields.Page 36 of 56
eggs from commercial <strong>and</strong> improved poultry (Rs 120 per kg; Rs 1.50 to Rs 3 per egg, <strong>and</strong> there is nodem<strong>and</strong> for live birds).Small ruminant rearing: With regard to goats, it is difficult to conclude that there is a reduction in thenumber of animals per HH, even though data collection at three points of time shows a decreasing trendexcept in the case of the M<strong>and</strong>wa watershed. This is because during the study period, high fluctuationswere observed in goat populations at the HH level, as per needs/risks that the HH faced as also marketdem<strong>and</strong> (increasing during Bakr Id <strong>and</strong> tribal festivals in March each year). Continuous data collectionover a period of time is required to draw proper conclusions in this regard.In the case of sheep, the herd size has reduced, primarily on account of the shift from joint to nuclearfamilies, <strong>and</strong> the adoption of settled agriculture <strong>and</strong> apparently not on account of a reduction of CPRs orthe ban on grazing enforced by the watershed programme in high recharge zones. Despite inflation, theprice of sheep meat has increased; returns, therefore, are high in spite of a reduction in the flock size.(See Case Study 1 <strong>and</strong> Table 1 in Annexure 2 for the economics of sheep rearing pre- <strong>and</strong> post-watershedfor more details.)8. Increase in milk production is not contributing to HH nutrition: It was clearly evident thatthe intake of animal products by HHs has decreased even though milk production has increased. This isbecause the milk of cross-bred cows is not preferred <strong>and</strong> is produced primarily for sale. However, goatmilk is used if indigenous cows are not kept. Second, due to high dem<strong>and</strong> for liquid milk, the sale of milkbased products such as curd <strong>and</strong> ghee has stopped completely. The availability of readymade products insmall towns has further reduced the market for homemade milk products.To summarize, watershed development has immense scope to secure livestock-based livelihoods as wellas the natural resource base. This is possible, provided key elements such as securing availability <strong>and</strong>access to CPRs; investments in CPR regeneration with ridge (largely comprising forest l<strong>and</strong>s)-to-valleyapproach; integration of grazing-based livestock systems <strong>and</strong> water budgeting in watershed planning;protection of ‘high potential recharge zones’; <strong>and</strong> utilizing traditional livestock systems to managewatersheds post-project are in place.Page 37 of 56
AbbreviationsBMZ German Ministry for Economic Co-operationBYP Backyard PoultryCBP Capacity Building PhaseCPRs Common Property ResourcesCRIDA Central Research Institute for Dry-l<strong>and</strong> AgricultureCRTDP Comprehensive Rural <strong>and</strong> Trial <strong>Development</strong> ProjectFIPFull Implementation PhaseFPC Forest Protection CommitteeFPR Flood Prone RiversFSR Feasibility Study ReportGPGram PanchayatGRGovernment ResolutionGTGrassl<strong>and</strong> <strong>and</strong> TreesGTZ German Agency for Technical Co-operationHHs HouseholdsICRISAT International Crops Research Institute for the Semi-Arid TropicsIGWDP Indo German <strong>Watershed</strong> <strong>Development</strong> ProgrammeKfW Kreditanstalt fŸr WiederaufbauMoRD Ministry of Rural <strong>Development</strong>NABARD National Bank for Agriculture <strong>and</strong> Rural <strong>Development</strong>NGO Non Government OrganisationNRM Natural Resources ManagementNWDPRA National <strong>Watershed</strong> <strong>Development</strong> Programme for Rain-fed AreasPNP Participatory Net PlanningPOP Participatory Operational PedagogyRVP River Valley ProjectsSA PPLPP South Asia Pro Poor <strong>Livestock</strong> Policy ProgrammeSHG Self Help GroupVDC Village <strong>Development</strong> CommitteeVWC Village <strong>Watershed</strong> CommitteeWDP <strong>Watershed</strong> <strong>Development</strong> ProgrammeWOTR <strong>Watershed</strong> Organisation TrustPage 38 of 56
ReferencesBendapudi, Ramkumar, Bekele Shiferaw, S.P. Wani, G.D. Nageswara Rao <strong>and</strong> T.K. Sreedevi. 2007.“Socio-economic profiles, production <strong>and</strong> resource use patterns in selected semi-arid Indian watershedvillages. Global Theme on Agro-ecosystems.” Report No. 34. Andhra Pradesh, India: International CropsResearch Institute for the Semi-Arid Tropics. 90 pp.Depender Kapur, Divya Ravindranath, Purnendu Kavoori, Rahul Chaturvedi, S<strong>and</strong>eep Kuchipudi - ACommons Story—In the Rain Shadow of the Green Revolution (FES,2010).Farrington, J, Lobo, C, 1997- “Scaling up participatory watershed development in India: Lessons fromthe Indo-German <strong>Watershed</strong> <strong>Development</strong> Programme.” Natural Resource Perspectives Discussion Paper17, Overseas <strong>Development</strong> Institute, London.From Hariyali to Neeranchal, Report of the Technical Committee on <strong>Watershed</strong> Programmes in India,Department of L<strong>and</strong> Resources, Ministry of Rural <strong>Development</strong>, Government of India (January, 2006).http://www.feedingtheheadlines.com/2011/07/22/greener-pastures-how-cows-could-help-in-the-fightagainst-climate-change/.Kerr, J., G. Pangare <strong>and</strong> V.L. Pangare. 2002 . “<strong>Watershed</strong> development projects in India: An Evaluation.”Research Report 127, IFPRI, Washington DC.Lobo, C. “Indo-German <strong>Watershed</strong> <strong>Development</strong> Programme: Macro-management for Microcooperation.”Paper presented at the DSE/ATSAF Workshop, Strategies for inter-sectoral watermanagement in developing countries: Challenges <strong>and</strong> consequences for agriculture, 6–10 May 1996,Berlin, Germany.NABARD. 1995. Guidelines on participation in Indo-German <strong>Watershed</strong> <strong>Development</strong> Programme,Mumbai, India.Pangare, G. <strong>and</strong> S. Gondhalekar. April 1998. “Evolution of the watershed development programme inMaharashtra: A Holistic View.” Department of Wastel<strong>and</strong>s <strong>Development</strong>, New Delhi.Springate-Baginski O., R.V. Reddy, G.M. Reddy <strong>and</strong> S. Galab. 2002. “<strong>Watershed</strong> development in AndhraPradesh: A policy review.” Working Paper 5. London, UK: Department for International <strong>Development</strong>.WOTR Voices - Experiences from Grassroots of Mhasw<strong>and</strong>i, M<strong>and</strong>wa <strong>and</strong> Darewadi (2005 to 2007)www.wotr.org Feasibility study <strong>and</strong> project completion reports of watersheds. Internal base line surveydata base <strong>and</strong> WOTRVijay Shankar, P.S: http://www.india-seminar.com/2006/564/564_p_s_vijay_shankar.htmPage 39 of 56
Annexure 1aGovernment of Maharashtra Resolution Regarding Political <strong>and</strong> Administrative Approval forIGWDPGR of 27 August 1992: IGWDP through NGOs in Maharashtra.This was a key GR issued by the Department of Water Conservation, with the concurrence of two otherDepartments, that is, Agriculture <strong>and</strong> Forests, which laid the basis for the programme in Maharashtra.Without this order, it would not have been possible to work on such a large scale in the area of watersheddevelopment in Maharashtra. This order, therefore, constitutes an approval by the state government ofIGWDP.GOVERNMENT OF MAHARASHTRARural <strong>Development</strong> & Water Conservation DepartmentResolution No. IGP-1091/ 43015/CR-36/JAL-7Mantralaya, Bombay 400 032Date: 27th August 1992R E A D : i) Letter No. NB.OPD.FS/2949/RF(KFW)/1991-92, dated the 19th December, 1991 fromDeputy Manager, NABARD, Bombay.ii) Government Endorsement, Agriculture, Animal Husb<strong>and</strong>ry, Dairy <strong>Development</strong> No.IGP-1091/1556/CR-35/6-A, dated the 15th January 1992iii) Letter No. NB.DPD.FS/1403/RFKFW/92-93, dated the 31st July 1992 from DeputyManager, NABARD, Bombay.PREAMBLE: Having regard to the NGO activity in the field of <strong>Watershed</strong> <strong>Development</strong> in Maharashtra,negotiations on bilateral assistance between the Government of Germany <strong>and</strong> the Government of Indiawere under process in the past. Now, the German Government has agreed to provide through theKreditanstalt Fuer Weideraufbau (KfW) financial assistance of DM 12 million, i.e., Rs 174.09 M (E.R.DM-1 = Rs. 14.5) for the development of watershed projects by the NGOs in Maharashtra. NationalBank for Agriculture <strong>and</strong> Rural <strong>Development</strong> (NABARD), in consultation with Government of India,agreed to help in the preparation of the project proposals <strong>and</strong> implementation of the projects. Germanassistance may be in the form of grant for the programme. The fund will flow from the KfW directly tothe National Bank, i.e., NABARD, as per arrangements laid down by the Ministry of Finance,Government of India. NABARD shall institute similar measures for financing individual projects. On thebasis of projects sanctioned, the phasing indicated in the project document <strong>and</strong> satisfactory workcompletion the National Bank will release the funds for direct project implementation (labour <strong>and</strong>material cost) through the local bank to a joint account of the Village <strong>Watershed</strong> Committee <strong>and</strong> the NGOconcerned. Further, other than routing of funds, the National Bank shall seek to involve the local bankerin financing the credit needs of the watershed community. Overhead cost of the NGO will be paiddirectly to the NGO.This programme <strong>and</strong> the individual projects aim at integrated <strong>and</strong> comprehensive development of microwatershed. Inter-alia each individual project would comprise soil <strong>and</strong> water conservation treatments ofnon-arable l<strong>and</strong>, arable l<strong>and</strong>s <strong>and</strong> drainage lines within the micro watershed.The treatments to be undertaken will be decided on the basis of due investigation of the resource potentialof the area <strong>and</strong> preparation of a project feasibility study report in accordance with the terms of referencespecified by the KfW <strong>and</strong> full participation of, <strong>and</strong> consultation with the watershed community. Inter-aliafollowing treatments would be included e.g. Bunding <strong>and</strong> vegetative hedges, afforestation, developmentof grassl<strong>and</strong>s with trees <strong>and</strong> shrubs, fuel wood plantations, alley cropping, check structures in upperreaches of drainage courses, bank protection for drainage lines <strong>and</strong> run-off management. Each individualPage 40 of 56
micro-watershed project is likely to be implemented in a passed manner over a period of five years.Considering that the first three-four years will be the induction phase where promotional work amongNGOs <strong>and</strong> in villages will be undertaken <strong>and</strong> new NGOs <strong>and</strong> villages may join the programme, theprogramme will have a nine year phasing. The Project Sanctioning Committee <strong>and</strong> the National Bankwill provide necessary policy decision <strong>and</strong> guidance to the NGOs subject to the Terms of Referencespecified by the KFW. Project planning <strong>and</strong> implementation will be undertaken by the NGO with theinvolvement of the watershed community through its representative body viz. the Village <strong>Watershed</strong>Committee (VWC). The NGO <strong>and</strong> the VWC may draw upon the services of other technical supportorganisations when required. Monitoring <strong>and</strong> evaluation of this programme will be done by the NationalBank.RESOLUTION: National Bank for Agriculture <strong>and</strong> Rural <strong>Development</strong> has sought Government'sapproval for implementation of this programme <strong>and</strong> necessary support <strong>and</strong> guidance from the concerneddepartment of the Government. Since the entire funding for the programme is being provided for underGerman assistance, no financial support is required from the Government. However, for successfulimplementation of this project Government's approval <strong>and</strong> support are essential. In view of this,Government is now pleased to accord approval for implementation of Indo-German <strong>Watershed</strong><strong>Development</strong> Programme through NGOs in Maharashtra with active involvement of NABARD. Anadvisory <strong>and</strong> supportive role of different departments of the Government at different stages forimplementation on of this programme will be as follows:i) Project Preparation: Concerned local officers of the Water Conservation, Revenue, Agriculture,Forests <strong>and</strong> Rural <strong>Development</strong>, GSDA should provide necessary data <strong>and</strong> guidance for projectpreparation.ii) Project Sanctioning: Secretaries of the Department of Agriculture, Water Conservation <strong>and</strong> Forestsare nominated as members on Project Sanctioning Committee set up by the National Bank.iii) Project Implementation: Concerned local officers of the above referred departments should providenecessary guidance to concerned NGO, etc. in overall project implementation <strong>and</strong> in relation tospecific technical problems, if any. However, the concerned NGO or the Village <strong>Watershed</strong>Committee should make specific request in writing the concerned Government officers in this regard.iv) Training: A few seats in the Soil Conservation Training Institute may be allotted for NGO personnel<strong>and</strong> the watershed community representatives likely to participate in the programme.v) As regards deputation of skilled technical personnel for the execution of the programme Governmentmay consider to depute skilled technical personnel, where such manpower supports is essentiallyrequired for any specific project, provided concerned NGO <strong>and</strong> the VWC should submit a formalrequest to the Government <strong>and</strong> the request to recommended by the Project Sanctioning Committee.vi) As regards treatment of forest l<strong>and</strong>s in the micro-watershed under Indo-German Project, Governmentis pleased to direct that treatments of forest l<strong>and</strong> should be undertaken within the framework of theNational Forest Policy <strong>and</strong> the State's Policy under the overall guidance <strong>and</strong> superintendence of theForest Department. Planning of such treatments should be in consultation with the ForestDepartment. The material <strong>and</strong> labour component should be provided for by the VWC <strong>and</strong> theconcerned NGO out of the project funds <strong>and</strong> no financial grants are provided for by the ForestDepartment. For undertaking the treatments of forest l<strong>and</strong>, Forest Department would coordinate itsactivities with the implementation phasing of the projects.Further, in recognition of the involvement of the watershed community in the programme <strong>and</strong> thecommunity’s commitment to maintain <strong>and</strong> look after the treatments including forest plantation, throughmeasures such as social fencing <strong>and</strong> voluntary ban on tree falling, Government <strong>and</strong> Forest Departmentwill consider granting usufructory rights on forest produce from the project area to the watershedcommunity in accordance with the State Government’s current policy.Page 41 of 56
Government is also pleased to permit to undertake necessary treatments of all non-private l<strong>and</strong>s by theVWC & NGO under Indo-German <strong>Watershed</strong> project.Necessary Quarterly/Six monthly progress reports in prescribed proforma should be sent by the NationalBank to the Government of India with a copy to Government.This Government Resolution is issued with the concurrence of Planning, Revenue <strong>and</strong> Forest, Agriculture<strong>and</strong> Rural <strong>Development</strong> Department.By order <strong>and</strong> in the name of theGovernor of Maharashtra,sd/-(Ashok Basak)Secretary to Government of MaharashtraRural <strong>Development</strong> <strong>and</strong> Water ConservationDepartmentTo,The General Manager, National Bank for Agriculture <strong>and</strong> Rural <strong>Development</strong>, Sterling Centre, ShivsagarEstate, Dr. Annie Besant Road, Worli, Bombay–18. (By letter)The Co-ordinator, Indo-German <strong>Watershed</strong> <strong>Development</strong> Programme, c/o Social Centre, Market YardRoad, Ahmednagar–414 001. (By letter)The Secretary to the Government of India, Ministry of Finance, Department of Agriculture <strong>and</strong>cooperation, Krishi Bhavan, New Delhi. (By letter)The Deputy Secretary to Government of India, Ministry of Finance, Department of Economic Affairs,New Delhi. (By letter)The Assistant Commissioners (SC), Government of India, Ministry of Agriculture, Department ofAgriculture <strong>and</strong> Cooperation, Krishi Bhavan, New Delhi. (By letter)The Chief Secretary to the Government of MaharashtraAll Divisional CommissionersAll CollectorsThe Director, Soil Conservation <strong>and</strong> <strong>Watershed</strong> Management, Maharashtra State, PuneThe Director of Agriculture, Maharashtra State, PuneThe Director of Horticulture, Maharashtra State, PuneThe Director, Social Forestry, Maharashtra State, PuneThe Director, G.S.D.A., PuneThe Principal Chief Conservator of Forests, Maharashtra State, NagpurAll Superintending Agricultural OfficersAll Principal Agricultural OfficersAll Chief Executive Officers, Zilla ParishadsAll Divisional Soil Conservation OfficersAll District Deputy Directors of Social ForestryAll Divisional Forest OfficersAll District Conservators of ForestsThe Secretary, Planning Department, Mantralaya Bombay–32The Secretary, Revenue <strong>and</strong> Forests Department, Mantralaya, Bombay–32The Secretary, Rural <strong>Development</strong> Department, Mantralaya, Bombay–32The Secretary, Forest Department, Mantralaya, Bombay–32The Secretary, Agriculture Department, Mantralaya, Bombay–32Under Secretary, (Jal-11) Water Conservation Department, Mantralaya, Bombay–32All Vice Chancellors of Agriculture Universities. Select file. (JAL-7)Page 42 of 56
Annexure 1bGovernment of Maharashtra Resolution on Extension of All Facilities <strong>and</strong> Benefits to the CapacityBuilding Phase under IGWDPGovernment of MaharashtraRural <strong>Development</strong> <strong>and</strong> Water Conservation DepartmentGovernment Resolution No. IGP-1097/CR-111/Jal-8Mantralaya, Mumbai 400 032Dated: 6th December 1997Read: 1. Government Resolution, Rural <strong>Development</strong> <strong>and</strong> Water Conservation Department No. IGP-1091/43015/CR-36/Jal-7 dated 27th August, 1992.2. Government Resolution, Rural <strong>Development</strong> <strong>and</strong> Water Conservation Department No. IGP-1091/43015/CR-36/Jal-7 dated 10th July 1996.3. Revenue <strong>and</strong> Forest Department's letter No. FDM 1092/CR75/R-8 dated 11th July, 19944. Revenue <strong>and</strong> Forest Department's letter No. FDM 1092/CR 75/R-8 dated 22nd January, 1996.5. The Managing Trustee (WOTR)'s letter No. WOTR/GOM/cil/97/906 dated 24th July, 1997.Preamble: Indo-German <strong>Watershed</strong> <strong>Development</strong> Project is being implemented in the state ofMaharashtra. This project has been supported by Government of Maharashtra vide Governmentresolution dated 27th August, 1992 referred to above by this Department <strong>and</strong> also supported by theRevenue <strong>and</strong> Forest Department vide letters indicated above. The Indo-German <strong>Watershed</strong> <strong>Development</strong>Project is being implemented in Maharashtra to develop <strong>and</strong> sustain the economy of village community,using watershed approach with emphasis on self-help, environment protection, <strong>and</strong> poverty alleviation.The Government of Maharashtra has extended full cooperation for the implementation of thisprogramme. The Coordinator, <strong>Watershed</strong> Organisation Trust (WOTR) Ahmednagar has requestedGovernment of Maharashtra vide his letter dated 24th July 1997 to extend the facilities <strong>and</strong> benefitsalready given under Government Resolutions referred to above to the Capacity Building Phase of theIndo-German <strong>Watershed</strong> <strong>Development</strong> Programme (IGWDP) being implemented by <strong>Watershed</strong>Organisation Trust (WOTR).Resolution: In view of the position explained in preamble, Government is pleased to accord approval toextend the facilities <strong>and</strong> benefits given under Government Resolutions referred to above to the CapacityBuilding Phase for efficient implementation of the Indo-German <strong>Watershed</strong> <strong>Development</strong> Programme inconsultation with the Government in Water Conservation Department.By order in the name of the Governor of Maharashtra(B.S. Desai)Deputy Secretary to the Government of MaharashtraRural <strong>Development</strong> <strong>and</strong> Water Conservation DepartmentPage 43 of 56
Annexure 1cGovernment of Maharashtra Resolution Regarding the Implementation of JFM in IGWDPGOVERNMENT OF MAHARASHTRARural <strong>Development</strong> <strong>and</strong> Water Conservation DepartmentG.R.NO.IJP - 1091/43015/CR-36/Jal-7Mantralaya, Mumbai - 400 032Dated the 10th July 1996Read: Government Resolution No.IGP-1091/43015/CR-36/Jal-7, dated the 27th August, 1992.RESOLUTION1. Implementation of Indo-German <strong>Watershed</strong> <strong>Development</strong> Programme through NGOs in Maharashtrawas approved by the Government vide G.R. dated the 27th August 1992 referred to above <strong>and</strong>accordingly, the treatment of forests l<strong>and</strong> in the Micro-watershed is envisaged to be undertakenwithin the framework of National Forest Policy <strong>and</strong> the Policy of the State Government under theoverall guidance <strong>and</strong> superintendance of Forest Department. Funds are being released by theNABARD directly through the local Bank to a joint account of village <strong>Watershed</strong> Committee <strong>and</strong> theNGO concerned.2. Presently, NGOs, could be involved in joint forest management only as catalysts <strong>and</strong> they could notbe allowed to actually implement <strong>Watershed</strong> <strong>Development</strong> Programme in forest areas. Governmentis, therefore, pleased to sanction implementation of Indo-German <strong>Watershed</strong> <strong>Development</strong>Programme forest areas through the Forest Protection Committee within the ambit of Revenue <strong>and</strong>Forest Department G.R. No. SLF-1091/P/K/119191/P/11, dated 16 March 1992.3. The programme will be implemented in forest areas by Forest Protection Committee as per thewatershed projects approved by project sanctioning committee. The requisite funds for this purposewill be provided from the joint account of NGO/VWC to the account of Forest ProtectionCommittee. For this purpose, an account shall be opened in a nationalised Bank to be operated jointlyby the Chairman <strong>and</strong> Member Secretary (Forest) of Forest Protection Committee. The ForestProtection Committee shall provide details of accounts physical <strong>and</strong> financial progress reports, etc.,to VWC/NGO as per requirement of the latter. In exceptional cases, where Forest ProtectionCommittees could not be formed due to non-availability of adequate <strong>and</strong> suitable forest areas or anyother reason, the Forest Department may implement the approved programme directly. Funds for thispurpose shall be provided by VWC/NGO to the Deputy Conservator of Forests who shall open asavings accounts in a nationalised bank for this purpose <strong>and</strong> maintain a separate accounts.4. This G.R. issues with the concurrence of Revenue & Forest Department.By order <strong>and</strong> in the name of Governor of Maharashtra,sd/-(B.S. Desai)Deputy Secretary of Govt. of MaharashtraTo,The General Manager, National Bank for Agriculture <strong>and</strong> Rural <strong>Development</strong>, Sterling Centre, ShivsagarEstate, Dr. Annie Besant Road, Worli, Bombay–18 (By letter)The Co-ordinator, Indo-German <strong>Watershed</strong> <strong>Development</strong> Programme, C/o, Social Centre, Market YardRoad, Ahmednagar–414 001. (By Letter)The Secretary to the Government of India, Ministry of Agriculture, Department of Agriculture <strong>and</strong>Cooperation, Krishi Bhavan, New Delhi. (By letter)The Deputy Secretary to Government of India, Ministry of Finance, Department of Economic Affairs,New Delhi. (By letter)Page 44 of 56
The Assistant Commissioners (SC), Government of India, Ministry of Agriculture, Department ofAgriculture <strong>and</strong> Cooperation, Krishi Bhavan, New Delhi. (By letter)The Chief Secretary to the Government of Maharashtra.All Divisional CommissionersAll CollectorsThe Director, Soil Conservation <strong>and</strong> <strong>Watershed</strong> Management, Maharashtra State, PuneThe Director of Agriculture, Maharashtra State, PuneThe Director of Horticulture, Maharashtra State, PuneThe Director, Social Forestry, Maharashtra State, PuneThe Director, G.S.D.A., PuneThe Principal Chief Conservator of Forest, Maharashtra State, NagpurAll Superintending Agricultural OfficersAll Principal Agricultural OfficersAll Chief Executive Officers, Zilla ParishadsAll Divisional Soil Conservation OfficersAll District Deputy Directors of Social ForestryAll Divisional Forest OfficersAll District Conservators of ForestsThe Secretary, Planning Department, Mantralaya, Bombay–32The Secretary, Revenue <strong>and</strong> Forests Department, Mantralaya, Bombay–32The Secretary, Rural <strong>Development</strong> Department, Mantralaya, Bombay–400 032The Secretary, Forest Department, Mantralaya, Bombay–32The Secretary, Agriculture Department, Mantralaya, Bombay–32Under-Secretary, Water Conservation Department, Mantralaya, Bombay–400 032 (JAL-11)All Vice Chancellor of Agricultural UniversitiesSelect file. (JAL-7)Page 45 of 56
Annexure 1dGovernment of Maharashtra Resolution Regarding JFM in Capacity Building PhaseNo. FDM.1092/1841/CR-75/F-2,Revenue <strong>and</strong> Forests Department,Mantralaya, Mumbai - 400 032Dated: 2nd February 1998To,Mr. Crispino LoboProgramme CoordinatorIndo-German <strong>Watershed</strong> Dev. ProgrammeOpp. Social CentreMarket Yard RoadAHMEDNAGAR–414001Dear Sir,I am directed to invite your attention to your letter No. IGWDP/GOM/tnk/98-107 dated 20th January1998 regarding extension of facilities concerning treatment of forest l<strong>and</strong>s to the Capacity Building Phaseof the programme <strong>and</strong> to clarify that the provisions of Govt. letter No. FDM.1092/CR-75/F-2 dated 11thJuly 1994 are applicable for both Capacity Building Phase as well as Full Implementation Phase of theprojects under Indo-German <strong>Watershed</strong> <strong>Development</strong> Programme.Yours sincerely,sd/-(SURESH GAIROLA)Joint Secretary to Government,Revenue & Forests DepartmentCopy to:-Principal Chief Conservator of Forests,Maharashtra State, NGP, for information.Page 46 of 56
Annexure 2This annexure details the economics of livestock rearing, based on information provided by farmers <strong>and</strong>livestock rearers during the field surveys <strong>and</strong> FGD. As livestock production systems are diverse, therecould be a variation in the economics of the same system in different watersheds.Table 1: Case Study 1—Darewadi <strong>Watershed</strong>: Economics of Shepherd CommunitiesNote: The calculations below are based on the logic that the sheep rearer maintains a constant flock size.This follows discussions with sheep rearers, who mentioned that maintaining a constant flock size wasnow the norm. The economics in the table below could vary considerably if the sheep rearer increases ordecreases flock size.Pre-watershedPost-watershedSize of Flock (as per field surveys 154 Size of Flock (as per field surveys the 77the flock size ranged from 100 to200 per HH)flock size ranges from 50 to 80 perHH)Number of rams 4 Number of rams 2Number of ewes150 (at1.5 lambsper year)Number of ewes 75 (at 1.5lambs peryear)Number of lambs produced in the 180 Number of lambs produced in the 90flockMortality rate of lambs (range 15-20%)flock18% Mortality rate of lambs (cross-bred:25%; mixed flock: 20%; indigenousflock: 10%)Mortality rate of adult sheep 5% Mortality rate of adult sheep 5%Morbidity rate 10% Morbidity rate 10%Average selling price per lamb(range Rs 1000–1500)Rs 1,250 Average selling price per lamb (rangeRs 2,500–3,500)Rs 3,000Average selling price per spent Rs 2,500 Average selling price per spent animal Rs 4,500animalAverage selling price of a sick Rs 450 Average selling price of a sick animal Rs 1,375animal (range Rs 200–700)(range Rs 750–2,000)Number of saleable animals sold 171 24 Number of saleable animals sold per 66per annumannum 25Number of animals for wool 148 26 Number of animals for wool shearing 52shearingWool quantity per animal (kg) 27 0.5 Wool quantity per animal (kg) 0.5Selling Price (Wool) Rs 18 Selling Price (Wool) Rs 15Number of days when sheep flock 80 Number of days when sheep flock is 60is in agricultural fieldsin agricultural fieldsAmount per day for sheep beingin agricultural fieldsRs 100 Amount per day for sheep being inagricultural fieldsRs 20010%24 Saleable animals comprise spent/adult animals, sick animals, male lambs, <strong>and</strong> at times even young female lambs;therefore, the weighted average is taken into consideration. Young animals generally replace spent <strong>and</strong> sick animalsin the flock. The composition of the flock cannot be fixed <strong>and</strong> changes as per real time decisions taken by the sheeprearer.25 10% lamb mortality <strong>and</strong> 5% adult mortality is compensated by the twinning percentage in sheep which isapproximately 4–6%.26Lambing takes place throughout the year; therefore, the number of animals taken into consideration is based onthe exact number sheared in the flock at the time of the survey.27 Shearing is done twice every year for adult animals.Page 47 of 56
Income <strong>and</strong> Expenditure TableIncome In Rupees Income In RupeesMeat (Healthy animal) 304,750 Meat (Healthy animal) 214,500Meat (Sick animal) 5,400 Meat (Sick animal) 8,250Wool 1,332 Wool 390Penning charges 8,000 Penning charges 12,000Total Revenue 319,482 Total Revenue 235,140Expenditure: In Rupees Expenditure: In RupeesLabour 15,000 Labour 0 28Medicine 10,000 Medicine 7,000Fodder (top feed, leasing l<strong>and</strong> forFodder (top feed, leasing l<strong>and</strong> for18,000grazing, etc.)grazing, etc.)9,000Wool shearing 2,000 Wool shearing 1,000Transport 6,000 Transport 3,000Total expenditure 51,000 Total expenditure 20,000Net profit 268,482 Net profit 215,140Profit margin 84% Profit margin 91%Miscellaneous expenditure 29 18,000 Miscellaneous expenditure 10,000Net profit after deductingNet profit after deducting250,482Miscellaneous expendituremiscellaneous expenditure205,140Profit margin 78% Profit margin 87%Net profit per HH under the rakholiNet profit under owned sheepRs 16,000systemrearingRs 205,140Net profit per sheep Rs 104 Net profit per sheep Rs 2,664Net profit per sheep (6% inflation adjusted, 13 yrs) Rs 1,249Change in Agricultural Economics of Shepherd Communities: 2–4 ha L<strong>and</strong>holding CategoryPre-watershed periodPost-watershed periodL<strong>and</strong> Area (hectares) 2.8 L<strong>and</strong> Area (hectares) 2.8Single crop—Rain-fed 1 ha Single crop 1.6 haDual crop Nil Dual crop 1.2 haTotal income Rs 2,500 Total income Rs 35,000Cost of production Rs 200 Cost of production Rs 2,500Net income Rs 2,300 Net income Rs 32,500Profit per hectare Rs 821 Profit per hectare Rs 11,607Net profit per hectare (6% inflation adjusted, 13 yrs) Rs 5,44228 With the reduction in herd size post-watershed, family members suffice to take the herd for grazing.29Miscellaneous expenditure refers to occasional penalties, fines <strong>and</strong> bribes, which need to be paid in case the flockenters private agriculture or forest l<strong>and</strong> while grazing. As the flock size goes down, the probability <strong>and</strong>, thereby, theamount of risk expenditure also goes down.Page 48 of 56
Table 2A: Case Study 3—Mhasw<strong>and</strong>i <strong>Watershed</strong>: Dairy Farming Economics 0–1 ha L<strong>and</strong>holdingCategoryPre-<strong>Watershed</strong>Post-<strong>Watershed</strong>Source of incomeSale of male calves for draft Milk salepurposesNumber of cows 5 to 7 1Cow breed Indigenous Cross-bred (HF 75%)Number of goats Not applicable 1Cow milk output, in litres per day 30 12 31 15.5Total milk output in a year, in litres 2,976 3,844Selling price of milk, per litre Rs 7 Rs 13Milk sale Rs 0 Rs 49,972Yearly bonus Rs 0 Rs 3,844Selling price per bullock Rs 1,000 Not applicable 32Selling price of cross-bred male calf Not applicable Rs 1,000 33Bullock sale (pre-watershed)/ sale ofRs 5,000 Rs 0cross-bred male calf (post-watershed, atthe time of the survey)Yearly sales Rs 5,000 Rs 53,816Cost:Top feed Rs 0 Rs 32,850Medical/Health Rs 200 Rs 2,400Total cost Rs 200 Rs 35,250Net profit Rs 4,800 Rs 18,566Income through fodder sale from CPR Rs 0 Rs 10,000Cost of buying CPR plots Rs 0 Rs 1,000Net profit through fodder sale from CPR Rs 0 Rs 9,000Total net income <strong>Livestock</strong> <strong>and</strong> CPR Rs 4,800 Rs 27,566Net income per cow Rs 800 Rs 27,5666% inflation adjusted for 15 years Rs 11,50230Milk yields of indigenous cows <strong>and</strong> cross-bred cows showed wide variation. The calculations in this table arebased on the milk output of the animal kept by the farmer at the time of survey rather than taking an average figure.31 Milk was used only for home consumption.32The rearing of indigenous cows has been discontinued post-watershed <strong>and</strong>, therefore, there is no sale of bullocks.33Cross-bred male calves are sold at Rs 1,000 each. However, at the time of the survey, no male calf was born <strong>and</strong>,therefore, no value has been imputed.Page 49 of 56
Table 2b: Case Study 3–Mhasw<strong>and</strong>i <strong>Watershed</strong>: Dairy Farming Economics 1-2 Ha L<strong>and</strong>holdingCategoryPre-watershed Post-watershedSource of IncomeGoat <strong>and</strong> cow saleMilk sale, Agriculture,Manure sale, Goat saleNo. of cows 10 to 20 5Cow breed Indigenous HF (75%)Milk produced by all cows, per day (litres) 30 57Milk produced (number of months in a year) 8 8Annual milk production (litres) 7,440 14,136Milk sale, in litres (after own consumption) Nil 13,888Selling price of milk per litre Rs 7 Rs 13<strong>Livestock</strong> economicsIncomeGoat sale Rs 1,500 Rs 0Milk sale (cow milk) Rs 0 Rs 180,544Manure sale Rs 0 Rs 13,600Bullock sale, for draft purpose Rs 3,500 Rs 0Yearly bonus (from milk cooperative) Rs 0 Rs 13,888Total income Rs 5,000 Rs 208,032CostFodder/Top feed Rs. 0 Rs. 73,913Medicine Rs. 100 Rs. 2,000Miscellaneous expenditure 34 Rs. 0 Rs. 15,800Total cost Rs 100 Rs 91,713Net income Rs 4,900 Rs 116,320Income through fodder sale from CPR Rs 0 Rs 0Cost of buying CPR plots Rs 0 Rs 800Net income through fodder sale from CPR Rs 0 – Rs 800Total net income through livestock <strong>and</strong> foddersaleRs 4,900 Rs 115,520Net income per cow Rs 327 Rs 23,1046% inflation adjusted for 15 years Rs 9,64034 Cost of additional drinking water by tankers during summers for cross-breds, transportation costs incurred onhospital visits for treatment, veterinary fee, etc. This is, however, not a constant amount <strong>and</strong> would change perseason <strong>and</strong> requirements.Page 50 of 56
Table 3a: Case Study 4: Wanjulshet <strong>Watershed</strong>: Mix Farm Economics 1–2 Ha L<strong>and</strong>holdingCategorySales Pre-watershed Post-watershedPaddy Rs 5,000 Rs 96,000Groundnut Rs 1,600 Rs 2,400Wheat 0 Rs 24,000Brinjal 0 Rs 1,000Tomato 0 Rs 7,000Harbara (Gram) 0 Rs 1,000Onion 0 Rs 20,000Total Sales Rs 6,600 Rs 151,400CostFertilizer Rs 400 Rs 7,200Labour Rs 150 Rs 4,000Seed Rs 300 Rs 5,000Pesticide Rs 50 Rs 2,000Transport 0 Rs 700Electricity 0 Rs 2,000Thresher machine 0 Rs 1,500Total cost Rs 900 Rs 22,400Net income Rs 5,700 Rs 129,000Profit per hectare Rs 1,425 Rs 32,250Profit per hectare (6% inflation adjusted, 9 years) Rs 19,089Input Cost Saved Due to Internal Integration<strong>Livestock</strong> to AgricultureAgriculture to <strong>Livestock</strong>Bullock Cart Cost SavedFodder Production, kgMarket rate per day Rs 200 Rice 4,500No. of days used 100 Green fodder 3,000Total bullock cart cost Rs 20,000 Groundnut 150Manure Cost Saved Total Fodder 4,650Manure production (number oftractors)5 Current market price, Rs per kgMarket rate per tractor Rs 1,200 Agriculture fodder Rs 2Value of manure Rs 6,000 Fodder crop Rs 5Input Cost SavedInput Cost SavedBullock cart cost saved Rs 20,000 Fodder from crop residue Rs 9,300Manure cost saved Rs 6,000 Fodder crop cultivation Rs 15,000Agriculture input cost saved Rs 26,000 <strong>Livestock</strong> input cost saved Rs 24,300Page 51 of 56
Table 3b: Case Study 4: Wanjulshet <strong>Watershed</strong>: Mix Farm Economics 0–1 ha L<strong>and</strong>holdingCategoryNote: Pre-watershed, the HHs primarily depended on wage labour <strong>and</strong> there was no income fromfarming. HH income was based on the number of days of work per member, <strong>and</strong> has, therefore, not beentabulated. <strong>Livestock</strong> <strong>and</strong> agriculture economics post-watershed developments are detailed below.<strong>Livestock</strong> Financials—Post-watershedGoat Cow HenNo. of animals 15–20 No. of animals 2 No. of animals 7No. of animalsNo. of animalsNo. of animals sold50sold per annumsold per annumper annum2Possible sellingSelling price perSelling price perRs 2,000 price that can be Rs 2,000adult animalanimalobtained per calfRs 200Eggs sold p.a. 520Selling price pereggRs 3Sales Rs 10,000 Sales Rs 0 Sales Rs 1,960Cost Cost CostMedicine Rs 1,000 Medicine Rs. 1,000 Medicine Rs 0Net Income Rs 9,000 Net income – Rs 1,000 Net income Rs 1,960Agriculture Financials—Post-watershed (subsistence farming)L<strong>and</strong> area (in acre) 2 Sales 0Cultivable 1Waste 1 CostSeed Rs 1,300Crop production Quintals Labour Rs 1,000Rice 7 Fertilizer Rs 1,000Wheat 4 Total cost Rs 3,300Crop sold Nil Net income – Rs 3,300Total agriculture <strong>and</strong> livestock income Rs 6,660Labour income Rs 8,000Total income Rs 14,660* Since the family size is large,all the agriculture produce getsconsumed at home.Page 52 of 56
Annexure 31. <strong>Watershed</strong> Treatment in DarewadiTreatment UndertakenArea Covered (Ha/No.)Cultivable l<strong>and</strong> treated1,040.77 haGrassl<strong>and</strong> with trees117.92 haReforestation <strong>and</strong> aftercare86.8 haHorti-pasture3 haAfforestation191.53 haLoose boulder structures4 numbersMasonry weir4 numbersCheck weir1 numberCheck dam1 numberRepair of nala bunds12 numbersTotal ExpenditureAmount (Rs)Labour 5,344,942Material 1,861,656Supervision 359,167Shramdan (Voluntary labour contribution by thecommunity) (17.34% of labour cost)1,121,558Total Expenditure (Including Shramdan) 8,687,323Contribution by the government for afforestation: Rs 621,513Total CPR area treated: 396.25 ha; Total cultivable l<strong>and</strong> treated: 1040.77 ha2. <strong>Watershed</strong> Treatment in M<strong>and</strong>waL<strong>and</strong> UseA) Area TreatmentsAfforestation <strong>and</strong>Reforestation in forestl<strong>and</strong>sTreatment UndertakenContinuous contour trench (CCT),Farm bund (FB), Contour bund (CB),Continuous staggered bunds (CSB),Gully plugs, plants, grass seeding,Water absorption trench (WAT)Refilling <strong>and</strong> plantation, weeding,mulchingArea Covered(Ha./No.)TotalExpenditure (Rs.)400.97 ha 2,128,445Grassl<strong>and</strong> with trees(GT) in revenue l<strong>and</strong>s116.92 ha 195,274Soil conservation <strong>and</strong>Horti-pasture (private CCT <strong>and</strong> Plantation 16.44 ha 66,289l<strong>and</strong>s)Bunding of cultivable Farm bunds, rill plugs, grass seeding,l<strong>and</strong>sstone bund375.74 ha 730,614Supervision 221,191Expenditure (a) 3,341,813B) Drainage Line TreatmentNo. of loose boulder structures 23 44,295No. of cement plugs 2 188,851No. of check dams 3 1,053,669No. of Gabion structures 38 365,504Expenditure (b) 1,652,319Total expenditure (a + b) 4,994,132Total CPR area treated: 517.89 ha; Total cultivable l<strong>and</strong> treated: 392.18 haPage 53 of 56
3. <strong>Watershed</strong> Treatment in Mhasw<strong>and</strong>iTreatment Undertaken Area Covered (Ha/No.)Total Expenditure(Rs)A) Area TreatmentCultivable l<strong>and</strong> treated 367 ha 1,440,134Horti-pasture (private l<strong>and</strong>s) 2 ha 7,813GT 100 ha 276,121Afforestation 171.45 ha 1,579,373Reforestation 50 ha 432,472Total (a) 690.45 ha 3,735,913B) Drainage line treatmentNo. of nala bunds 7 268,979No. of gabion structures 48 450,196No. of check dams 2 656,710Total (b) 1,375,885Total expenditure 5,111,798Expenditure incurred on plantations in the village of Mhasw<strong>and</strong>iFD Rs 278,108IGWDP (Pvt. l<strong>and</strong>) Rs 314,212Total Rs 592,320Contribution by various government departments• Construction of 11 nala bunds <strong>and</strong> one check dam was undertaken by the Department ofAgriculture.• Afforestation <strong>and</strong> reforestation work (CCT, CST, WAT, NB) was done over 179 ha by the Forest<strong>Development</strong> Corporation of Maharashtra (FDCM)• The Minor Irrigation Department assisted in the construction of a check dam <strong>and</strong> 3 percolationtanks.Total CPR area treated: 321.45 ha; Total cultivable area treated: 369 ha4. <strong>Watershed</strong> Treatment in WanjulshetL<strong>and</strong> UseTreatment UndertakenArea Covered(Ha/No.)TotalExpenditure (Rs)A) Area TreatmentCultivable l<strong>and</strong>treatedFarm bund/Contour bund 256.70 ha 752,414GTCCT/Water absorption trenchRefilling <strong>and</strong> plantation, weeding,mulching73.91 ha 884,153Horti-pasture CCT/Pits 67 ha 767,177Forest (AF) CCT / WAT / Plantation 52 ha 754,421Aftercare of GTPlantation, Weeding <strong>and</strong>mulching52.70 ha 29,359Supervision 127,392Total (a) 3,314,916B) Drainage line treatmentNo. of loose boulder structures 69 170,707No. of nala bunds repaired 1 number 112,194Total (b) 2,82,901Total Expenditure (a + b) 3,597,817Total CPR area treated: 245.61 ha; Total cultivable l<strong>and</strong> treated: 256.70 haPage 54 of 56
Annexure 4Policy impact of WOTR’s Role in IGWDP<strong>Watershed</strong> development is considered a strategic intervention for poverty reduction as over 70% of arablel<strong>and</strong> in India is rain-fed <strong>and</strong> over 60% of rural India depends on these l<strong>and</strong>s. In the late 1990s, afterseveral years of implementation of the National <strong>Watershed</strong> <strong>Development</strong> Programme for Rainfed Areas(NWDPRA), under the Ministry of Agriculture, it was realized that without people’s participation <strong>and</strong>involvement, such interventions would not result in lasting benefits to the target group. The entireprogramme has since been structurally <strong>and</strong> operationally recast to include the experience gained <strong>and</strong>insights achieved, including the development of common guidelines for watershed development. Some ofthe key approaches developed under IGWDP were incorporated in the common guidelines that weredeveloped for watershed development programmes across the country.1. The IGWDP was the first large-scale programme in the country, which made village self-helpgroups (VSHGs) responsible for direct implementation of watershed activities with NGOs asfacilitators. It also established the precedent of giving funds directly to these VSHGs to plan,organize, implement <strong>and</strong> maintain watershed structures in their villages. This pattern has now beenadopted by other mainstream development programmes in the country.2. WOTR, through the Indo-German <strong>Watershed</strong> <strong>Development</strong> Programme (IGWDP), has beeninstrumental in influencing several of these structural <strong>and</strong> operational changes, as detailed below.(i) WOTR designed <strong>and</strong> implemented a large-scale integrated Capacity Building Programme (knownas the Participatory Operational Pedagogy—POP) as a prelude to <strong>and</strong> a necessary condition forlarge-scale project implementation. This practice of capacity building as a separate, prior <strong>and</strong>integral component of watershed development is now accepted <strong>and</strong> adopted by otherprogrammes in the country as a pre-condition <strong>and</strong> an integral part of watershed programmes.(ii) The capacity building approach designed by WOTR (as opposed to a training approach only) hasbeen specifically mentioned in the ‘Common Approach to <strong>Watershed</strong> <strong>Development</strong> Guidelines”(page 14) adopted by the Government of India. CAPART 35 -funded projects, as well as projectsunder DPAP (Drought Prone Area Program) have introduced a CBP. The National <strong>Watershed</strong><strong>Development</strong> Program for Rainfed Areas (NWDPRA) has also adopted the practice of a separate<strong>and</strong> distinct CBP (called ‘Community Mobilization’) followed by an FIP in its programme.(iii) The concept of capacity building <strong>and</strong> appointment of lead NGOs has been adopted by theGovernment of Maharashtra in its watershed programme under DPAP <strong>and</strong> is known as the‘Mother NGO’ concept. As per this concept, selected NGOs are given lead responsibilities forparticipating NGOs within defined districts.(iv) WOTR developed <strong>and</strong> operationalised a process called the Participatory Net Planning Method(PNPM), for involving the farmer couple in the development of their farms <strong>and</strong> l<strong>and</strong>s. This isnow common practice (with local variations) in all major watershed programs—DPAP inMaharashtra, Andhra Pradesh Rural Livelihoods Program—APRLP-DPAP—in Andhra Pradesh,<strong>and</strong> NABARD’s National <strong>Watershed</strong> <strong>Development</strong> Fund, <strong>and</strong> is now increasingly seen as a toolnot only for planning but also for community mobilisation. This has been a significantpedagogical <strong>and</strong> conceptual tool for participatory planning <strong>and</strong> building community ownership.(v) Concepts <strong>and</strong> processes developed <strong>and</strong> adopted by WOTR <strong>and</strong> the IGWDP such as ridge-tovalleytreatment, site-specific <strong>and</strong> community selected measures, people’s ownership <strong>and</strong> civilsociety-public sector partnership have been incorporated in government-run watershedprogrammes across the country.35Council for the Advancement of Peoples Action <strong>and</strong> Rural Technology (an institution under the Ministry of Rural<strong>Development</strong>, Government of India).Page 55 of 56
(vi) Permission to treat degraded forest l<strong>and</strong> was also obtained by WOTR for the IGWDP. This was asingular achievement, as such l<strong>and</strong>s come under the purview of the Forest Conservation Act.(vii) A major structural initiative has been the setting up of the National <strong>Watershed</strong> <strong>Development</strong>Fund (NWDF) by the Government of India at NABARD. This idea was presented by theExecutive Director of WOTR (Mr. Crispino Lobo) <strong>and</strong> the then Chairman of NABARD (Mr.Y.C. N<strong>and</strong>a) to the Finance Minister (Mr. Yashwant Sinha) in February 1999 during the prebudgetconsultations held in Delhi. The NWDF is intended to carry the experience of the IGWDPacross 100 of the poorest rain-fed districts in the country. WOTR has supported NABARD in thisrole by conducting training <strong>and</strong> exposure visits for its officers, staff of government departmentsas well as participating NGOs from different states of the country.(viii) Through its outreach interventions on training, extension support <strong>and</strong> capacity building, as wellas implementation of successful projects (own <strong>and</strong> partner NGOs), WOTR has contributed in asingular way to building up the competencies, skills <strong>and</strong> knowledge of watershed practitioners(villagers, NGOs, government functionaries) across the country as well as internationally. A totalof 175,157 partners (villagers <strong>and</strong> NGO personnel); 18,887 government officials, bankers, NGOdecision-makers <strong>and</strong> personnel from 27 states of India <strong>and</strong> 452 persons from 33 countries haveparticipated in <strong>and</strong> availed of WOTR’s training <strong>and</strong> Exposure Dialogue Programmes as onDecember 2010.(ix) Today, in several Indian states, especially where the IGWDP is now proposing to exp<strong>and</strong>(Gujarat, Andhra Pradesh <strong>and</strong> Rajasthan), several NGOs that have participated in WOTR’straining programmes have acquired a fair degree of competency to successfully implement largescalewatershed projects. Dozens of ‘replicators’ have been created, thus spreading the practice ofwatershed development across the country. In the Government of Maharashtra’s <strong>Watershed</strong><strong>Development</strong> Program, most IGWDP-related NGOs were invited to participate. A spin-off is thateven in non-watershed programmes, the participation of these NGOs is now sought by theGovernment—a recognition of the capacity, competency <strong>and</strong> credibility they have acquired.(x) In order to facilitate efficient management of information/data, <strong>and</strong> review the same as well asensure timely <strong>and</strong> effective monitoring, WOTR has developed simple but comprehensive ITbasedManagement Information Systems (MIS), Decision Support Systems (DIS) <strong>and</strong> DiagnosticExpert Systems (DES) for both the IGWDP as well as its own work. Seeing its potential, theGovernment of Andhra Pradesh commissioned WOTR to develop a large-scale DIS to manage itswatershed program (APRLP). The Swiss <strong>Development</strong> Cooperation (SDC) also asked WOTR todevelop an MIS system for its partners in Karnataka.(xi) WOTR’s work on integrated watershed development is prominently mentioned <strong>and</strong> frequentlyreferred to in the foreword of the prestigious National Report of the Government of India, “FromHariyali to Neeranchal—Report of the Technical Committee on <strong>Watershed</strong> Programmes inIndia”, popularly referred to as the Parthasarthy Commission Report.(http://dolr.nic.in/ParthaCommittee/ParthaCommitteeReport.htm).(xii) The World Resources Institute Report, 2005, “The wealth of the poor: Managing ecosystems tofight poverty” extensively featured the work of WOTR in Darewadi village (More Water, MoreWealth in Darewadi Village, pp. 124–130) as a successful example of large-scale povertyreduction through community based environmental regeneration (www.wri.org).(xiii) WOTR’s work was also featured in the National Geographic magazine, November 2009, pp.110–127 (http://ngm.nationalgeographic.com/2009/11/india-rain/corbett-text/5), <strong>and</strong> also in the“World Resources Report, 2008: Roots of Resilience” of the World Resources Institute,Washington (http://<strong>pdf</strong>.wri.org/world_resources_2008_roots_of_resilience_chapter2), p. 68.Page 56 of 56
Suggested Citation: SA PPLPP (2012), “<strong>Watershed</strong> <strong>Development</strong> <strong>and</strong> <strong>Livestock</strong> <strong>Rearing</strong> – Experiences <strong>and</strong> Learningfrom the <strong>Watershed</strong> Organisation Trust in Maharashtra, India”© SA PPLPP (http://<strong>sapplpp</strong>.org/copyright)Disclaimer: The designations employed <strong>and</strong> the presentation of material in this publication do not imply theexpression of any opinion whatsoever on the part of the National Dairy <strong>Development</strong> Board of India (NDDB) <strong>and</strong>the Food <strong>and</strong> Agriculture Organisation of the United Nations (FAO) concerning the legal status of any country,territory, city or area or its authorities, or concerning the delimitations of its frontiers or boundaries. The opinionsexpressed are solely of the author(s) <strong>and</strong> reviewer(s) <strong>and</strong> do not constitute in any way the official position of theNDDB or the FAO.Reproduction <strong>and</strong> dissemination of material from this study for educational or non-commercial purposes isauthorised without any prior written permission from the copyright holders, provided the source is fullyacknowledged. Reproduction of material from this study for resale or other commercial purposes is prohibitedwithout prior written permission from the copyright holders.
SOUTH ASIA Pro Poor <strong>Livestock</strong> Policy ProgrammeA joint initiative of NDDB <strong>and</strong> FAORegional Office:NDDB House (6 th Floor), PB 4906, Safdarjung EnclaveNew Delhi – 110029, INDIATel: +91 (0) 11 2619 7851/7649, Fax: +91 (0) 11 2618 9122E-mail: <strong>sapplpp</strong>@<strong>sapplpp</strong>.org; Website: www.<strong>sapplpp</strong>.org