Commercial Mortgage Delinquency, Foreclosure and Reinstatement
Commercial Mortgage Delinquency, Foreclosure and Reinstatement
Commercial Mortgage Delinquency, Foreclosure and Reinstatement

Create successful ePaper yourself
Turn your PDF publications into a flip-book with our unique Google optimized e-Paper software.
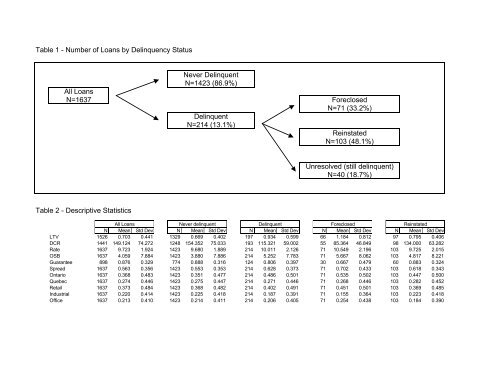
Table 1 - Number of Loans by <strong>Delinquency</strong> StatusAll LoansN=1637Never DelinquentN=1423 (86.9%)DelinquentN=214 (13.1%)ForeclosedN=71 (33.2%)ReinstatedN=103 (48.1%)Unresolved (still delinquent)N=40 (18.7%)Table 2 - Descriptive StatisticsAll Loans Never delinquent Delinquent ForeclosedReinstatedN Mean Std Dev N Mean Std Dev N Mean Std Dev N Mean Std Dev N Mean Std DevLTV 1526 0.703 0.441 1329 0.669 0.402 197 0.934 0.599 66 1.184 0.812 97 0.795 0.406DCR 1441 149.124 74.272 1248 154.352 75.033 193 115.321 59.002 55 85.364 46.849 98 134.000 63.282Rate 1637 9.723 1.924 1423 9.680 1.889 214 10.011 2.126 71 10.549 2.196 103 9.725 2.015OSB 1637 4.059 7.884 1423 3.880 7.886 214 5.252 7.783 71 5.667 8.062 103 4.817 8.221Guarantee 898 0.876 0.329 774 0.888 0.316 124 0.806 0.397 30 0.667 0.479 60 0.883 0.324Spread 1637 0.563 0.356 1423 0.553 0.353 214 0.628 0.373 71 0.702 0.433 103 0.618 0.343Ontario 1637 0.368 0.483 1423 0.351 0.477 214 0.486 0.501 71 0.535 0.502 103 0.447 0.500Quebec 1637 0.274 0.446 1423 0.275 0.447 214 0.271 0.446 71 0.268 0.446 103 0.282 0.452Retail 1637 0.373 0.484 1423 0.368 0.482 214 0.402 0.491 71 0.451 0.501 103 0.369 0.485Industrial 1637 0.220 0.414 1423 0.225 0.418 214 0.187 0.391 71 0.155 0.364 103 0.223 0.418Office 1637 0.213 0.410 1423 0.214 0.411 214 0.206 0.405 71 0.254 0.438 103 0.184 0.390