Conservation of the vaquita Phocoena sinus - The Department of ...
Conservation of the vaquita Phocoena sinus - The Department of ...
Conservation of the vaquita Phocoena sinus - The Department of ...

Create successful ePaper yourself
Turn your PDF publications into a flip-book with our unique Google optimized e-Paper software.
186 L. Rojas-Bracho, R. R. Reeves and A. Jaramillo-Legorreta<br />
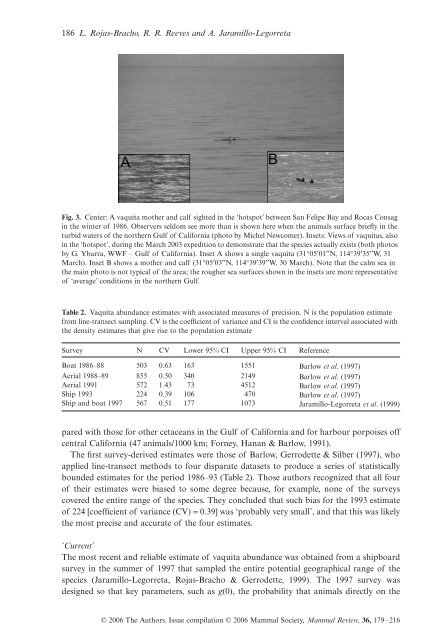
Fig. 3. Center: A <strong>vaquita</strong> mo<strong>the</strong>r and calf sighted in <strong>the</strong> ‘hotspot’ between San Felipe Bay and Rocas Consag<br />
in <strong>the</strong> winter <strong>of</strong> 1986. Observers seldom see more than is shown here when <strong>the</strong> animals surface briefly in <strong>the</strong><br />
turbid waters <strong>of</strong> <strong>the</strong> nor<strong>the</strong>rn Gulf <strong>of</strong> California (photo by Michel Newcomer). Insets: Views <strong>of</strong> <strong>vaquita</strong>s, also<br />
in <strong>the</strong> ‘hotspot’, during <strong>the</strong> March 2003 expedition to demonstrate that <strong>the</strong> species actually exists (both photos<br />
by G. Ybarra, WWF – Gulf <strong>of</strong> California). Inset A shows a single <strong>vaquita</strong> (31°05′01′′N, 114°39′35′′W, 31<br />
March). Inset B shows a mo<strong>the</strong>r and calf (31°05′03′′N, 114°39′39′′W, 30 March). Note that <strong>the</strong> calm sea in<br />
<strong>the</strong> main photo is not typical <strong>of</strong> <strong>the</strong> area; <strong>the</strong> rougher sea surfaces shown in <strong>the</strong> insets are more representative<br />
<strong>of</strong> ‘average’ conditions in <strong>the</strong> nor<strong>the</strong>rn Gulf.<br />
Table 2. Vaquita abundance estimates with associated measures <strong>of</strong> precision. N is <strong>the</strong> population estimate<br />
from line-transect sampling. CV is <strong>the</strong> coefficient <strong>of</strong> variance and CI is <strong>the</strong> confidence interval associated with<br />
<strong>the</strong> density estimates that give rise to <strong>the</strong> population estimate<br />
Survey N CV Lower 95% CI Upper 95% CI Reference<br />
Boat 1986–88 503 0.63 163 1551 Barlow et al. (1997)<br />
Aerial 1988–89 855 0.50 340 2149 Barlow et al. (1997)<br />
Aerial 1991 572 1.43 73 4512 Barlow et al. (1997)<br />
Ship 1993 224 0.39 106 470 Barlow et al. (1997)<br />
Ship and boat 1997 567 0.51 177 1073 Jaramillo-Legorreta et al. (1999)<br />
pared with those for o<strong>the</strong>r cetaceans in <strong>the</strong> Gulf <strong>of</strong> California and for harbour porpoises <strong>of</strong>f<br />
central California (47 animals/1000 km; Forney, Hanan & Barlow, 1991).<br />
<strong>The</strong> first survey-derived estimates were those <strong>of</strong> Barlow, Gerrodette & Silber (1997), who<br />
applied line-transect methods to four disparate datasets to produce a series <strong>of</strong> statistically<br />
bounded estimates for <strong>the</strong> period 1986–93 (Table 2). Those authors recognized that all four<br />
<strong>of</strong> <strong>the</strong>ir estimates were biased to some degree because, for example, none <strong>of</strong> <strong>the</strong> surveys<br />
covered <strong>the</strong> entire range <strong>of</strong> <strong>the</strong> species. <strong>The</strong>y concluded that such bias for <strong>the</strong> 1993 estimate<br />
<strong>of</strong> 224 [coefficient <strong>of</strong> variance (CV) = 0.39] was ‘probably very small’, and that this was likely<br />
<strong>the</strong> most precise and accurate <strong>of</strong> <strong>the</strong> four estimates.<br />
‘Current’<br />
<strong>The</strong> most recent and reliable estimate <strong>of</strong> <strong>vaquita</strong> abundance was obtained from a shipboard<br />
survey in <strong>the</strong> summer <strong>of</strong> 1997 that sampled <strong>the</strong> entire potential geographical range <strong>of</strong> <strong>the</strong><br />
species (Jaramillo-Legorreta, Rojas-Bracho & Gerrodette, 1999). <strong>The</strong> 1997 survey was<br />
designed so that key parameters, such as g(0), <strong>the</strong> probability that animals directly on <strong>the</strong><br />
© 2006 <strong>The</strong> Authors. Issue compilation © 2006 Mammal Society, Mammal Review, 36, 179–216