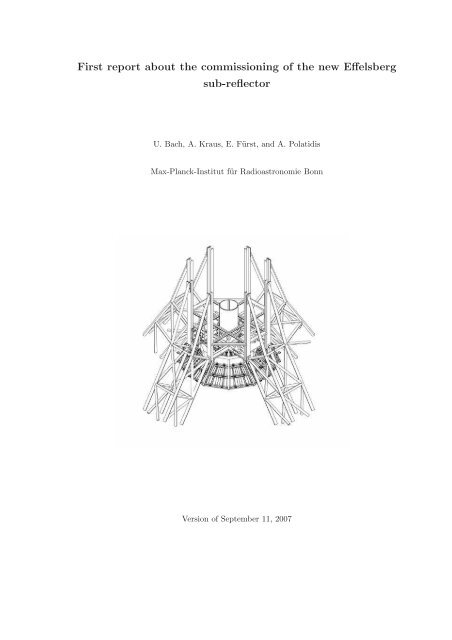
First report about the commissioning of the new Effelsberg sub ...
First report about the commissioning of the new Effelsberg sub ...
First report about the commissioning of the new Effelsberg sub ...
Create successful ePaper yourself
Turn your PDF publications into a flip-book with our unique Google optimized e-Paper software.
<strong>First</strong> <strong>report</strong> <strong>about</strong> <strong>the</strong> <strong>commissioning</strong> <strong>of</strong> <strong>the</strong> <strong>new</strong> <strong>Effelsberg</strong><br />
<strong>sub</strong>-reflector<br />
U. Bach, A. Kraus, E. Fürst, and A. Polatidis<br />
Max-Planck-Institut für Radioastronomie Bonn<br />
Version <strong>of</strong> September 11, 2007
CONTENTS<br />
1 Introduction 1<br />
2 The New Sub-Reflector 2<br />
3 Improvements 5<br />
3.1 Secondary Focus . . . . . . . . . . . . . . . . . . . . . . . . . . . . . . . . . 5<br />
3.1.1 Sensitivities and Gain Curves . . . . . . . . . . . . . . . . . . . . . . 5<br />
3.1.2 Focus curves . . . . . . . . . . . . . . . . . . . . . . . . . . . . . . . 6<br />
3.2 Primary Focus . . . . . . . . . . . . . . . . . . . . . . . . . . . . . . . . . . 8<br />
3.2.1 Multi-Receiver Boxes . . . . . . . . . . . . . . . . . . . . . . . . . . . 10<br />
4 Remaining questions 12<br />
A Focus Parameters 14<br />
B Active Surface 15<br />
C Observations 17<br />
C.1 Update <strong>of</strong> old Focus Curves . . . . . . . . . . . . . . . . . . . . . . . . . . . 17<br />
C.2 New Parameters . . . . . . . . . . . . . . . . . . . . . . . . . . . . . . . . . 17<br />
C.3 Multi-Frequency Boxes . . . . . . . . . . . . . . . . . . . . . . . . . . . . . . 20<br />
C.4 New Gain Curves . . . . . . . . . . . . . . . . . . . . . . . . . . . . . . . . . 20<br />
I
LIST OF FIGURES<br />
2.1 Coordinate system <strong>of</strong> <strong>the</strong> Hexapod. . . . . . . . . . . . . . . . . . . . . . . . 4<br />
3.1 Predicted and measured gain-elevation dependence. . . . . . . . . . . . . . . 6<br />
3.2 New gain curves SFK. . . . . . . . . . . . . . . . . . . . . . . . . . . . . . . 7<br />
3.3 Comparison <strong>of</strong> <strong>the</strong> <strong>new</strong> and old focus curves. Please note that <strong>the</strong> <strong>new</strong><br />
curves have a different sign and are multiplied by (−1) to allow a better<br />
comparison. . . . . . . . . . . . . . . . . . . . . . . . . . . . . . . . . . . . . 8<br />
3.4 Comparison <strong>of</strong> <strong>the</strong> <strong>new</strong> focus curves for SFK. . . . . . . . . . . . . . . . . . 9<br />
3.5 Comparison <strong>of</strong> old and current prime focus curves. . . . . . . . . . . . . . . 10<br />
3.6 Focus measurements at 1.3cm . . . . . . . . . . . . . . . . . . . . . . . . . . 11<br />
B.1 Active surface positions. . . . . . . . . . . . . . . . . . . . . . . . . . . . . . 16<br />
C.1 Two radial de-focused cross scans in azimuth. . . . . . . . . . . . . . . . . . 18<br />
C.2 Strongly de-focused elevation scan. . . . . . . . . . . . . . . . . . . . . . . . 19<br />
C.3 Calibration maps . . . . . . . . . . . . . . . . . . . . . . . . . . . . . . . . . 19<br />
C.4 Relative amplitude <strong>of</strong> cross scans taken at different ylin positions at 5 cm<br />
(prime focus). . . . . . . . . . . . . . . . . . . . . . . . . . . . . . . . . . . . 20<br />
C.5 Relative amplitude <strong>of</strong> cross scans taken at different ylin and xrot positions<br />
for 3.6 cm. . . . . . . . . . . . . . . . . . . . . . . . . . . . . . . . . . . . . . 21<br />
C.6 Relative amplitude <strong>of</strong> cross scans taken at different ylin and xrot positions<br />
for 2 cm. . . . . . . . . . . . . . . . . . . . . . . . . . . . . . . . . . . . . . . 21<br />
C.7 Relative amplitude <strong>of</strong> cross scans taken at different xlin and ylin . . . . . . . 22<br />
C.8 Relative amplitude <strong>of</strong> cross scans taken at different xlin and ylin . . . . . . . 22<br />
C.9 Old and <strong>new</strong> gain curve at 9mm. . . . . . . . . . . . . . . . . . . . . . . . . 23<br />
C.10 Old and <strong>new</strong> sensitivity at 9mm. . . . . . . . . . . . . . . . . . . . . . . . . 23<br />
C.11 Old and <strong>new</strong> gain curve at 2.8cm. . . . . . . . . . . . . . . . . . . . . . . . . 24<br />
C.12 Old and <strong>new</strong> sensitivity at 2.8cm. . . . . . . . . . . . . . . . . . . . . . . . . 24<br />
II
LIST OF TABLES<br />
2.1 Properties <strong>of</strong> <strong>the</strong> hexapod mount . . . . . . . . . . . . . . . . . . . . . . . . 3<br />
3.1 Characteristics <strong>of</strong> SFK receivers . . . . . . . . . . . . . . . . . . . . . . . . . 6<br />
3.2 Measured <strong>of</strong>fsets between secondary focus receivers. . . . . . . . . . . . . . 9<br />
3.3 Focal positions <strong>of</strong> <strong>the</strong> dual-frequency box . . . . . . . . . . . . . . . . . . . 11<br />
A.1 Focus parameters for different receivers (from Sept. 2007). . . . . . . . . . . 14<br />
III
Chapter 1<br />
Introduction<br />
On October 5, 2006 a <strong>new</strong> <strong>sub</strong>-reflector equipped with an adjustable surface was mounted<br />
on <strong>the</strong> 100 m <strong>Effelsberg</strong> telescope. The higher accuracy <strong>of</strong> its panels shall increase <strong>the</strong><br />
sensitivity at <strong>the</strong> higher frequencies in <strong>the</strong> secondary focus and <strong>the</strong> elevation dependent<br />
adjustment <strong>of</strong> <strong>the</strong> surface is supposed to minimize <strong>the</strong> gain dependence on elevation.<br />
Since <strong>the</strong> hexapod now allows to adjust <strong>the</strong> <strong>sub</strong>-reflector in all three lateral and rotational<br />
directions and <strong>the</strong> exact position <strong>of</strong> <strong>the</strong> <strong>new</strong> system might differ from <strong>the</strong> old<br />
configuration, <strong>new</strong> focus curves had to be measured for all receivers. The hexapod control<br />
<strong>of</strong> <strong>the</strong> <strong>sub</strong>-reflector became fully functional in November 2006. The control <strong>of</strong> <strong>the</strong> active<br />
surface is used since January 2007. So far <strong>the</strong> active surface is controlled by a predefined<br />
matrix with position entries for all 96 actuators for steps in elevation <strong>of</strong> 0, 10, 20, 30,<br />
32, 40, 50, 60, 70, 80, and 90 degrees. The matrix was delivered by MT Mechatronics<br />
(also known as MAN and MT Aerospace) and is based on a FE model <strong>of</strong> <strong>the</strong> gravitational<br />
deformation <strong>of</strong> <strong>the</strong> main-dish. Holographic measurements to verify or improve <strong>the</strong> model<br />
are currently discussed.<br />
This document describes <strong>the</strong> testing phase, <strong>commissioning</strong>, and <strong>the</strong> calibration <strong>of</strong> <strong>the</strong><br />
<strong>new</strong> system with all secondary and some <strong>of</strong> <strong>the</strong> primary focus receivers. A description<br />
<strong>of</strong> <strong>the</strong> <strong>new</strong> system is given in Sect. 2, and <strong>the</strong> focus and calibration measurements are<br />
shown in Sect. 3. Open points which need fur<strong>the</strong>r testing are discussed in Sect. 4. This<br />
section includes also a comment <strong>about</strong> <strong>the</strong> <strong>new</strong> focus formulas that were introduced when<br />
this <strong>report</strong> was already finished. The consequences <strong>of</strong> this modification are not completely<br />
clear yet and will be described in a second <strong>report</strong> (Bach et al. in perp.). A more detailed<br />
description <strong>of</strong> <strong>the</strong> individual measurements, which were used to obtain <strong>the</strong> <strong>new</strong> focus<br />
curves are given in <strong>the</strong> Appendix.<br />
Acknowledgements We thank J. Neidhöfer, P. Müller, T. P. Krichbaum, and W. Reich<br />
for discussions and suggestions that helped to perform and interprete <strong>the</strong> test observations.<br />
In particular we like to thank J. B. Schraml for noticing <strong>the</strong> need for <strong>new</strong> focus formulas.<br />
1
Chapter 2<br />
The New Sub-Reflector<br />
The basic parameters <strong>of</strong> <strong>the</strong> <strong>new</strong> <strong>sub</strong>-reflector are equal to <strong>the</strong> ones <strong>of</strong> <strong>the</strong> old one. It has<br />
a radius <strong>of</strong> 3.25 m and an elliptical shape with a major axis <strong>of</strong> 14.305 m and a minor axis<br />
<strong>of</strong> 7.3872 m. The two foci are <strong>the</strong>rewith at <strong>about</strong> 2.055 m and 28 m separated from <strong>the</strong><br />
vertex <strong>of</strong> <strong>the</strong> <strong>sub</strong>-reflector. One <strong>of</strong> <strong>the</strong> major improvements <strong>of</strong> <strong>the</strong> <strong>new</strong> <strong>sub</strong>-reflector is <strong>the</strong><br />
higher accuracy <strong>of</strong> its surface. The surface rms is only ∼ 60µm with respect to a perfect<br />
elliptical reflector whereas <strong>the</strong> old surface showed a rms <strong>of</strong> ∼ 800µm.<br />
The <strong>new</strong> <strong>sub</strong>-reflector is mounted to <strong>the</strong> prime focus cabin with a hexapod which allows<br />
<strong>the</strong> adjustment <strong>of</strong> all three lateral and rotational axes (see Tab. 2.1). In comparison, <strong>the</strong><br />
old system was only adjustable linearly along <strong>the</strong> optical axis, and along <strong>the</strong> elevation<br />
direction and rotatable around <strong>the</strong> elevation axis. The <strong>new</strong> degrees <strong>of</strong> freedom and <strong>the</strong><br />
larger movable ranges should allow to better illuminate secondary receivers fur<strong>the</strong>r away<br />
from <strong>the</strong> optical axis and to use multi-frequency receiver boxes with up to four different<br />
receivers to be positioned in <strong>the</strong> prime focus.<br />
The correspondence <strong>of</strong> <strong>the</strong> old focus curves, FCs, and <strong>the</strong> hexapod axes 1 are:<br />
FC1 = −xlin + 12 (2.1)<br />
FC2 = −zlin − 50 (2.2)<br />
FC3 = yrot<br />
(2.3)<br />
In <strong>the</strong> following we will only use <strong>the</strong> <strong>new</strong> notations <strong>of</strong> <strong>the</strong> hexapod axes. In Table 2.1<br />
<strong>the</strong> possible driving ranges <strong>of</strong> <strong>the</strong> hexapod mount are given. A little sketch <strong>of</strong> <strong>the</strong> hexapod<br />
coordinate system is shown in Fig. 2.1. The coordinate system is a right handed system.<br />
The figure also shows that movements along <strong>the</strong> x-axis correspond to shifts along <strong>the</strong><br />
elevation direction, where positive values correspond to shifts towards lower elevations<br />
and <strong>the</strong> y-axis corresponds to movements along <strong>the</strong> azimuth direction, where positive<br />
shifts steer <strong>the</strong> <strong>sub</strong>-reflector towards <strong>the</strong> B-tower.<br />
Ano<strong>the</strong>r advantage <strong>of</strong> <strong>the</strong> <strong>new</strong> <strong>sub</strong>-reflector is <strong>the</strong> possibility to change from secondary<br />
to prime focus observations within a few minutes using <strong>the</strong> control panel in <strong>the</strong> control<br />
room. The telescope has to be pointed at least to 88 degrees elevation, <strong>the</strong>n <strong>the</strong> receiver<br />
which is actually present in <strong>the</strong> prime focus tube can be brought into <strong>the</strong> focus or pulled<br />
back. The receiver has to be filled in to <strong>the</strong> prime focus tube by hand; three receivers<br />
1 The <strong>of</strong>fset <strong>of</strong> 12mm was measured during <strong>the</strong> preparations for <strong>the</strong> <strong>new</strong> <strong>sub</strong>-reflector and marks <strong>the</strong><br />
<strong>of</strong>fset <strong>of</strong> <strong>the</strong> old reflector with respect to <strong>the</strong> centre <strong>of</strong> <strong>the</strong> prime focus cabin. An <strong>of</strong>fset <strong>of</strong> 16mm was<br />
measured for ylin. In addition a slope in xrot <strong>of</strong> 27 arcmin was noted.<br />
2
can be stored and kept cool in <strong>the</strong> prime focus cabin. New prime focus boxes are build,<br />
which might carry up to four different frequency receivers which will again increase <strong>the</strong><br />
frequency flexibility <strong>of</strong> <strong>the</strong> <strong>Effelsberg</strong> telescope. A first dual box (1.0/1.9 cm) was already<br />
successfully tested (see Sect. 3.2 for more details).<br />
Table 2.1: Properties <strong>of</strong> <strong>the</strong> hexapod mount. Given are <strong>the</strong> name <strong>of</strong> <strong>the</strong> focus axis in <strong>the</strong> telescope<br />
control s<strong>of</strong>tware, <strong>the</strong> corresponding axis <strong>of</strong> <strong>the</strong> hexapod control (see also Fig. 2.1), <strong>the</strong> minimum and<br />
maximum drivable ranges. “pol” means <strong>the</strong> rotation <strong>of</strong> <strong>the</strong> polarization angle around <strong>the</strong> z-axis, which is<br />
a independent system from <strong>the</strong> hexapod and <strong>the</strong>rewith from zrot. The <strong>new</strong> “pol” angle has an <strong>of</strong>fset <strong>of</strong><br />
−90 ◦ to <strong>the</strong> old definition. Viewed from <strong>the</strong> secondary focus a positive rotations direction corresponds to<br />
a clockwise rotation.<br />
Old Axis min max<br />
Name [mm ( ◦ )] [mm ( ◦ )]<br />
FC1 xlin −230 +230<br />
ylin −180 +180<br />
FC2 zlin −200 +100<br />
xrot (−1.0) (+1.0)<br />
FC3 yrot (−1.0) (+1.0)<br />
zrot (−0.2) (+0.2)<br />
pol pol (−195) (195)<br />
3
Top−view<br />
+z−lin<br />
z−rot<br />
Side−view<br />
+y−lin<br />
y−rot<br />
"From behind"<br />
+x−lin<br />
x−rot<br />
B−Tower<br />
B−Tower<br />
x<br />
A−Tower<br />
A−Tower<br />
+y−lin<br />
Elevation<br />
+z−lin<br />
Elevation<br />
Elevation y−rot<br />
A−Tower<br />
y−rot<br />
+x−lin<br />
z−rot<br />
+y−lin<br />
Figure 2.1: Coordinate system <strong>of</strong> <strong>the</strong> Hexapod.<br />
+x−lin<br />
z−rot<br />
x−rot<br />
x−rot<br />
+z−lin<br />
4
3.1 Secondary Focus<br />
Chapter 3<br />
Improvements<br />
Most <strong>of</strong> <strong>the</strong> test are done and for all <strong>of</strong> <strong>the</strong> secondary focus receivers <strong>new</strong> focus and<br />
gain curves have been measured. We first present <strong>the</strong> <strong>new</strong> advantages in terms <strong>of</strong> higher<br />
sensitivity and improved gain curves and later describe <strong>the</strong> measurement <strong>of</strong> <strong>the</strong> <strong>new</strong> focus<br />
curves.<br />
3.1.1 Sensitivities and Gain Curves<br />
The surface-rms for <strong>the</strong> secondary focus is a combination <strong>of</strong> <strong>the</strong> rms <strong>of</strong> <strong>the</strong> main dish and<br />
<strong>the</strong> rms <strong>of</strong> <strong>the</strong> <strong>sub</strong>-reflector. The <strong>the</strong>oretical sensitivity, Γ, for a specific wavelength, λ,<br />
can be calculated by <strong>the</strong> Ruze formula:<br />
Γ = ηA · Γ0 = ηA · Ageom<br />
with ηA = η0 · exp<br />
2k = ηA · πD2<br />
8k = ηA · 2.844 K/Jy (3.1)<br />
� � � �<br />
2 �<br />
4πσ<br />
−0.78 · and σ = σ<br />
λ<br />
2 P + σ2 S ,<br />
where ηA is <strong>the</strong> aperture efficiency, k <strong>the</strong> Boltzmann constant, Ageom <strong>the</strong> geometric<br />
area <strong>of</strong> <strong>the</strong> antenna, and σP and σS <strong>the</strong> rms <strong>of</strong> <strong>the</strong> primary and secondary mirror. Using<br />
η0 = 0.55, σP = 0.55 mm, σS,old = 0.75 mm, and σS,<strong>new</strong> = 0.1 mm <strong>the</strong> higher accuracy<br />
<strong>of</strong> <strong>the</strong> <strong>sub</strong>-reflector surface should increase <strong>the</strong> sensitivity at 10 GHz from 1.37 K/Jy to<br />
1.47 K/Jy.<br />
The old and <strong>new</strong> sensitivities are given in Table 3.1. An obvious increase is visible at<br />
all wavelength specially at <strong>the</strong> higher frequencies above 8GHz. However, for e.g, 32 GHz<br />
a sensitivity <strong>of</strong> <strong>about</strong> 1.0 K/Jy would be expected from <strong>the</strong> surface rms, but it is currently<br />
not reached. Fur<strong>the</strong>r test to solve this discrepancy are planned (see Sect. 4).<br />
The active surface <strong>of</strong> <strong>the</strong> <strong>new</strong> <strong>sub</strong>-reflector shall be able to compensate, at least to<br />
some extend, <strong>the</strong> known deviations <strong>of</strong> <strong>the</strong> main dish from <strong>the</strong> perfect paraboloid and <strong>the</strong><br />
gravitational deformations which appear above and below elevations <strong>of</strong> 32 degrees. At this<br />
elevation <strong>the</strong> panels <strong>of</strong> <strong>the</strong> main dish were adjusted by holography and should provide an<br />
rms <strong>of</strong> <strong>about</strong> 0.55 mm (e.g., Kesteven et al. 2001; Reich & Fürst 1999).<br />
In Figure 3.1 <strong>the</strong> current aperture efficiency as a function <strong>of</strong> elevation at 9mm is<br />
compared with <strong>the</strong> <strong>the</strong>oretical prediction, which was simulated during <strong>the</strong> planing phase<br />
5
3.1. Secondary Focus 6<br />
Table 3.1: Characteristics <strong>of</strong> SFK receivers. Given are <strong>the</strong> beam size, <strong>the</strong> old sensitivity, <strong>the</strong> <strong>the</strong>oretical<br />
<strong>new</strong> sensitivity (using σP = 0.55 mm and σS,<strong>new</strong> = 0.1 mm), <strong>the</strong> measured <strong>new</strong> values, and <strong>the</strong> improvement<br />
in percentage.<br />
ap. eff.<br />
RX Beam Old sens. Theo. sens. New sens. Improv.<br />
[′′] [K/Jy] [K/Jy] [K/Jy] [%]<br />
110 265.3 1.55 1.56 1.57 1<br />
60 147.8 1.55 1.55 1.57 1<br />
36 82.8 1.28 1.52 1.37 7<br />
28 67.6 1.30 1.49 1.47 13<br />
20 50.9 1.05 1.43 1.15 10<br />
13 36.0 0.80 1.25 0.86 7<br />
9 26.2 0.45 1.01 0.66 47<br />
7 20.3 0.35 0.72 0.45 29<br />
0.4<br />
0.38<br />
0.36<br />
0.34<br />
0.32<br />
0.3<br />
0.28<br />
0.26<br />
Antenna efficency 9mm<br />
0.24<br />
10 20 30 40 50 60 70 80 90<br />
elv<br />
measurements<br />
fit<br />
simulated gain<br />
fit scaled<br />
Figure 3.1: Predicted and measured gain-elevation dependence. The shapes <strong>of</strong> <strong>the</strong> two curves agree<br />
perfectly, but <strong>the</strong> current observed efficiency is <strong>about</strong> 15% lower than expected.<br />
<strong>of</strong> <strong>the</strong> <strong>new</strong> system. As mentioned above, <strong>the</strong> total efficency is a bit lower than expected, but<br />
<strong>the</strong> trend with elevation is exactly as it was expected. This proves that <strong>the</strong> current matrix,<br />
which controls <strong>the</strong> <strong>sub</strong>-reflectors active surface compensates quite well <strong>the</strong> known problems<br />
<strong>of</strong> <strong>the</strong> main dish. However future holographic measurements at different elevations would<br />
be desirable to image <strong>the</strong> residual surface errors in order to improve <strong>the</strong> lookup table.<br />
Examples <strong>of</strong> <strong>the</strong> <strong>new</strong> gain curves are shown in Figures C.9 & C.11 (p. 23 ff). A<br />
comparison between all <strong>the</strong> gain curves toge<strong>the</strong>r can be found in Figure 3.2. The 6cm<br />
gain curve displays a strange increase below 20 degrees elevation, which is so far not<br />
understood (see also Sect. 4).<br />
3.1.2 Focus curves<br />
The <strong>new</strong> degrees <strong>of</strong> freedom and <strong>the</strong> many changes (e.g., axis <strong>of</strong>fsets) that were introduced<br />
with <strong>the</strong> installation <strong>of</strong> <strong>the</strong> hexapod drive required <strong>new</strong> measurements <strong>of</strong> <strong>the</strong> focus curves<br />
that control <strong>the</strong> proper focusing <strong>of</strong> <strong>the</strong> telescope. The main contributions to <strong>the</strong> focus<br />
curves come from <strong>the</strong> homology and bending <strong>of</strong> <strong>the</strong> telescope structure. In Figure 3.3 a
3.1. Secondary Focus 7<br />
Gain<br />
1.05<br />
1<br />
0.95<br />
0.9<br />
0.85<br />
0.8<br />
Gain curves Feb 2007<br />
9mm<br />
1.3cm<br />
2cm<br />
2.8cm<br />
3.6cm<br />
6cm<br />
0.75<br />
0 10 20 30 40 50 60 70 80 90<br />
Figure 3.2: New gain curves SFK.<br />
comparison <strong>of</strong> <strong>the</strong> <strong>new</strong> and old focus curves is shown. There is obviously an <strong>of</strong>fset in xlin<br />
which can be easily understood as a position <strong>of</strong>fset between <strong>the</strong> mounting or <strong>the</strong> coordinate<br />
system <strong>of</strong> <strong>the</strong> old and <strong>the</strong> <strong>new</strong> <strong>sub</strong>-reflector. Measurements <strong>of</strong> <strong>the</strong> exact position <strong>of</strong> <strong>the</strong> old<br />
<strong>sub</strong>-reflector with respect to <strong>the</strong> prime focus cabin by MT Mechatronic in 2005 revealed<br />
an <strong>of</strong>fset <strong>of</strong> <strong>about</strong> 12 mm in x for <strong>the</strong> zenith position <strong>of</strong> <strong>the</strong> telescope. This is comparable<br />
with <strong>the</strong> value obtained by <strong>the</strong> astronomical measurements.<br />
More curious seems to be <strong>the</strong> different slope in xlin. Several possibilities could be<br />
responsible for <strong>the</strong> <strong>new</strong> shape:<br />
1. The focus curves were not checked since 30 years and <strong>the</strong> changes could have been<br />
already <strong>the</strong>re before but were never measured.<br />
2. We still have an undetected <strong>of</strong>fset or different slope for <strong>the</strong> tilt vs. elevations <strong>of</strong> <strong>the</strong><br />
<strong>sub</strong>-reflector, which is now compensated by <strong>the</strong> radial shift.<br />
It should be possible to check all points with <strong>the</strong> ongoing measurements <strong>of</strong> <strong>the</strong> focus<br />
curves for <strong>the</strong> prime focus receivers. The “advantage” <strong>of</strong> <strong>the</strong> primary focus is that <strong>the</strong><br />
positions <strong>the</strong>re should be independent <strong>of</strong> <strong>the</strong> tilt around <strong>the</strong> axes. We can <strong>the</strong>refore work<br />
with only three variables, xlin, ylin, and zlin (see Figure 2.1). In addition <strong>the</strong> position in<br />
ylin should be independent <strong>of</strong> <strong>the</strong> elevation.<br />
After measuring <strong>the</strong> prime focus curve for xlin it should be possible to use this xlincurve<br />
also for <strong>the</strong> secondary focus and adjust only <strong>the</strong> residual elevation dependence using<br />
<strong>the</strong> tilt, yrot. In <strong>the</strong> same manner <strong>the</strong> y-position <strong>of</strong> <strong>the</strong> prime focus can be used to adjust<br />
xrot once for <strong>the</strong> receivers close to <strong>the</strong> optical axes. Afterwards <strong>the</strong> y-position can be<br />
adjusted for <strong>the</strong> receivers fur<strong>the</strong>r <strong>of</strong>f <strong>the</strong> optical axis (3.6, 2, 1.3, and 0.7 cm). More details<br />
<strong>about</strong> <strong>the</strong> prime focus measurements can be found in Sect. 3.2 (p. 8). The formulas to<br />
calculate <strong>the</strong> focus positions are as follows:<br />
yrot = F6 · cos(ELV )<br />
−xlin = F1 · cos(ELV ) + F2 − 1961 · (1 − cos(yrot)) − 3290 · sin(yrot)<br />
−zlin = F3 · cos(ELV ) + F4 · sin(ELV ) + F5<br />
+1961 · sin(yrot) + 3290 · (1 − cos(yrot))
3.2. Primary Focus 8<br />
y-rot [arcmin] & x-lin, z-lin [mm]<br />
140<br />
120<br />
100<br />
80<br />
60<br />
40<br />
20<br />
Comparision <strong>of</strong> old and <strong>new</strong> focus curves<br />
0<br />
0 10 20 30 40 50 60 70 80 90<br />
elv [deg]<br />
old FC1<br />
<strong>new</strong> x-lin*(-1)<br />
old FC2<br />
<strong>new</strong> z-lin*(-1)<br />
old FC3<br />
<strong>new</strong> y-rot<br />
Figure 3.3: Comparison <strong>of</strong> <strong>the</strong> <strong>new</strong> and old focus curves. Please note that <strong>the</strong> <strong>new</strong> curves have a different<br />
sign and are multiplied by (−1) to allow a better comparison.<br />
The parameters F1 to F6 for all receivers are given in Table A.1 (p. 14). The different<br />
slope <strong>of</strong> zlin can be mostly attributed to <strong>the</strong> change <strong>of</strong> <strong>the</strong> xlin slope. The present yrot<br />
curve does not significantly differ from <strong>the</strong> old one, but a small <strong>of</strong>fset was introduced at<br />
some point because measurements done with a small positive <strong>of</strong>fset appeared marginally<br />
better. If this <strong>of</strong>fset is correct should be verified by measurements using <strong>the</strong> prime focus<br />
xlin curve. In <strong>the</strong> mean time, when this <strong>report</strong> was already finished, <strong>new</strong> focus formulas<br />
were introduced by J. Schraml. The <strong>new</strong> formulas consider that <strong>the</strong> point around that <strong>the</strong><br />
rotations are performed is now located in <strong>the</strong> vertex <strong>of</strong> <strong>the</strong> <strong>sub</strong>-reflector and not at <strong>the</strong><br />
frame, as for <strong>the</strong> old one. Therewith <strong>the</strong> (1 − cos(yrot)) and sin(yrot) terms have changed,<br />
but <strong>the</strong> consequences <strong>of</strong> this modification are not completely clear yet and will be described<br />
in a second <strong>report</strong> (Bach et al. in prep.). The <strong>new</strong> formulas are show in Sect. 4.<br />
In Figure 3.4 a comparison <strong>of</strong> all xlin SFK receiver curves can be found. The old system<br />
had only two curves with slightly different slopes for high and low frequencies. “High”<br />
and “low” was distinguished at 5 GHz. Since no common xlin focus curve could be found<br />
for all high frequency receiver above 10 GHz individual curves were measured for every<br />
receiver. The trend is <strong>the</strong> same as with <strong>the</strong> old curve that towards higher frequencies <strong>the</strong><br />
xlin curves appear flatter at high elevations. The <strong>of</strong>fsets are due to <strong>the</strong> different positions<br />
<strong>of</strong> <strong>the</strong> receivers in <strong>the</strong> secondary focus cabin. The measured <strong>of</strong>fsets with respect to <strong>the</strong><br />
2.8 cm receiver are listed in Table 3.2. The zlin <strong>of</strong>fsets are due to differences in <strong>the</strong> hight<br />
on <strong>the</strong> receiver in <strong>the</strong> prime focus cabin. The receiver dependent changes <strong>of</strong> xlin and ylin<br />
scale as ∼ 0.005 ∗ θ mm, where θ is <strong>the</strong> angle <strong>of</strong> <strong>the</strong> positions <strong>of</strong> <strong>the</strong> specific receiver from<br />
<strong>the</strong> 2.8 cm receiver seen from <strong>the</strong> prime focus cabin in arcseconds. We note that this is<br />
ongoing work and some <strong>of</strong> <strong>the</strong>se numbers have to be considered as preliminary. More<br />
details will be given in <strong>the</strong> second <strong>report</strong>.<br />
3.2 Primary Focus<br />
Since prime focus receivers will “see” <strong>the</strong> main dish directly a sensitivity improvement or a<br />
better gain elevation dependence is not expected for prime focus observations. Never<strong>the</strong>less<br />
a better performance might be reached due to <strong>the</strong> possibility <strong>of</strong> adjusting <strong>the</strong> receiver in
3.2. Primary Focus 9<br />
x-lin [mm]<br />
20<br />
0<br />
-20<br />
-40<br />
-60<br />
-80<br />
-100<br />
11cm<br />
6cm<br />
3.6cm<br />
2.8cm<br />
2cm<br />
1.3cm<br />
9mm<br />
SFK focus curves x-lin<br />
-120<br />
0 10 20 30 40 50 60 70 80 90<br />
elv [deg]<br />
Figure 3.4: Comparison <strong>of</strong> <strong>the</strong> <strong>new</strong> xlin focus curves for all secondary focus receivers.<br />
Table 3.2: Measured <strong>of</strong>fsets between secondary focus receivers.<br />
RX xlin zlin ylin<br />
[mm] [mm] [mm]<br />
07 −2.0 −0.4 −2.0<br />
09 −5.0 −0.2 0.0<br />
13 −2.0 −0.2 −3.0<br />
20 −2.0 −0.2 −4.0<br />
28 0.0 0.0 0.0<br />
36 −0.5 −2.0 3.0<br />
60 5.0 −27.0 0.0<br />
110 −11.0 −22.0 0.0
3.2. Primary Focus 10<br />
FC3 [arcmin] & FC1, FC2 [mm]<br />
160<br />
140<br />
120<br />
100<br />
80<br />
60<br />
40<br />
20<br />
0<br />
Comparision <strong>of</strong> old and <strong>new</strong> primary focus curves<br />
-20<br />
0 10 20 30 40 50 60 70 80 90<br />
elv [deg]<br />
<strong>new</strong> FC1<br />
’LIST.foci’ u 9:11<br />
old FC1<br />
Figure 3.5: Comparison <strong>of</strong> old and current prime focus curves.<br />
ylin (azimuth direction) and a clear advantage will be <strong>the</strong> installation <strong>of</strong> three or four<br />
receiver boxes which will increase <strong>the</strong> frequency flexibility for prime focus observations.<br />
So far, in <strong>the</strong> prime focus <strong>the</strong> different receivers are not all available at <strong>the</strong> same time.<br />
The primary focus tube can be loaded with one receiver box which <strong>the</strong>n can be driven<br />
into its focus position automatically from <strong>the</strong> control room. This allows to switch from<br />
secondary to primary focus observations within a few minutes. The only restriction is that<br />
<strong>the</strong> telescope has to be pointed at least to 88 ◦ elevation. With <strong>the</strong> <strong>new</strong>ly build receiver<br />
boxes up to four different frequency receivers will fit into <strong>the</strong> prime focus tube allowing<br />
a more flexible scheduling <strong>of</strong> different projects. With this it will be possible to choose<br />
between up to 13 different receivers (9 secondary and 4 primary ones), which are available<br />
constantaneous.<br />
<strong>First</strong> measurements were done at 18 and 21 cm and despite some constant <strong>of</strong>fsets in<br />
xlin and zlin, which agree with <strong>the</strong> <strong>of</strong>fsets found in <strong>the</strong> secondary focus, no changes were<br />
found to <strong>the</strong> previous focus curve. Given <strong>the</strong> low resolution at this long wavelength this<br />
was not surprising. The tilt, yrot, is constantly zero for all prime focus observations.<br />
Fur<strong>the</strong>r measurements were done at 5 cm and 1.3 cm. The old and <strong>the</strong> <strong>new</strong> xlin focus<br />
curves are compared in Figure 3.5. The <strong>of</strong>fset is comparable to <strong>the</strong> secondary focus curve,<br />
but <strong>the</strong> slope did not flatten as much as for <strong>the</strong> prime focus receivers. This could be a hint<br />
that we need to introduce an <strong>of</strong>fset for <strong>the</strong> yrot curve (yrot) for <strong>the</strong> secondary focus curves.<br />
With that we could probably bring <strong>the</strong> primary and secondary xlin curves in agreement.<br />
The 1.3 cm receiver is a beam switch system where <strong>the</strong> two horn positions are separated<br />
by <strong>about</strong> 25 arcsec in azimuth direction. So far this position was fixed, because <strong>the</strong> old<br />
reflector was not movable along <strong>the</strong> azimuth direction. With <strong>the</strong> hexapod system we are<br />
able to move <strong>the</strong> main horn closer to <strong>the</strong> optical axis, resulting in an increase <strong>of</strong> <strong>the</strong><br />
sensitivity by <strong>about</strong> 10 % (see Fig. 3.6).<br />
3.2.1 Multi-Receiver Boxes<br />
The first multi-receiver boxes which could be tested was <strong>the</strong> 1.0/1.9cm box. A <strong>new</strong><br />
21/18cm receiver will be included in this box later. Since <strong>the</strong> horns are not located at <strong>the</strong><br />
centre (optical axis) <strong>the</strong> box has to be rotated and positioned in xlin and ylin in a way that<br />
<strong>the</strong> positions <strong>of</strong> <strong>the</strong> focus curve in xlin will never contradict with <strong>the</strong> driving limits <strong>of</strong> <strong>the</strong>
3.2. Primary Focus 11<br />
T_A [K]<br />
11.2<br />
11<br />
10.8<br />
10.6<br />
10.4<br />
10.2<br />
10<br />
9.8<br />
9.6<br />
9.4<br />
9.2<br />
Test 1.3cm PFK Focus movement in Azimuth April 2, 2007<br />
Max. at y-lin = 11.3mm<br />
-> y0 - 0.5*Horndistance<br />
= 22.5 - 21.6/2 = 11.7mm<br />
T_A (max) / T_A (21.5mm) = 11/10.2 = 1.078<br />
only Elv <strong>sub</strong>scans were used<br />
9<br />
5 10 15 20 25 30<br />
RFC1 = y-lin [mm]<br />
’FITLPA.rfc1’ u 1:9:10<br />
10.2+0.142*x-6.293E-3*x*x<br />
03/04/07<br />
Figure 3.6: Measurements at 1.3cm testing different focus positions along <strong>the</strong> azimuth axis.<br />
hexapod. The limits are at xlin= ±230 mm and ylin = ±180 mm and <strong>the</strong> distances <strong>of</strong> <strong>the</strong><br />
receivers from <strong>the</strong> optical axis are <strong>about</strong> 260 mm with <strong>of</strong>fsets <strong>of</strong> <strong>about</strong> 100 mm in x and<br />
240 mm in y. Since <strong>the</strong> polarization rotation mechanism is used to perform <strong>the</strong> rotation<br />
<strong>the</strong> consequence is that during observations with <strong>the</strong> multi-receiver boxes <strong>the</strong> polarization<br />
angle has to be kept fixed. The values for <strong>the</strong> rotation <strong>of</strong> <strong>the</strong> polarization angle (pol), xlin<br />
and ylin which were found during <strong>the</strong> first test and which fullfill all <strong>the</strong> requirements for<br />
<strong>the</strong> positions in xlin and ylin are given in Table 3.3<br />
Table 3.3: Positional parameters to bring different horns <strong>of</strong> <strong>the</strong> dual-frequency box (1.0/1.9 cm) in to <strong>the</strong><br />
prime focus position. The 18cm receiver is so far not integrated into <strong>the</strong> receiver box and <strong>the</strong>refore <strong>the</strong><br />
given postions are “only” calcuated values.<br />
RX pol [ ◦ ] xlin [mm] ylin [mm]<br />
1.0 cm 340 −226.1 165.0<br />
1.9 cm 68 −223.8 174.0<br />
18 cm 218 −203.8 170.0
Chapter 4<br />
Remaining questions<br />
1. Although <strong>the</strong> 9 mm sensitivity has improved a lot, why do <strong>the</strong> o<strong>the</strong>r secondary focus<br />
receivers above 2.8 cm do not show <strong>the</strong> expected increase in sensitivity?<br />
2. Why is <strong>the</strong> sensitivity at 3.6 cm lower than at 2.8 cm? Can <strong>the</strong> 3.6 cm sensitivity be<br />
increased by fur<strong>the</strong>r adjusting ylin.<br />
3. What causes <strong>the</strong> strange increase <strong>of</strong> <strong>the</strong> 6cm gain curve towards elevations below<br />
20 ◦ ?<br />
4. Can <strong>the</strong> position matrix <strong>of</strong> <strong>the</strong> active surface be improved?<br />
5. It was noticed that <strong>the</strong> foci change with <strong>the</strong> active surface being on or <strong>of</strong>f. It should<br />
be tested if we could provide two sets <strong>of</strong> focus constants depending on <strong>the</strong> status <strong>of</strong><br />
<strong>the</strong> active surface.<br />
The first two points might improve by a fur<strong>the</strong>r adjustment <strong>of</strong> <strong>the</strong> <strong>sub</strong>-reflector in ylin<br />
and xrot. Some <strong>of</strong> <strong>the</strong> problems might have been solved during finishing this <strong>report</strong>. J.<br />
Schraml found out that <strong>the</strong> old focus formulas include correction terms for <strong>the</strong> tilt in elevation<br />
that were special for <strong>the</strong> mechanic realisation and <strong>the</strong> geometry <strong>of</strong> old <strong>sub</strong>-reflector<br />
and are not appropriate anymore. Since <strong>the</strong> tilt around one <strong>of</strong> <strong>the</strong> focus axes has still an<br />
effect on <strong>the</strong> primary focus point which has to be aligned with <strong>the</strong> focal point <strong>of</strong> <strong>the</strong> main<br />
dish, corrections are still needed, but <strong>the</strong> formulas have changed. The <strong>new</strong> formulas have<br />
<strong>the</strong> following form:<br />
yrot = F6 · cos(ELV ) (4.1)<br />
−xlin = F1 · cos(ELV ) + F2 − 2055 · sin(yrot) (4.2)<br />
−zlin = F3 · cos(ELV ) + F4 · sin(ELV ) + F5 (4.3)<br />
−2055 · (1 − cos(yrot)) − 2055 · (1 − cos(xrot))<br />
The parameters F1 to F6 for all receivers have been re-measured recently with <strong>the</strong> <strong>new</strong><br />
formulas. The results with <strong>the</strong> <strong>new</strong> focus curves and <strong>the</strong>ir consequences will be presented<br />
in a second <strong>report</strong> (Bach et al. in prep.).<br />
12
BIBLIOGRAPHY<br />
Kesteven, M., Graham, D., Fürst, E., Lochner, O., & Neidhöfer, J. 2001, The<br />
<strong>Effelsberg</strong> Holography Campaign - 2001, <strong>Effelsberg</strong> Memo, http://www.mpifrbonn.mpg.de/div/effelsberg/advanced<br />
points.html<br />
Reich, W. & Fürst, E. 1999, Kleinheubacher Berichte<br />
13
Appendix A<br />
Focus Parameters<br />
Table A.1 gives all <strong>the</strong> individual values that were measured for <strong>the</strong> focus parameters<br />
shown in <strong>the</strong> equations on page 6.<br />
Table A.1: Focus parameters for different receivers (from Sept. 2007).<br />
RX F1 F2 F3 F4 F5 F6<br />
[mm] [mm] [mm] [mm] [mm] [arcmin]<br />
secondary focus<br />
110 105.8 −13.6 2.6 −9.0 30.3 27.0<br />
60 105.8 2.4 2.6 −9.0 27.1 27.0<br />
36 105.8 −2.6 2.6 −9.0 50.0 27.0<br />
28 103.3 −0.3 2.6 −9.0 54.9 27.0<br />
20 98.5 2.1 2.6 −9.0 52.0 27.0<br />
13 95.7 4.4 2.6 −9.0 54.5 27.0<br />
09 88.4 8.4 2.6 −9.0 51.3 27.0<br />
07 86.7 12.9 2.6 −9.0 52.4 27.0<br />
primary focus<br />
all 138.4 −15.9 −0.3 −15.0 150.7 0<br />
14
Appendix B<br />
Active Surface<br />
Figure B.1 shows <strong>the</strong> adjustment <strong>of</strong> <strong>the</strong> <strong>sub</strong>-reflector panels which should compensate for<br />
<strong>the</strong> deformations that appear in <strong>the</strong> main dish. The values are read by <strong>the</strong> control system<br />
from a look up table provided by MT Mechatronics. Fine tuning <strong>of</strong> <strong>the</strong> adjustments using<br />
test observations with modified look up tables or holographic observations are planed for<br />
<strong>the</strong> near future.<br />
15
elv<br />
elv<br />
elv<br />
10 Grad Elevation<br />
-3 -2 -1 0 1 2 3<br />
azi<br />
40 Grad Elevation<br />
-3 -2 -1 0 1 2 3<br />
azi<br />
70 Grad Elevation<br />
-3 -2 -1 0 1 2 3<br />
azi<br />
3<br />
2<br />
1<br />
0<br />
-1<br />
-2<br />
-3<br />
3<br />
2<br />
1<br />
0<br />
-1<br />
-2<br />
-3<br />
3<br />
2<br />
1<br />
0<br />
-1<br />
-2<br />
-3<br />
1000<br />
500<br />
0<br />
-500<br />
-1000<br />
1000<br />
500<br />
0<br />
-500<br />
-1000<br />
1000<br />
500<br />
0<br />
-500<br />
-1000<br />
elv<br />
elv<br />
elv<br />
20 Grad Elevation<br />
-3 -2 -1 0 1 2 3<br />
azi<br />
50 Grad Elevation<br />
-3 -2 -1 0 1 2 3<br />
azi<br />
80 Grad Elevation<br />
-3 -2 -1 0 1 2 3<br />
azi<br />
3<br />
2<br />
1<br />
0<br />
-1<br />
-2<br />
-3<br />
3<br />
2<br />
1<br />
0<br />
-1<br />
-2<br />
-3<br />
3<br />
2<br />
1<br />
0<br />
-1<br />
-2<br />
-3<br />
1000<br />
500<br />
0<br />
-500<br />
-1000<br />
1000<br />
500<br />
0<br />
-500<br />
-1000<br />
1000<br />
500<br />
0<br />
-500<br />
-1000<br />
elv<br />
elv<br />
30 Grad Elevation<br />
-3 -2 -1 0 1 2 3<br />
azi<br />
60 Grad Elevation<br />
-3 -2 -1 0 1 2 3<br />
azi<br />
90 Grad Elevation<br />
-3 -2 -1 0 1 2 3<br />
Figure B.1: Shown are <strong>the</strong> positions <strong>of</strong> <strong>the</strong> <strong>sub</strong>-reflector panels in microns for different elevations starting<br />
from 10 ◦ (top-left) to 90 ◦ (bottom-right). The main dish is optimized for 32 ◦ and <strong>the</strong>refore deviations<br />
appear mainly and much lower and much larger elevations.<br />
elv<br />
azi<br />
3<br />
2<br />
1<br />
0<br />
-1<br />
-2<br />
-3<br />
3<br />
2<br />
1<br />
0<br />
-1<br />
-2<br />
-3<br />
3<br />
2<br />
1<br />
0<br />
-1<br />
-2<br />
-3<br />
1000<br />
500<br />
0<br />
-500<br />
-1000<br />
1000<br />
500<br />
0<br />
-500<br />
-1000<br />
1000<br />
500<br />
0<br />
-500<br />
-1000<br />
16
Appendix C<br />
Observations<br />
This section summarizes <strong>the</strong> performed observations, which were necessary to obtain <strong>the</strong><br />
<strong>new</strong> focus curves.<br />
C.1 Update <strong>of</strong> old Focus Curves<br />
The first measurements were done without any automatic control <strong>of</strong> <strong>the</strong> focus positions<br />
and <strong>the</strong> focus was adjusted by hand using <strong>the</strong> old tabulated focus curves for 5 degrees<br />
steps on elevation. An example how de-focused cross scans look like is given in Figure C.1.<br />
In Figure C.2 ano<strong>the</strong>r strongly de-focused 9 mm scan is shown. At some point in<br />
addition to <strong>the</strong> coma also a noticeable deviation from a Gaussian pr<strong>of</strong>ile is visible.<br />
Since <strong>the</strong> pointing depends strongly on <strong>the</strong> radial focus parameters <strong>the</strong> first adjustments<br />
were all done by hand. For this, bright sources were tracked for a long time over<br />
many different elevations and <strong>the</strong> focus parameters were changed until a symmetric pr<strong>of</strong>ile<br />
was found. Additional parameters to judge over <strong>the</strong> best focus parameters were obviously<br />
<strong>the</strong> amplitude and <strong>the</strong> width <strong>of</strong> <strong>the</strong> cross scan. However for shorter wavelength where <strong>the</strong><br />
cross scan results depend more strongly on elevation and wea<strong>the</strong>r <strong>the</strong> direct comparison <strong>of</strong><br />
scans becomes more difficult. With <strong>the</strong> resulting rough focus curves and <strong>the</strong> adjustment<br />
<strong>of</strong> <strong>the</strong> pointing model to this curves, automatic procedures could be used to obtain more<br />
accurate focus curves. Automatic focus procedures exist for xlin, zlin, and yrot, and are<br />
called: focus, rfocus, and kfocus respectively. The focus and rfocus procedures work quite<br />
well but <strong>the</strong> kfocus for <strong>the</strong> tilt is very insensitive and requires large driving ranges, which<br />
is again problematic since <strong>the</strong> tested focus position could be <strong>of</strong>f source and <strong>the</strong> compared<br />
focus position correspond just to <strong>the</strong> noise left and right <strong>of</strong> <strong>the</strong> source.<br />
In addition to <strong>the</strong> cross scans, beam calibration maps were done. The maps allow a<br />
closer examination <strong>of</strong> <strong>the</strong> symmetry <strong>of</strong> <strong>the</strong> beam pattern. Long sequences <strong>of</strong> calibration<br />
maps for various <strong>of</strong>fsets for <strong>the</strong> different focus parameters were done around our best fit<br />
models from <strong>the</strong> cross scans and on most cases <strong>the</strong> symmetry was already very good.<br />
Examples <strong>of</strong> beam calibration maps are given in Figure C.3.<br />
C.2 New Parameters<br />
The control <strong>of</strong> <strong>the</strong> focal position along <strong>the</strong> azimuth direction is a <strong>new</strong> degree <strong>of</strong> freedom.<br />
The old <strong>sub</strong>-reflector was fixed in this direction. Figure C.4 shows a test for various<br />
positions along <strong>the</strong> radial azimuth shift y at 5cm from <strong>the</strong> prime focus. The advantage <strong>of</strong><br />
focal measurements from <strong>the</strong> prime focus is that <strong>the</strong> tilt <strong>of</strong> <strong>the</strong> <strong>sub</strong>-reflector is negligible.<br />
17
C.2. New Parameters 18<br />
6.0<br />
5.0<br />
4.0<br />
3.0<br />
2.0<br />
1.0<br />
0.0<br />
6.0<br />
5.0<br />
4.0<br />
3.0<br />
2.0<br />
1.0<br />
0.0<br />
1537 1 1<br />
1531 1 1<br />
3C295<br />
300.0 0.0 -300.0<br />
3C295<br />
300.0 0.0 -300.0<br />
Figure C.1: Two radial de-focused cross scans in azimuth. Depending on <strong>the</strong> direction <strong>of</strong> <strong>the</strong> de-focusing<br />
a coma appears left or right <strong>of</strong> <strong>the</strong> main beam. Top: Taken with a too high value for ylin.Bottom: Taken<br />
with a too low value for ylin.<br />
"<br />
"
C.2. New Parameters 19<br />
8523 1 1<br />
3.2 2.956<br />
-0.529<br />
31.341<br />
2.4<br />
1.6<br />
0.8<br />
0.0<br />
3C84<br />
80.0 0.0 -80.0<br />
Figure C.2: Strongly de-focused elevation scan. Not only <strong>the</strong> coma but also a clear deviation from <strong>the</strong><br />
Gaussian pr<strong>of</strong>ile is also visible.<br />
Figure C.3: Three calibration maps obtained at different elevation and with different SFC1 <strong>of</strong>fsets. Left:<br />
3C286 at 62 ◦ elevation and SFC1 = 8. The sou<strong>the</strong>rn side lobe seems stronger, which means that <strong>the</strong> <strong>of</strong>fsets<br />
is too large. Middle 3C84 at 78 ◦ elevation and SFC1 = 0. The nor<strong>the</strong>rn side lobe appears stronger, which<br />
means that <strong>the</strong> <strong>of</strong>fsets is too small. Right: 3C 84 at 76 ◦ elevation and SFC1 = 4; looks quite symmetric.<br />
"
C.3. Multi-Frequency Boxes 20<br />
S_norm<br />
1.03<br />
1.02<br />
1.01<br />
1<br />
0.99<br />
0.98<br />
0.97<br />
0.96<br />
0.95<br />
5cm pri RFC1 Test<br />
10 15 20 25 30 35 40 45 50 55<br />
RFC1 [mm]<br />
’FOC.3C295’ u 10:4:5<br />
f(x)<br />
Figure C.4: Relative amplitude <strong>of</strong> cross scans taken at different ylin positions at 5cm (prime focus).<br />
Figures C.5 & C.6 show measurements at 3.6 cm and 2 cm which were performed to<br />
find <strong>the</strong> optimal combination <strong>of</strong> ylin and xrot to better illuminate <strong>the</strong> receivers fur<strong>the</strong>r<br />
away from <strong>the</strong> optical axis <strong>of</strong> <strong>the</strong> secondary focus. There is a measurable increase at both<br />
frequencies: The best value for 3.6 cm for a constant xrot <strong>of</strong> 17 arcmin seems to be ylin =<br />
26 mm and at 2cm ylin = 19 mm. The current default is 22.5 mm.<br />
C.3 Multi-Frequency Boxes<br />
Figures C.7 & C.8 show <strong>the</strong> test observations which were done to position <strong>the</strong> 1.9 cm<br />
receiver <strong>of</strong> <strong>the</strong> <strong>new</strong> prime focus multi-frequency box along <strong>the</strong> optical axis. In an iterative<br />
process <strong>the</strong> xlin and ylin positions were adjusted and a polarization rotation was performed<br />
to avoid possible conflicts with <strong>the</strong> driving range limits <strong>of</strong> <strong>the</strong> hexapod.<br />
C.4 New Gain Curves<br />
As two examples <strong>the</strong> gain curves and sensitivities <strong>of</strong> <strong>the</strong> 9mm and <strong>the</strong> 2.8cm secondary<br />
focus receivers are shown (Fig. C.9 to C.12). The o<strong>the</strong>r gain curves can be found on <strong>the</strong> <strong>Effelsberg</strong><br />
web pages (see http://www.mpifr-bonn.mpg.de/div/effelsberg/receivers/<br />
receiver.html).
C.4. New Gain Curves 21<br />
S_norm<br />
1.06<br />
1.04<br />
1.02<br />
1<br />
0.98<br />
0.96<br />
0.94<br />
0.92<br />
0.9<br />
0.88<br />
5<br />
10<br />
15<br />
20<br />
normalized flux 3.6cm vs RFC1 and 2<br />
25<br />
RFC1 [mm]<br />
30<br />
35<br />
40<br />
45<br />
50 0<br />
5<br />
’LIST.foci’ u 14:15:6<br />
35<br />
30<br />
25<br />
20<br />
15 RFC2 [mm]<br />
10<br />
Figure C.5: Relative amplitude <strong>of</strong> cross scans taken at different ylin and xrot positions for 3.6 cm.<br />
S_norm<br />
1.06<br />
1.04<br />
1.02<br />
1<br />
0.98<br />
0.96<br />
0.94<br />
0.92<br />
0.9<br />
0.88<br />
-10<br />
0<br />
10<br />
20<br />
RFC1 [mm]<br />
normalized flux at 2cm vs RFC1 and 2<br />
30<br />
40<br />
’LIST.foci’ u 14:15:6<br />
60<br />
50<br />
40<br />
30<br />
20<br />
10<br />
0 RFC2 [mm]<br />
-10<br />
-20<br />
50 -30<br />
Figure C.6: Relative amplitude <strong>of</strong> cross scans taken at different ylin and xrot positions for 2 cm.<br />
1.06<br />
1.04<br />
1.02<br />
1<br />
0.98<br />
0.96<br />
0.94<br />
0.92<br />
0.9<br />
0.88<br />
1.06<br />
1.04<br />
1.02<br />
1<br />
0.98<br />
0.96<br />
0.94<br />
0.92<br />
0.9<br />
0.88
C.4. New Gain Curves 22<br />
I/<br />
1.15<br />
1.1<br />
1.05<br />
1<br />
0.95<br />
0.9<br />
peak at -4.78<br />
normalized flux vs. x-lin for different y-lin<br />
0.85<br />
-6 -4 -2 0 2 4 6<br />
x-lin [mm]<br />
Figure C.7: Relative amplitude <strong>of</strong> cross scans taken at different xlin and ylin positions to optimize <strong>the</strong><br />
position <strong>of</strong> <strong>the</strong> 1.9 cm receiver from <strong>the</strong> multi-frequency box at <strong>the</strong> prime focus.<br />
I/<br />
1.15<br />
1.1<br />
1.05<br />
1<br />
0.95<br />
0.9<br />
0.85<br />
peak at 163.1<br />
normalized flux vs. y-lin for different x-lin<br />
170.0<br />
167.5<br />
165.0<br />
162.5<br />
160.0<br />
170.0<br />
167.5<br />
165.0<br />
162.5<br />
160.0<br />
f(x)<br />
160 162 164 166 168 170<br />
y-lin [mm]<br />
Figure C.8: Relative amplitude <strong>of</strong> cross scans taken at different xlin and ylin positions to optimize <strong>the</strong><br />
position <strong>of</strong> <strong>the</strong> 1.9 cm receiver from <strong>the</strong> multi-frequency box at <strong>the</strong> prime focus.<br />
-5.0<br />
-2.5<br />
0.0<br />
2.5<br />
5.0<br />
-5.0<br />
-2.5<br />
0.0<br />
2.5<br />
5.0<br />
f(x)
C.4. New Gain Curves 23<br />
Gain<br />
Sensitivity [K/Jy]<br />
1.05<br />
1<br />
0.95<br />
0.9<br />
0.85<br />
0.8<br />
0.75<br />
0.7<br />
0.65<br />
0.6<br />
0.55<br />
0.7<br />
0.65<br />
0.6<br />
0.55<br />
0.5<br />
0.45<br />
0.4<br />
0.35<br />
0.3<br />
0.25<br />
Gain curve 9mm secondary focus Feb 2007<br />
10 20 30 40 50 60 70 80 90<br />
Elevation [˚]<br />
Figure C.9: Old and <strong>new</strong> gain curve at 9mm.<br />
Gain curve 9mm secondary focus Feb 2007<br />
data<br />
<strong>new</strong> fit<br />
old g.c.<br />
10 20 30 40 50 60 70 80 90<br />
Elevation [˚]<br />
Figure C.10: Old and <strong>new</strong> sensitivity at 9mm.<br />
<strong>new</strong><br />
old
C.4. New Gain Curves 24<br />
Gain<br />
Sensitivity [K/Jy]<br />
1.01<br />
1<br />
0.99<br />
0.98<br />
0.97<br />
0.96<br />
0.95<br />
0.94<br />
0.93<br />
Gain curve 2.8cm Feb 2007<br />
A0=0.9900 A1=0.8249E-3 A2=-1.7433E-5<br />
0.92<br />
0 10 20 30 40 50 60 70 80 90<br />
1.5<br />
1.45<br />
1.4<br />
1.35<br />
1.3<br />
Elevation [deg]<br />
’gain.dat’ u 8:($4*1.002)<br />
old<br />
<strong>new</strong><br />
Figure C.11: Old and <strong>new</strong> gain curve at 2.8cm.<br />
Gain curve 2.8cm Feb 2007<br />
1.25<br />
0 10 20 30 40 50 60 70 80 90<br />
Elevation [deg]<br />
Figure C.12: Old and <strong>new</strong> sensitivity at 2.8cm.<br />
old<br />
<strong>new</strong>


