
You also want an ePaper? Increase the reach of your titles
YUMPU automatically turns print PDFs into web optimized ePapers that Google loves.
minutesMEETING TITLE:DATE AND TIME:LOCATION:ATTENDEES:South Bay Kick-off <strong>Meeting</strong> and WorkshopApril 25, 2013, 1:00 pm – 5:00 pm PDTSanta Clara Valley Water District, Headquarters Building Board RoomSee AttachedI. Welcome & Introductions – Kathy Schaefer/<strong>FEMA</strong> and Ann Draper/SCVWDMs. Kathy Schaefer, <strong>FEMA</strong> <strong>Region</strong> IX San Francisco Bay Area Coastal (BAC) Study Manager,kicked off the meeting with a statement noting that approximately one year ago <strong>FEMA</strong> met with theUS Army Corps of Engineers (USACE) for a similar South Bay meeting with the communities andother agencies. For this year’s follow-up meeting, there are even more organizations and agencieswith San Francisco Bay coastal study and risk awareness efforts underway in the South Bay. TheSouth Bay Kick-off meeting was set up to share information and kick off <strong>FEMA</strong>’s BAC Study forSan Mateo and Santa Clara counties.Ms. Schaefer introduced Kris May, BakerAECOM BAC Project Manager and Ann Draper, SantaClara Valley Water District, and workshop attendees were invited to introduce themselves.Following introductions, Ms. Draper thanked attendees for their participation and noted that she wasboth pleased and overwhelmed at the interest in the subject matter.The notes that follow provide a context for the nine presentations that were given during thisworkshop and two Q&A sessions. Links to PDF copies of these presentations hosted on thewww.r9coastal.org website are provided within the titles of each presentation.II.<strong>FEMA</strong>’s San Francisco Bay Area Coastal Study – Kathy Schaefer/<strong>FEMA</strong> and Kris May/AECOMMs. Schaefer prefaced the BAC Study presentation with a story from the 2012 Annual FloodplainManagement Association conference. A representative for a multi-national, multi-billion dollartechnology firm asked her for projected base flood elevations in the South Bay from the BAC Study.Ms. Schaefer re-framed the question, noting that this person was representing a major firm, andsuggested that they should be preparing for much more than the one-percent-annual chance flood.Ms. Schaefer used this analogy to note that the reason <strong>FEMA</strong> was presenting at the South Bayworkshop was to help frame how the communities in the South Bay should be using the informationfrom the BAC Study within the multi-billion dollar area of the South Bay. The information from theBAC Study should be used as a starting point for discussing flood risk and/or resilience planning –not as the ending point.1
minutesMs. Schaefer spoke to the first few slides of her presentation, noting the meeting objectives whichincluded an overview of the National Flood Insurance Program and Risk MAP, an introduction to theBAC Study, the study process and methodology, and a discussion of how the <strong>FEMA</strong> mappingproducts could be used to inform decisions to reduce risk. She noted that she was glad there are somany communities participating to benefit from the information.Ms. Schaefer noted that the 1-percent-annual chance flood should just be a starting point for planningin the South Bay and went on to state that the vision of <strong>FEMA</strong>’s Risk MAP program is to plan for thefuture. The funding for Risk MAP included a mandate that <strong>FEMA</strong> map 100% of the populated coastin the United States. The BAC Study covers 100% of Bay Area coastal communities. Ms. Schaeferprovided a brief history of the BAC Study, including previous contractors and their roles.A schedule slide was provided and Ms. Schaefer noted that <strong>FEMA</strong> studies are, by design, very slowand deliberate. The phases of the mapping process were discussed and it was noted that the revisedregulatory Flood Insurance Rate Map panels for Santa Clara and San Mateo County will likelybecome effective in 2015/2016.Dr. May explained the data acquisition aspects of the BAC Study, which were part of the larger effortwhich began in 2004. <strong>FEMA</strong> commissioned new LiDAR data in 2004 that had formed the basis ofthe topographic data sets for the BAC Study for several years. However, <strong>FEMA</strong> acquired newerLiDAR from USGS and NOAA in 2010 that provides complete coverage for 100% of the coastalcommunities. This is a high resolution, complete data set.She then presented the factors (seas, surge, swell) that contributed to the completion of the South Bayregional modeling and expressed excitement to have dates for San Mateo and Santa Clara counties,noting that last March at the previous South Bay meeting it was all to be determined. As of today,<strong>FEMA</strong> is in the engineering analysis phase. There are some counties much farther along, however inthe South Bay the Study is still at the beginning.Dr. May explained that DHI led the hydrodynamic modeling. She stated that seas contributed moresignificantly in South Bay. Swell results from waves that propagate through the Golden Gate Bridgeand were determined to be insignificant in the South Bay. As a result, swell was dropped from theanalysis which allowed <strong>FEMA</strong> to increase the hindcast of hydrodynamics from a 31-year continuousmodel simulation to a 54-year continuous simulation. The North and Central Bay regions study relyon the original 31-year simulations, with the inclusion of swells.The regional modeling data provides the boundary conditions for the 1-D overland wave modeling.WHAFIS is the primary tool for flatter topographies (i.e. marshes, ponds, parking lots), and waverunup analyses are performed on steeper topographies (i.e., levees, structures, hills, bluffs). <strong>FEMA</strong>’sProduction and Technical Services contractor, BakerAECOM conducted the transect-based analysis2
minutesincluding wave runup, wave overtopping, and wave propagation. Dr. May provided additional detailon wave propagation versus wave run.<strong>FEMA</strong>’s flood zones and vertical datum were explained in relation to draft floodplain mapping, i.e.Zone VE 11 conveys a wave hazard of 11 feet North American Vertical Datum of 1988 (NAVD88).With higher topography there are wave hazards due to run up only (VE zone) versus an area wherethere is also overland wave propagation behind the run up area resulting in an AE zone.Dr. May explained that there are unique challenges in the South Bay. The salt pond areas provide asignificant amount of flood protection; however, <strong>FEMA</strong> mapping specifications do not explictlyaddress the unique structures that exist in the South Bay. As part of kicking off the South Bay effort,<strong>FEMA</strong>’s contractors have been reviewing South Bay modeling to determine modeling approachesthat account for the presence of ponds in the analysis. This process is in development and specificswill be available for discussion in the future.<strong>FEMA</strong> will provide an online work map tool for communities to review work maps at the draft stage.This tool is being made available to help local officials better understand flood risk in theircommunities.Wendy Chang presented BAC Study outreach efforts including tools and materials available from theoutreach tab of the website www.r9coastal.org. There will be additional Risk MAP meetingstentatively scheduled for spring 2014 and winter 2015. Additionally, attendees were encouraged tosign up for the coastal e-bulletin, Coastal Beat, from the aforementioned website.III.Our Coast-Our Future: Planning for Sea Level Rise and Storms in the SF Bay Area – KelleyHiggason/NOAA – Decision Support tool to visualize, plan and support Sea Level RiseAdaptationThe goal of Our Coast-Our Future (OCOF) is to provide science-based, decision support tools to helpunderstand, visualize, and anticipate coastal climate change impacts to Bay Area communities andecosystems. Objectives include modeling vulnerabilities to sea level rise and storm hazards,assessing stakeholder information needs (via three scoping workshops, two outer coast focus groupsand quarterly SF Bay advisory committee meetings), and mapping vulnerabilities at an appropriatescale for management.The project was initiated in 2010 along the outer central California coast and expanded in 2011 withadditional funding to include the geographic scope of San Francisco Bay, expand model inputs, and toadditional technical assistance, partnerships and outreach. Technical assistance for communities thatneed support for planning processes for the Marin outer coast will also be provided within the nextfew years.3
minutesKelly Higgason explained the adaptation planning process for OCOF from assessment to planning toimplementation (slide 6) and then proceeded to orient attendees to the free online mapping tool thatmaps vulnerability at an appropriate scale for management and planning at the community level. Thetool is available at www.prbo.org/ocof and a YouTube tutorial is also available for site orientation.Ms. Higgason reviewed the interactive tools tab view and navigated the tool to show options forvarying levels of storms, sea level rise increments (0 - 200 cm). She explained that the map is meantto be used like a Google map. She also explained symbology and uncertainty (+ or – 60 cm) anddemonstrated the ability to draw a report around an area of interest. The report includes all 40 stormscenarios and percents for the area selected and an image of the area selected. There is also thecapability to add local GIS files and create reports inclusive of local GIS data.Ms. Higgason demonstrated the forum available under the interactive tools tab and encouragedattendees to post questions and dialogue.IV.Our Coast-Our Future: Modeling SF Bay flooding with Coastal Storm Modeling System(CoSMoS) – Patrick Barnard/USGSDr. Patrick Barnard initiated his presentation by providing three levels of Bay-wide vulnerabilityefforts ordered as follows:NOAA SLR viewer – This is a screening tool that only considers SLR and tide however it isa slick and useful tool to get started on climate change. It is a passive model that doesconsider hydrologic connectivity, includes excellent elevation data (including the 2010LiDAR) and datum control, a wetland migration model and socioeconomic impacts.USGS (Knowles) – Global climate model-forced water levels are used to simulate a 100-yearhydrodynamic projection through 2100. The data available from this effort only includesstatic sea level rise above mean higher high water and 100-year flood events. Floodingextents are based on a bathtub model, wind and waves are not considered and levees areignored. This effort does not utilize the latest 2010 LiDAR.Our Coast-Our Future (OCOF) – The Coastal Storm Modeling System (CoSMoS) uses globalclimate model ensembles, includes wind, waves, sediment transport, fluvial discharge, andvertical land movement rates, includes a range of sea level rise and storm scenarios andflooding extent is explicitly modeled. This effort does leverage the latest 2010 LiDAR andthe best available bathymetric data.CoSMoS identifies future risk by using a series of global climate change models to develop a timeseries of boundary conditions and model forcings thru 2100. This time series is used to drive globaland regional wave models and that are scaled down to develop local hazard projections.Why was this model created? To account for the interdependent physics of the components thatcontribute to total water level predictions (e.g. wave runup, set up, storm surge, seasonal effects4
minuteswhich can be up to 30 cm, tide difference, SLR) and also the potential of very large floods comingfrom Delta which can raise total water levels by an additional half meter.Dr. Barnard noted that OCOF and <strong>FEMA</strong>’s BAC Study are similar in that they both account for thevarious components of coastal vulnerability. CoSMoS Version 1.0 was focused in SouthernCalifornia, providing inundation extents associated with a January 2010 storm event coupled with2050 (0.5 m) and 2100 (1.4 m) of sea level rise. CoSMoS Version 2.0 is focused in Central/NorthernCalifornia and is a collaborative effort with NOAA, PRBO Conservation Science, and NPS. Itfocuses on climate change impacts along the outer coast and SF Bay, and accounts for stormscenarios and sea level rise developed using the latest IPCC radiative forcing scenarios and globalclimate models. It also includes key in-Bay considerations such as fluvial discharge (i.e. Delta andCoyote Creek), downscaled winds, marsh accretion, and relative land movement. It was noted thatsome areas have subsidence rates of 2 mm/year.The online tool shows flooding extent and uncertainty. Dr. Barnard stated that from his perspectiveall models are wrong and the flooding extents depicted should not be viewed as absolute predictions.The flooding extents should be used as guide for planning purposes, and the appropriate range ofstorm scenarios and sea level rise amounts should be considered as appropriate.It was noted that CoSMoS is using IfSAR data for vertical land motion. Dr. Barnard went on toaddress several highlights for the SF Bay (slide10) before providing a CoSMoS scenario summary, asfollows:January 2010 and March 2011 storm hindcasts testing and validationGlobal wave modeling: 2 emissions scenarios, 4 Global Climate ModelsMax water level conditions = daily, annual, 20 and 100-year return interval eventsSLR scenarios = 0 to 2 m in 25 cm increments, and 5 m extreme scenarioTotal of 40 future scenarios of SLR and storm conditionsThe SF Bay completion is planned for summer 2014. There is a new Southern California project proposedfor 2013-2015. CoSMoS is also used as a real-time warning system for emergency managers, lifelineoperators, and resource managers. This is an internal USGS project that helps drive ongoing research anddevelopment of this modeling system.V. Silicon Valley 2.0 – Demetra McBride/Santa Clara County & Culley Thomas/AECOMThe Silicon Valley 2.0 project was initiated because climate change threatens the livelihood of thousandsof people in the Silicon Valley. Impacts to human, natural, and financial capital were identified. Theintent of this Silicon Valley 2.0 project is to address the potential impacts and plan for regional resiliency.5
minutesA wide spectrum of climate variables were discussed (slide 6) including sea level rise and temporaryflooding. Exposed community assets were itemized by categories of infrastructure, populations, andlandscapes. Examples of regional climate change threats were discussed including sea level rise,decreased stream runoff, decreased Sierra snowpack, wildfire, and increased temperature. Slide 9 and 10presented maps depicting wildfire threat to infrastructure for 2000 versus 2100, respectively. Subsequentslides presented maps noting decreased runoff threat to habitat (i.e. steelhead trout), sea level rise to roads(presently and with varying increments of water elevations).The Silicon Valley 2.0 project aims to produce a framework and strategic plan to help promote regionalresiliency. The primary outputs will include a <strong>Region</strong>al Climate Change Adaptation Plan (including thepriority threats to communities) and tools and guidelines to provide decision support for future planningefforts.The core Silicon Valley 2.0 project initiatives are listed as follows:evaluate regional exposures and risksidentify potential resiliency strategiesunderstand existing decision processes and where climate change resiliency can fit indevelop decision-support tools and guidelinesfacilitate communications and governance structures related to climate change resiliencyIt was acknowledged that this project faces complex issues, that there are multiple actors, and decisionmaking processes. Engagement of multiple actors is required to create robust regional resiliency and itwill take communication between all the actors (slide 19).Key components of the project schedule were itemized on slide 24 starting with science review and datacollection (December 2012) through decision support tools and guidelines planned for April 2013 – May2014.Project participation opportunities include a May 2013 kick-off meeting, a climate change risk assessmentreview (July 2013), and tool development and adaptation strategy review in September 2013. Technicaladvisory meetings are scheduled for June, August, and September 2013.VI.Discussion / Q&A/ BreakQ: A workshop attendee from Citizens Committee to Complete the Refuge asked two questions asfollows: 1) is the modeling that has been done just extreme storms or a series of storms that equate toaccumulated risk? 2) is the modeling looking at low lying areas inclusive of subsided areas and wetlandsand addressing the response of these systems to localized flooding?6
minutesA: Patrick Barnard answered that a full range of storm scenarios is considered in the CoSMoS model, butnot consecutive storms and there is no sediment transport explicitly incorporated. In response to thesecond question, CoSMoS is not scoped to do this.A: Kris May – <strong>FEMA</strong> studies the 100-year flood (or the one percent annual chance flood) and does notstudy sea level rise, which is why Patrick’s work is important. <strong>FEMA</strong> is not looking at successive storms,just response-based flooding associated with the 1-%-annual-chance flood.Q: An attendee from the League of Woman Voters asked about topography and land subsidence andwhether we can incorporate earthquake data into topography.A: Patrick Barnard – OCOF is working with Tom Parsons (USGS) and has raised this question aboutvertical land motion. Subsidence is fairly insignificant comparatively, but liquefaction is an issue andvery hard to model. There’s a possibility of maybe at least doing some sensitivity modeling to determinewhere liquefaction might occur and how to appropriately manage risk.Q: There was a question on levee strength and standards?A: Patrick Barnard/OCOF –<strong>FEMA</strong> recognizes (i.e., accredits) certified levees only on <strong>FEMA</strong> maps,however there are more levees throughout the Bay Area that are not accredited structures. OCOFassumes levees would likely breach, but does not do geotech analysis which is part of the accreditationprocess.A: Kris May/BakerAECOM noted that all levees and berms, such as the salt pond berms, are included inthe analysis. However, if a levee is not accredited by <strong>FEMA</strong>, it is assumed that the structure or bermwould not provide protection and the flood waters would propagate behind the structure. The structure orberm would still provide wave dissipation for the new wave analyses, but it is assumed that it would notprotect from a 1% annual chance flood. The <strong>FEMA</strong> accreditation process is a separate process led by thecommunity that includes geotechnical details on levee strength and stability, etc., but this type ofinvestigation is outside the scope of the <strong>FEMA</strong> coastal study.VII.South Bay Salt Pond Restoration Project - John Bourgeois/Coastal ConservancyIn the past 150 years, the Bay Area lost a significant amount of its wetlands. In many areas, the wetlandswere converted to salt ponds which were used to produce salt through evaporation. The berms that keepwater inside the ponds for salt evaporation are not accredited levees, they are really just piled up bay mud,however they absolutely serve as flood and shoreline protection. Many of the ponds are now beingrestored and they are no longer used to produce salt, and these ponds provide significant ecosystembenefits. The wetlands and ponds in and around San Francisco Bay provide habitat for fish and wildlife,water quality improvement, flood storage, shoreline protection, and recreation. The San Francisco Bayhosts millions of shorebirds and migratory boards, and is also surrounded by 7.5 million people, so it isimportant for people as well.7
minutesThe South Bay Salt Pond Restoration Project was initiated 10 years ago as a private public partnership toacquire 16,500 acres (15,100 in the South Bay, 1,400 along the Napa River) at a cost of $100 millionshared by State, Foundations and Federal dollars. Mr. Bourgeois displayed a detailed map of the SouthBay (slide 8) depicting areas acquired, noting that there are two different land owners and the areas areadjacent to many municipalities, and stated that the area is equivalent in size to Manhattan.Next year the Project will finish the last Phase 1 project which is not just habitat restoration but has alsohelped to create trails that get people out into the environment appreciating the natural ecosystemfeatures. Taking down the pond embankments (berms) allows for tidal restoration and helps to restoreecosystem benefits, however it also has flood management implications.San Francisco Bay features were explained on slide 15 of the presentation and lead to a slide with imagesfrom Alviso flooding in 1983. Flood risk and sea level rise in the South Bay (slide 17) affects not justhomes and schools - this area is also home to a significant business community. Mr. Bourgeois shows anartist rendition of a post-Hurricane Sandy wetlands recommendations for Manhattan. While this may notbe realistic for NY, we have the opportunity to make this a reality in the South Bay due to the presence ofthe extensive salt ponds. He stated that the benefits of wetlands in combination with traditional methodsof flood protection could be employed to serve myriad purposes in the SF Bay Area. A slide depictingthe beneficial differences between levees adjacent to open water versus levees adjacent to tidal marsh wasshown followed by maps depicting South Bay Salt Pond Restoration Project areas (i.e. Eden Landing,Ravenswood, and Alviso).There is an Environmental Impact Report joint feasibility study due out later this year for the South SFBay Shoreline Study in Economic Impact Area 11 (Alviso community in San Jose). A plan hastentatively been selected (coupling new levee construction & restoration) that would allow 2,000 acres ofponds to be restored. The plan uses horizontal levee transition zones. A terraced levee allows attenuationof more waves and provides room for marshes to migrate inland. Mr. Bourgeois acknowledge the SantaClara Valley Water District for putting in a measure to further these studies.The timeline for the Shoreline study is 2012 – 2017, with construction beginning in 2017, however theProject needs to be authorized by Congress for USACE to begin work.Mr. Bourgeois displayed a slide with numerous logos and stated that this project would not be possiblewithout the many partnerships.VIII.USACE Shoreline Study - Lisa Andes/USACE, Coastal EngineerMs. Lisa Andes noted that the USACE Shoreline Study site considers both fluvial (Coyote Creek) andcoastal processes. She presented a project history from 2004-2013 (slide 3) and noted the composition ofthe Project sponsors (Santa Clara Valley Water District, Coastal Conservancy and USACE) and thetechnical team.8
minutesThe purpose of the project is two-fold including flood risk management as well as ecosystem restoration.Ms. Andes noted the Project challenges and listed the coastal engineering components (physics,numerical modeling, statistical analysis and sea level rise). She noted that it is innovative that the Studylooked at three types of statistical approaches (extreme probability method, joint probability method, andMonte Carlo simulations).A slide depicting tide and surge analysis at the San Francisco Tide Station was discussed as well asastronomical tidal amplification (how do tides propagate into the Bay) and residual tide in the South Baynoting that there was approximately no change in the residual tide as it propagates to the South Bay.Several statistical analyses scenarios (for a 105-year timeseries) were considered to determine what watersurface elevation is justified to be considered as a storm event in extreme coastal and fluvial floodstatistics.The Study used probability distribution functions (PDFs) of the primary forcings (predicted tide, residualtide, wind direction and wind speed) as inputs to the Monte Carlo simulation process, which also includedfluvial flows and levee failure scenarios. The output of the Monte Carlo approach was a series of basinflooding scenarios.Risk and uncertainty analysis for two areas was discussed, including effects of an outer levee breach.The analysis includes sea level rise of 2.13 ft by year 2067 and estimated bathymetric change projectedfor 2067. Year 2017 is considered as the studies year 0, as this is the anticipated year for construction tobegin. Year 2067 is the end of the 50-year planning horizon.Ms. Andes presented a summary and conclusions and a list of next steps. The Alternative FormulationBriefing with HQ USACE is planned for July 2013 and these materials will be available to the public inAugust/September 2013.9
minutesIX.Alameda County Coastal Hazard Analysis: Modeling of Complex Marsh Areas- DaleKerper/DHIMr. Dale Kerper provided an overview slide to begin discussion of the Alameda County coastal hazardanalysis efforts. He noted the partnerships, studies, analysis and treatment of embankments/structuresthat contributed to the modeling.For the South Bay <strong>Region</strong>al Model, the hindcast was extended for a period of 54 years as a result ofdropping swell from the model as noted by Kris May during the BAC Study presentation. Deliverablesfor the <strong>Region</strong>al Model included 15-minute water levels, one-hour waves, and 1- and .2% annual chancestatistics calculated at discrete output points along the shoreline within the Bay.Mr. Kerper spoke to a slide with a map depicting extensive marsh/pond/embankment systems. He notedthat <strong>FEMA</strong> has guidelines and specifications for performing the coastal analysis, however the complexityof the marsh areas in the San Francisco Bay are not explicitly addressed within the guidelines. When theanalysis first started, sensitivity analyses were performed that removed all of the non-accredited structuresand berms from the regional hydrodynamic and storm surge model. This resulted in an un-realisticmodeled scenario with lower 100-year still water elevations than would be expected, therefore the leveesand pond berms are retained in the regional modeling effort. Referencing a slide with embankmentheights relative to datum, Mr. Kerper explained that the 100-year still water elevations are largelybetween the 10.5’ and 12’ elevations (relative to NAVD88). The crests of the non-accredited structuresand pond berms are about at this same elevation. In the standard <strong>FEMA</strong> approach for mapping floodhazards, these structures are assumed to not provide protection within the analysis. The Levee Analysisand Mapping Approach (LAMP) provides an alternate way to address the level of protection thesestructures may provide. Although the pond berms are not levees as defined by <strong>FEMA</strong>, Alameda Countyadopted a LAMP-like approach for their detailed coastal analysis.He noted that in Alameda County, the pond berm structures are typically well-maintained and do providesome level of protection. He spoke to the San Francisco Bay Study history and showed images of theregional model simulations completed with and without the pond embankments. The final regional modelsimulations retained the pond berm structures, and the model results/outputs became the boundarycondition for the more detailed studies.For the purposes of the Alameda County analysis, a segment removal methodology was constructed(instead of full removal) as this is more consistent with the future management and restoration plans. Thismethodology assumes partial failure, assumes partial protection, uses overall conservative assumptions,and still considers physics. Mr. Kerper provided the modeling assumptions based on observedgeotechnical properties (clay), historical breaching characteristics around the Bay, and partial LAMPguidance for segment removal. He then presented a slide depicting the local 2D model for the area fromthe San Mateo Bridge to the Dumbarton Bridge with bathymetry and purple dots indicative of the10
minutessegment removal locations. The segment removal locations include at least one opening per pond. Theboundary conditions for the local 2D models were developed to approximate a 100-year event, using atime series constructed from 2 big storms that produced high water levels in the South Bay..A simulation running the same event sequence with breaches in Alameda County captured the physics ofpotential impacts locally. Mr. Kerper stated that they are treating the results for Alameda County asconservative but not unrealistic. The Alameda Coastal Hazard Analysis is designed to account for thelevel of protection that the pond berm system provides, since it has been in place for years. The approachacknowledges that it does provide some level of protection to communities, provides some consistencywith future management for flood control and restoration, is financially feasible and manageable for theDistrict, and provides a great opportunity for the Federal, State, and local governments to work togetherto find a solution.X. Adapting to Rising Tides - Wendy Goodfriend/BCDC, Sarah Heard/AECOMSarah Heard presented for Wendy Goodfriend, as Wendy was unable to attend. The goal of the Adaptingto Rising Tides (ART) project is to increase the preparedness and resilience of Bay Area communities tosea level rise and other climate change impacts while protecting ecosystem and community services. Theprimary focus of the ART project is sea level rise (SLR), the potential impacts of SLR and what it meansto the economy and natural systems.ART partners include multi-jurisdictional organizations, several cities, non-governmental organizations,utilities and others. The ART project area covers 66.7 square miles in Alameda County including sixcities, one unincorporated community, and numerous special districts.The ART Project itemized a number of asset categories and performed an assessment process designed tounderstand the impacts, vulnerability and risk in order to promote resilience. Several key questions wereposed to gage vulnerability. The ART Project used refined SLR and storm surge inundation maps todetermine potential asset exposure and assess risk accordingly. The ART adaptation response wasdeveloped for four sectors (community land use, utilities, transportation, and shorelines) incorporating alltwelve asset categories. The response highlights key issues in the ART project area, is adequate forcertain vulnerabilities (i.e. systemic issues or policy development), demonstrates that at the subregionalscale some strategies are too general, but they can serves as a starting point for more specific strategies.The ART adaptation response was developed at a high level and won’t get you to a site specific strategyfor implementation purposes, however that is the next logical step once site specific vulnerabilities andrisks are determined.11
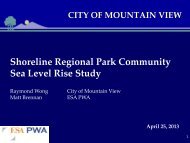
minutesART next steps include developing a portfolio of planning process tools, materials and lessons learned;continue shoreline park adaptation planning, and partnering with ABAG on multi-hazard shorelineresilience. More information is available on the project website: adaptingtorisingtides.orgXI.Mountain View Sea Level Rise Study - Raymond Wong/City of Mountain View, MattBrennan/ESAMr. Raymond Wong began the presentation by noting that Mountain View has been incorporated since1970 for tax purposes and businesses. The Mountain View Sea Level Rise study used the Shoreline SLRStudy as a basis. The goal of the SLR study in Mountain View is identify flood protection improvementprojects and develop a capital improvement program (CIP) that leads to funding obligations for theshoreline community area.As part of the study, flood protection strategies/CIPs were developed with 12 projects and three levels ofprotection for each project (low SLR, low SLR plus foundation for high SLR project, and high SLR). Thetotal CIP cost was determined to be $43 - $57 million.It was noted that much of the work presented in the previous sessions was referenced for the MountainView SLR study, and that things get touchy when maps go public.Dr. Matt Brennan discussed the technical aspects of the SLR study using slides that addressed studyassumptions/methodology, comparisons of SLR projections, coastal and fluvial design criteria, andinterior drainage.An inundation map depicting estimated SLR with a 1-percent annual chance flood without CIPimplementation was shown noting that the cross hatch is current <strong>FEMA</strong> Special Flood Hazard Area zoneswhile the lighter blue is the low SLR scenario. It was noted that the south side of the project area is morevulnerable.The study tried to identify flood pathways, the primary pathway that leads to the inland inundation areas,as well as rank them by priority project need. This information was depicted on a flood vulnerabilitymap. Based on these assessments and local understanding of flow pathways, the city of Mountain Viewdeveloped an overall CIP approach they could use as they develop the plan for each annual CIP,considering annual budgets. They came up with a list of 12 projects, and most were levee improvementsand along coast, some were along creeks. It was noted that that the City already has landfills that providesome protection.The project implementation timeline was discussed. The City is already at risk from the 100-year event.When implementing projects that protect the City from the 100-year event, there is only a 15-20% costdifference to increase level of protection so that it also accounts for future sea level rise. The cost toimplement some of these projects in the future increases incrementally; therefore it may be more costeffective to implement the projects with a higher level of protection now.12
minutesXII.Discussion / Q&AQ: Modelers – how have you dealt with the joint probability of fluvial and coastal?A: Mr. Kerper (DHI) – for the Alameda County coastal hazards analysis, we haven’t got there yet. Thereis a <strong>FEMA</strong> methodology we can apply that considers the likelihood of the joint occurrence of fluvial orcoastal flooding, or you can assess them separately and map the process that has the higher flood risk.A: Ms. Schaefer said that from the <strong>FEMA</strong> perspective this is a strong area of interest on her part. She hasaspirations that we’ll go back and update the riverine studies that converge with coastal area using theupdated information from the BAC Study. There are some relevant studies here in the Bay regardingcoincident events.A: Ms. Andes (USACE) noted that in many of the creeks within the Shoreline Study project area, there isa statistical relationship between fluvial and coastal events.Q: Question about the magnitude of stream flow in the North Bay compared to the South Bay.A: Mr. Kerper (DHI): this plays into the North Bay /Sacramento River discharges in the regionalmodeling effort when running the 50-year simulations. He did include the major Sacramento and NapaRiver discharges in this simulation, so the joint probability is captured in regional modeling in the NorthBay. This is an important contributor to the flood hazards in the North Bay.In the South Bay, the impact of the riverine discharges may be closer to what you could say is negligible.However, if there is a high intensity of rainfall for an extended time period, and surge levels within theBay are high when the stormwater is trying to drain into the Bay (or be pumped into the Bay), and theground is also saturated, there could be issues in the South Bay. The current effort is not addressinginterior drainage issues though.A: Dr. Brennan (ESA): The Mountain View study did use empirical relationships in the creeks used fortwo creeks in the study area; used 1/10 of a foot as a criteria for when affected by SLR, Stevens Creek hasheavier outflow so there’s impact further downstream. The Mountain View SLR study also looked atcapacity of pump stations against what they had to pump against and there was only one pump station thatwas flagged that might have issues in the low SLR timeframe. They found that pumps were notnecessarily sensitive to the tailwater elevation.A: Dr. Frank Wu (USACE) noted that with fluvial areas in the Shoreline Study area such as CoyoteCreek, there’s a high coincidence and fluvial flows are included in the model. Regarding jointprobability, the USACE used HEC RAS to establish correlative estimates in streams.13
minutesQ: Did the Adapting to Rising Tides project develop cost estimates that considered the costs to replace orupgrade infrastructure, as well as the economic consequences/damages for a specific area that wasimpacted?A: Sarah Heard – Not sure of the full scope of the economic assessment work that was done for the largerproject. Ms. Heard was primarily involved in the transportation piece of the project, and they did look atthe economic costs of replacing roadways or specific transportation assets. The ART project is stillongoing, so this may be something still in progress.Q: There are different approaches proposed for the salt ponds in Alameda County vs. San Mateo andSanta Clara Counties. What does <strong>FEMA</strong> think about the Alameda County approach?A: Ms. Schaefer noted that the Alameda approach is different from the traditional <strong>FEMA</strong> approach. Theremay be some nuances of the Alameda approach that need tweaking here or there. Ms. Schaefer is finewith the different approaches used in the South Bay.Q: Vince Geronimo (AECOM) had a question about river mouths as they approach the Bay for Ms.Andes: What’s the plan for river mouths for tying into existing levees? Will you stay with risk- basedanalysis and how close do you think that is to <strong>FEMA</strong>’s 100-year standard?A: Dr. Michael MacWilliams (Delta Modeling) answered that it is pretty seamless in the USACEmodeling.Q: Fish and Wildlife representative: How am I going to pay for all this restoration?A: Mr. Bourgeois said it is through various appropriations and grants, that state bond funding is dryingup, and restoration authority is considering a 9-county parcel tax in 2014.Ms. Schaefer stated that all of the attendees are professionals in this field and we all need to get the wordout to the public about the importance of all the projects being discussed. We’ve got a $50 billioninfrastructure need statewide, and we need to increase our education and outreach efforts and find a wayto support the statewide intiatives.Q: Sarah Young (SCVWD) - How much of climate changes and temperature is brought into your maprevision?A: Ms. Schaefer clarified that the previously stated $50 billion does not include climate change, that is thecurrent budget needed to address existing infrastructure needs. She went on to explain that <strong>FEMA</strong> doesnot consider future climate change for Flood Insurance Rate Maps (FIRMs) as these are foradministration of the National Flood Insurance Program (NFIP). The <strong>FEMA</strong> study is based on a hindcasttherefore whatever climate change has happened over the past years has been incorporated. <strong>FEMA</strong>advocates that you use <strong>FEMA</strong> data as starting point and take it from there.14
minutesComment/Question: Today has been an intense immersion into all that’s going on, and I don’t get wherethere’s overlap or integration. Is it one of the Silicon Valley 2.0 objectives to help understand the pointsof intersection across these efforts?A: Demetra McBride (SV 2.0) – Yes, one of the aspirations is to bring projects together and thegovernance aspect is a looming task. Ms. McBride encouraged that we shouldn’t compartmentalizebecause it is too costly. May 6 is the kick off meeting for Silicon Valley 2.0, and the invite list reflectsthe diversity in this room and it is Ms. McBride’s hope that we’re going to build on that diversity. Sheimplored that <strong>FEMA</strong> maps should consider future conditions and that everyone band together and poolresources.Ms. Schaefer stated that we will always have the <strong>FEMA</strong> FIRMs as regulatory products for assessing floodinsurance rates and administration of the NFIP. Through the Risk MAP initiative <strong>FEMA</strong> will alsoproduce non-regulatory products and use this information to inspire action at the community level. As anagency <strong>FEMA</strong> has metrics we have to meet, including providing information to a certain amount ofpopulation and then we are measured against actions the community takes to move forward.Q: Directed at Dr. Frank Wu - Regarding statistical analysis and extreme value calculations- the USACEshould consider the residuals in their extreme value calculations, and not just complete extreme valueanalysis on those events that produced high water levels. If you look at the residuals, there are moreevents that could be considered in this type of analysis. A: Dr. Frank Yu: Okay. Noted.Q: Melanie Richardson with SCVWD mentioned a partnership with CA Coastal Conservancy andUSACE on EIA 11. She is working towards the Chief’s Report due in 2014. If additional USACE fundsare appropriated, they could move into EIA 1 – 10 soon. Her question was how do we incorporate allthese other efforts into our work? How do we align our efforts?A: Ms. Schaefer responded that from a <strong>FEMA</strong> perspective it would benefit communities to becomeCooperating Technical Partners (CTP) with <strong>FEMA</strong>. By joining and signing the CTP program, <strong>FEMA</strong> canhelp coordinate some of the activities and provide funding.Q: How do we enter into the CTP program?A: Ms. Schaefer noted that there were discussions already underway to that end and we need to continue.A: Mr. Eric Simmons noted that SCVWD is already a CTP.A: USACE - if we get funding, we would work with all stakeholders to have a broad-basedunderstanding. The USACE has already done a lot of work on the 10 EIAs in the South Bay, nowmoving into a smart planning mode as compared to old mode and will use available info to move forwardquickly provided we get authorization. <strong>FEMA</strong> has some funding to help USACE get to the table if therearen’t project funds to enable that coordination.15