Your Policy vs. Various Financial Alternatives - InsMark
Your Policy vs. Various Financial Alternatives - InsMark
Your Policy vs. Various Financial Alternatives - InsMark
- No tags were found...

You also want an ePaper? Increase the reach of your titles
YUMPU automatically turns print PDFs into web optimized ePapers that Google loves.
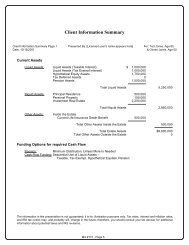
Indexed Universal Life <strong>vs</strong>. <strong>Various</strong> <strong>Financial</strong> <strong>Alternatives</strong>Presented By: [Licensed user's name appears here]Insured: George Baker, MDComparison of ValuesGinnieMae FundYield6.00%TaxableBond FundYield7.00%EquityAcountGrowth7.50%IncomeTax Rate35.00%Indexed ULInterest Rate7.50%InitialDeath Benefit500,000After Tax Values of Identical Allocation to <strong>Various</strong> <strong>Financial</strong> <strong>Alternatives</strong> Indexed ULYrMaleAge(1)LifeInsurancePremium(2a)After TaxCash FlowfromGinnieMae Fund(2b)GinnieMae Fund(3a)After TaxCash FlowfromTaxableBond Fund(3b)TaxableBond Fund(4a)After TaxCash FlowfromEquityAcount(4b)EquityAcount(5a)After Tax<strong>Policy</strong>Cash Flow(5b)Year EndAccumValue*(5c)Year EndCashValue*(5d)DeathBenefit31 75 0 60,000 7,274 60,000 81,515 60,000 281,995 60,000 848,189 848,189 905,84832 76 0 7,274 0 60,000 22,333 60,000 232,005 60,000 848,572 848,572 910,34633 77 0 0 0 22,333 0 60,000 179,550 60,000 848,518 848,518 914,63034 78 0 0 0 0 0 60,000 124,505 60,000 847,919 847,919 918,60135 79 0 0 0 0 0 60,000 66,742 60,000 846,647 846,647 922,14336 80 0 0 0 0 0 60,000 6,129 60,000 844,552 844,552 925,11337 81 0 0 0 0 0 6,038 0 60,000 841,456 841,456 927,34238 82 0 0 0 0 0 0 0 60,000 837,150 837,150 928,62939 83 0 0 0 0 0 0 0 60,000 831,386 831,386 928,73540 84 0 0 0 0 0 0 0 60,000 823,877 823,877 927,377400,000 667,274 742,333 966,038 1,200,000*This is an example of an <strong>InsMark</strong> supplementalillustration for indexed universal life. In an actualpresentation, this footnote will refer to an accompanyingbasic illustration from a specific life insurance companywith important details, caveats, and guarantees.See the accompanying reports for year-by-year details:Details of the: Equity Account; Portfolio TurnoverManagement fees reflected in columns (2b), (3b) & (4b):GNMA = 0.60%, TBF = 0.70%, EQ = 0.75%Date: [Current date appears here]Page 3 of 9
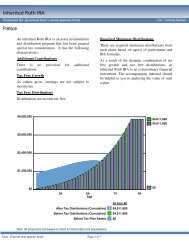
Indexed Universal Life <strong>vs</strong>. <strong>Various</strong> <strong>Financial</strong> <strong>Alternatives</strong>Presented By: [Licensed user's name appears here]Insured: George Baker, MDCash Flow Comparison of Years 21 - 40$1,600,000$1,200,000$1,200,000$966,038$800,000$742,333$667,274$400,000$021 25 30 35 40Years (21 - 40)At Year 40Cumulative After Tax Cash Flow from A Ginnie Mae Fund $667,274Cumulative After Tax Cash Flow from A Taxable Bond Fund $742,333Cumulative After Tax Cash Flow from Equity Acount $966,038Cumulative After Tax <strong>Policy</strong> Cash Flow from Indexed UL $1,200,000Date: [Current date appears here]Page 7 of 9