MARAUDER FOOTBALL RECORD BOOK Individual Records -- Game
MARAUDER FOOTBALL RECORD BOOK Individual Records -- Game
MARAUDER FOOTBALL RECORD BOOK Individual Records -- Game

You also want an ePaper? Increase the reach of your titles
YUMPU automatically turns print PDFs into web optimized ePapers that Google loves.
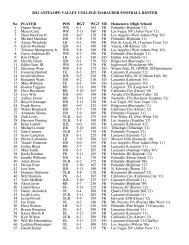
<strong>MARAUDER</strong> <strong>FOOTBALL</strong> <strong>RECORD</strong> <strong>BOOK</strong><strong>Individual</strong> <strong>Records</strong> -- <strong>Game</strong>206RUSHINGMost Rushes — 37 by Tony Reed vs.Cuesta, 1974 and by Steve Blanche,1977Most Net Yards — 305 by LafayetteBailey vs. Southwestern, 1997GAME YR YDS OPP.1. Lafayette Bailey 1997 305 Sthwstrn2. Tony Reed 1974 291 Redwds3. Eddie Walker 1976 282 Cuesta4. DeAndrá Cobb 2001 280 SD Mesa5. Jim Johnson 1975 274 Merced6. Lafayette Bailey 1996 249 Rio Hondo7. Bob Keyes 1956 244 Palo Verde8. Jason Anderson 1999 243 Chaffey9. Lee Schramm 1972 239 PortervilleTony Reed 1974 239 CuestaLongest Run From Scrimmage — 99by Bob Keyes vs. Palo Verde, 1956Most Touchdowns Rushing — 6 byBob Keyes vs. Mira Costa, 1955PASSINGMost Attempts —45 by TracyGallagher vs. Taft, 1979.Most Completions —28 by JamarCulver vs. Reedley, 2002 and vs.Victor Valley, 2002Most Had Intercepted —5 by LarryLindeen vs. Mira Costa, 1969Highest Percent Completed (Min15 att.) — .800 (20-25) by LarrySatterfi eld vs. Mira Costa, 1973Most Consecutive Completions— 15 by Brad Norris vs. Chaffey,1997Most Yards Gained —397 by CoryAllred vs. Mt. San Jacinto, 2001Most Touchdown Passes Thrown—4 by Leroy Wotring vs. Barstow,1967 and by Larry Dreyer vs. WestHills, 1974 and by Cory Allred vs.Grossmont, 2001 and by Jamar Culvervs. Reedley, 2002PASS RECEIVINGMost Passes Caught — 13 byJerome Wright vs. Southwestern, 2002Most Touchdown Passes Caught —3 by Jason Anderson vs. Grossmont,2001 and by Troy Searcy vs. VictorValley, 1994, by Ross Brosius vs.Imperial Valley, 1968, by SteveBlanche, 1977 and by Tom Crenshawvs. Palo Verde, 1954Longest Pass Play — 98 by ThomasReimer from Marty Washington vs.East LA, 1990PUNTINGLongest Punt — 74 by Doug Heldtvs. Kings River, 1985RETURNSLongest Punt Return —94 by KenMcMillan vs. Merced, 1973Most Punt Returns For Touchdowns— 2 by Tony Reed vs. Mt. San Jacinto,1973Most Yards Punt Returns — 165 byTony Reed vs. Mt. San Jacinto, 1973Longest Kickoff Return —100 byTony Reed vs. Canyons, 1973Longest Interception Return — 99by Larry Weaver vs. Southern Utah,1954Longest Fumble Return —74 byVictor McDonnell at Southwestern,1997Longest Interception Return onConversion —100 by Jarod Dodsonvs. Citrus, 1994INTERCEPTIONSMost Interceptions — 4 by RodMurphy, 1974SCORINGMost Touchdowns —6 by Bob Keyesvs. Mira Costa, 1955Most Point Afters —9 by Joe Bertonivs. LA City, 1976Longest Field Goal — 50 by TimDewberry vs. Glendale, 1984TACKLESMost Tackles —20 by Ryan Lile vs.East LA, 1988 and by Mark Soger vs.Ventura, 1980Year Tkl Opponent1. Ryan Lile 1988 20 East LAMark Soger 1980 20 Ventura3. Bobby Antee 1999 19 SouthwesternVictor Dawkins 1988 19 Rio HondoDexter Nelson 1988 19 Rio HondoRobert Hull 1978 19 VenturaRobert Hull 1978 19 Ventura7. Tim Feikert 1975 18 CuestaP.J. Williams 1985 18 San Bern ValMark Meade 1987 18 LA ValleyTheron Egana 1989 18 PortervilleM ARAUDERF OOTBALL38
Team <strong>Records</strong> -- <strong>Game</strong>RUSHINGMost Rushes — 72 at San BernardinoValley, 1998 -- 3 OTsMost Rushes (Regulation)-- 68 atSan Bernardino Valley, 1998 -- 3 OTsMost Net Yards — 500 vs. RioHondo, 1996Most Touchdowns Rushing — 11 vs.Victor Valley, 1968PASSINGMost Attempts — 58 vs. Taft, 1979Most Completions — 26 vs. Taft,1979Most Had Intercepted — 5 vs. MiraCosta, 1969Highest Percent Completed (Min15 att.) — 1.000 (15-15) vs. Chaffey,1997Most Yards Gained — 397 vs. Mt.San Jacinto, 2001Most Touchdown Passes Thrown— 4 vs. Barstow, 1967 and vs. WestHills, 1974 and vs. Santa Barbara City,2001 and vs. Grossmont, 2001TOTAL OFFENSEMost Plays — 89 vs. Mt. San Jacinto,2001Most Yards — 654 vs. Rio Hondo,1996Most Yards per play — 9.8 (654 ydson 67 plays) vs. Rio Hondo, 1996Most Yards in a half -- 411 (First half)vs. Grossmont, 2001INTERCEPTIONSMost Interceptions — 4 , 1974 andvs. Victor Valley, 2001SCORINGMost Points — 80 vs. Victor Valley,1968MOST POINTS SCORED BY AVCOPPONENT YR AVC OPP1. Victor Valley 1968 80 62. Victor Valley 1987 70 03. Palo Verde 1956 69 04. MiraCosta 1955 68 05. Santa Barbara 1959 65 20Desert 1981 65 07. Victor Valley 2001 63 45LA City 1976 63 89. San Bern Val 2001 62 1210. Citrus 1996 61 27Most Points in a half — 49 vs.Desert, 1981Most Touchdowns — 11 vs. VictorValley, 1968Most Point Afters — 9 vs. LA City,1976TEAM DEFENSE RUSHINGFewest Net Yards — -46 vs. Desert,1981Lowest Avg. Per Rush — -.6 vs.Victor Valley, 1987TEAM DEFENSE FORWARD PASSINGFewest Yards — 24 vs. ImperialValley, 1959TEAM DEFENSE TOTAL DEFENSEFewest Total Offense Yards — 21 vs.Desert, 1981Lowest Average Per Play — .48 vs.Desert, 1981TEAM DEFENSE MISCELLANEOUSFewest Total First Downs — 5 vs.Desert, 1981Fewest First Downs Rushing — 1vs. Victor Valley, 1987Most Opponents Fumbles — 11 vs.Porterville, 1955MOST POINTS SCORED BYBOTH TEAMSOPPONENT YR AVC OPP TOT1. Victor Valley 2001 63 45 1082. Grossmont 2003 49 52 1013. Victor Valley 2002 30 68 984. Victor Valley 1994 60 37 975. Mt. San Jacinto 1991 59 34 936. Merced 1976 49 42 91Mt. San Jacinto 1999 42 49 918. Citrus 1996 61 27 889. Grossmont 1996 37 50 87Reedley 2002 41 46 87BIGGEST POINT SPREADS BY AVCOPPONENT YR AVC OPP Dif1. Victor Valley 1968 80 6 742. Victor Valley 1987 70 0 703. Palo Verde 1956 69 0 694. MiraCosta 1955 68 0 685. Desert 1981 65 0 656. Edwards AFB 1983 60 0 607. Carbon (UT) 1956 56 0 56Mt. San Jacinto 1972 56 0 569. LA City 1976 63 8 5510. Pomona Frosh 1952 54 0 54Chaffey 1988 57 3 54MOST POINTS SCORED AGAINST AVCOPPONENT YR AVC OPP1. Victor Valley 2002 30 682. Palo Verde 1950 0 66Grossmont 2002 7 664. Grossmont 2000 26 595. Chaffey 2002 28 586. Citrus 1950 6 56Glendale 1985 21 568. Compton 1969 19 549. Chaffey 2003 17 52Grossmont 2003 49 529. Southwestern 2002 32 51BIGGEST POINT SPREADSAGAINST AVCOPPONENT YR AVC OPP Dif1. Palo Verde 1950 0 66 662. Grossmont 2002 7 66 593. Citrus 1950 6 56 504. Saddleback 1982 0 49 495. Reedley 1965 0 46 466. Ventura 1969 0 44 447. Occidental Frosh 1950 0 41 41Saddleback 1981 0 41 41Mt. San Jacinto 2002 0 41 4110. MiraCosta 1950 0 40 40206M ARAUDERF OOTBALL39
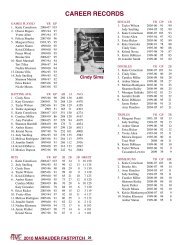
RUSHINGMost Rushes — 337 by Tony Reed,1974Most Net Yards — 1886 by TonyReed, 1974<strong>Individual</strong> <strong>Records</strong> -- SeasonHighest Percent Completed — .644(143-222) by Cory Allred, 2001PASS RECEIVINGMost Passes Caught — 76 byJerome Wright, 2002206SEASON YR YDS1. Tony Reed 1974 18862. Eddie Walker 1976 15643. Bob Keyes 1956 14234. Bob Keyes 1955 12005. Albert Pinchem 1982 11376. Jim Johnson 1975 11097. DeAndrá Cobb 2001 10928. Jamar Day 2003 10349. Sylvester Brumfi eld 1986 101310. Glenn Vereen 1988 1008Most Touchdowns rushing — 23 byTony Reed, 1974PASSINGMost Attempts — 367 by JamarCulver, 2002Most Completions — 197 by JamarCulver, 2002Most Had Intercepted — 18 by LarryLindeen, 1969YR PC PA PCT1. Cory Allred 2001 143 222 .6442. Jerad Romo 2003 125 206 .6073. Larry Satterfi eld 1973 71 123 .5774. Jamar Culver 2002 197 367 .5375. Shawn Sharp 1995 84 159 .5286. Keith Gainey 1987 88 168 .5247. Cory Allred 2000 123 236 .5218. Ryan Callahan 1992 83 160 .5199. Michael Gleich 1994 96 190 .50510. Del Bishop 1968 52 104 .500Most Yards Gained — 2346 by Jamar Culver,2002YR PC PA YDS1. Jamar Culver 2002 197 367 23462. Cory Allred 2001 143 222 22563. Jerad Romo 2003 125 206 17314. Cory Allred 2000 123 236 15085. Marty Washington 1991 74 168 14896. Ryan Callahan 1992 83 160 14587. Marty Washington 1990 111 234 14488. Michael Gleich 1994 96 190 14419. Ron Chaplin 1985 67 138 134610. Keith Gainey 1987 88 168 1239Most Touchdown Passes Thrown— 20 by Cory Allred, 2001YR PC YDS AVG1. Jerome Wright 2002 76 1008 13.302. James Laurence 2002 55 715 13.003. Brandon Eggerth 2001 47 747 15.904. Jerome Wright 2000 46 637 13.805. Bill Hilliker 1978 44 477 10.846. DeVon Stewart 2001 42 773 18.407. Lamart Cooper 1992 39 833 21.408. Jason Smith 2003 34 428 12.609. Jim Cox 1953 32 718 22.4410. Jack Pollock 1971 31 493 15.90Most Yards Gained — 1008 byJerome Wright, 2002Highest Yards per ReceptionAverage — 30.65 (613 yards in 20receptions) by Nate Williams, 1991(Min. 12 receptions)YR PC YDS AVG1. Nate Williams 1991 20 613 30.652. Mike Hale 1977 14 361 25.793. Doug Costa 1988 20 495 24.754. Troy Searcy 1994 12 272 22.675. Jim Cox 1953 32 718 22.446. Tim Lewis 1985 25 547 21.907. Doug Costa 1987 24 517 21.508. Lamart Cooper 1992 39 833 21.409. Duane Hellwig 1974 16 329 20.5610. Scott Turner 1989 14 270 19.29Most Touchdown Passes Caught— 10 by DeVon Stewart, 2001PUNTINGHighest Average — 42.4 (2330 in 55)by Carlos Nunez, 2002M ARAUDERF OOTBALL40
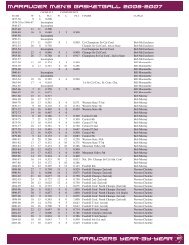
PUNT RETURNSMost Yards Punt Returns — 354 byJason Anderson, 2001Best Average Punt Returns — 24.3by Tony Reed, 1973KICKOFF RETURNSMost Yards Kick Returns — 596 byJerome Wright, 2002Most Interceptions — 11 by VernValdez, 1954 and by Lee Fobbs, 1977Yrs GP Ints1. Lee Fobbs 1977 11Vern Valdez 1954 113. John Johnson 1990 10 94. Lee Fobbs 1978 7Tony Upshaw 1993 11 7Wilson Hookfi n 1991 10 77. Jerry Jones 1997 11 68. Ronald Bryant 1991 9 5Junior Masco 2000 10 5Most Sacks — 17 by Daron Rodgers,1990 and 1991Most Defensive Points† — 413 byAnthony Diggs, 2001Year GP Pnts1. Anthony Diggs 2001 10 4132. Daron Rodgers 1991 11 3743. Matt Volpe 1989 11 3624. Charley Wright 1990 11 3345. Daron Rodgers 1990 11 3106. Brian Pereira 1996 10 299Eric Nickols 1996 10 2998. Wilbert Reed 1994 10 2879. Richard Lear 1993 11 28210. Bobby Antee 1999 10 277206M ARAUDERF OOTBALLBest Average Kickoff Returns— 33.5 (10-335) by Tony Reed, 1972SCORINGMost Touchdowns — 23 by TonyReed, 1974Most Point Afters — 34 by JimHendrickson, 1974DEFENSEMost Tackles — 131 by Ryan Lile,1988Yrs GP UT AT Tot1. Ryan Lile 1988 1312. Matt Volpe 1989 11 76 53 1293. Eric Glover 1997 11 58 63 1214. Charley Wright 1990 11 69 41 1105. Jerry Smith 1974 1086. Brian Pereira 1996 10 62 45 107Bobby Antee 1999 10 46 61 1078. Darrin Berger 1983 106Robert Hull 1977 10610. Keith Rice 1986 105Shawn Taylor 1988 105Yrs GP Sacks1. Daron Rodgers 1990 11 17.0Daron Rodgers 1991 11 17.03. Anthony Diggs 2001 10 16.04. Ricky Windham 1996 10 15.05. Eric Nickols 1996 10 12.06. Ashor Valibaba 1998 10 10.0Victor McDonnell 1997 11 10.08. CB Wentling 1993 11 8.59. Anthony Borda 1998 10 8.0Carl Taylor 1993 11 8.0*Complete defensive records begun in the1989 season†Defensive points determined by followingformula:Forced fumbles, recovered fumbles, sacksand blocked kicks: 5 pts each; unassistedtackles, hurries and deflections: 3 pts each;interceptions: 10 pts each; assisted tackles:1 pt. each.Team <strong>Records</strong> -- SeasonRUSHINGMost Net Yards — 2922, 1974PASSINGMost Attempts — 296, 2000Most Completions —176, 2001Most Had Intercepted — 18, 1969Highest Percent Completed — .611(167-273), 2001Most Yards Gained — 2604, 2001Most Touchdown Passes Thrown— 23, 2001TOTAL OFFENSEMost Yards Gained — 5003 (2399rushing, 2604 passing), 2001PUNTINGHighest Average — 41.6 (40-1664)1975SCORINGMost Points — 429, 2001TEAM DEFENSE RUSHINGFewest Net Yards — 511, 198341
TEAM DEFENSE FORWARDPASSINGTEAM DEFENSE TOTALDEFENSE206RUSHINGFewest Net Yards — 716, 1983Most Rushes — by Tony Reed, 1973-74Most Net Yards — 2765 by TonyReed, 1973-74Highest Percent Completed (min.200) — .581 (266-458) by Cory Allred,2000-01YR PC PA PCT1. Jerad Romo 02-03 136 232 .58622. Cory Allred 00-01 266 458 .58083. Jamar Culer 00, 02 226 427 .52934. Mike Gleich 94, 96 139 270 .51485. Ryan Callahan 91-92 90 175 .51436. Larry Satterfi eld 72-73 123 240 .5125Most Yards Gained —3764 by CoryAllred, 2000-01Fewest Points Allowed — 55, 1956Biggest Point Spread — 311 (366-55), 1956Most Interceptions — 25, 1974Most Fumbles Recovered — 21,1978<strong>Individual</strong> <strong>Records</strong> -- CareerPASS RECEIVINGMost Passes Caught — 122 byJerome Wright, 2000, 02.YRS PC YDS AVG1. Jerome Wright 00, 02 122 1645 13.482. James Laurence 01-02 83 1082 13.043. DeVon Stewart 00-01 67 1184 17.674. Brandon Eggerth 00-01 64 908 14.195. Thomas Reimer 90-91 50 873 17.46Lamart Cooper 91-92 50 1128 22.567. Dave Wilson 82-81 48 723 15.068. Doug Costa 87-88 44 1008 22.91Tim Lewis 85-86 44 754 17.14Bill Hilliker 78 44 477 10.84M ARAUDERF OOTBALL42Most Yards Gained — 1645 byJerome Wright, 2002Most Touchdown Passes Caught— 15 by Tom Crenshaw, 1954-55YRS YDS1. Tony Reed 73-74 27592. Bob Keyes 55-56 26233. Eddie Walker 75-76 24944. Jamar Day 96, 03 18455. Ross Brosius 68-69 18386. Jim Johnson 74-75 18287. Lafayette Bailey 96-97 17108. DeAndrá Cobb 00-01 16099. Albert Pinchem 81-82 159110. Glenn Vereen 87-88 1506Most Touchdowns Rushing — 38 byTony Reed, 1973-74PASSINGMost Attempts — 458 by Cory Allred,2000-01Most Completions — 266 by CoryAllred, 2000-01Most Had Intercepted — 23 by LarryLindeen, 1968-69CAREER Yardage YR PC PA YDS1. Cory Allred 00-01 266 458 37642. Marty Washington 90-91 185 402 29373. Jamar Culver 00, 02 226 427 28284. Jerad Romo 02-03 136 232 19295. Larry Satterfi eld 72-73 123 240 17896. Ed t’Sas 77, 81 109 253 17527. Ron Chaplin 84-85 85 175 16318. Shawn Sharp 95-96 132 274 16289. Ryan Callahan 91-92 90 175 157310. Michael Gleich 95 96 190 1441Most Touchdown Passes Thrown— 32 by Cory Allred, 2000-01SCORINGMost Touchdowns — 38 by TonyReed, 1973-74Most Point Afters — 47 by ChrisStarling, 2000-01
DEFENSEMost Tackles — 233 by Matt Volpe,1988-89Yrs GP UT AT Tot1. Matt Volpe 1988-89 21 76 157 2332. Ryan Lile 1987-88 213 2133. Robert Hull 1977-78 209 2094. Darrin Berger 1983-84 207 2075. Shawn Taylor 1986, 88 206 2066. Dexter Nelson 1977-78 190 1907. Wilbert Reed 1993-94 20 120 68 188Jerry Smith 1973-74 188 1889. Keith Rice 1985-86 182 182Gary Hardy 1997-98 21 90 92 182Most Interceptions — 18 by LeeFobbs, 1976-77Player Yrs GP Ints1. Lee Fobbs 1977-78 182. Vern Valdez 1954 113. Wilson Hookfi n 1990-91 19 104. Junior Masco 2000-01 21 9John Johnson 1990 10 96. Tony Upshaw 1993-94 21 87. Birk Sopsher 1989-90 10 5Chris Goring 1991-92 22 5Marlan Bacon 1992-93 20 5Ronald Bryant 1991 9 5Most Sacks — 34.0 by DaronRodgers, 1990-91Yrs GP Sks1. Daron Rodgers 90-91 22 34.02. Anthony Diggs 2000-01 20 21.53. Ashor Valibaba 1997-98 21 18.04. Ricky Windham 95-96 19 16.05. Eric Nickols 95-96 20 14.06. Rafael Gutierrez 92-93 21 12.57. Carl Taylor 92-93 22 11.08. Gregory Stenson 93-94 21 10.59. Victor McDonnell 96-97 20 10.010. Charles Patterson 95-96 17 9.0Charley Wright 90, 92 20 9.0Most Defensive Points — 684 byDaron Rodgers, 1990-91Yrs GP Pts1. Daron Rodgers 1990-91 22 6842. Anthony Diggs 2000-01 20 598.53. Wilbert Reed 1993-94 20 5544. Charley Wright 1990-91 20 5495. Brian Pereira 1995-96 19 456Keith Schiele 1995-96 20 4567. Carl Taylor 1992-93 22 4488. Rafael Gutierrez 1992-93 21 4379. Gary Hardy 1997-98 21 43610. Tony Upshaw 1993-94 21 417Tom Crenshaw206M ARAUDERF OOTBALLDeAndrá CobbDeVon StewartBrandon EggerthJerad RomoTony Reed Sweep Right in 1974 Championship Season43