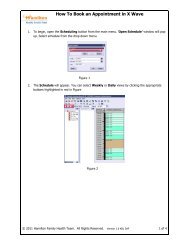
The New WHO growth charts - Hamilton Family Health Team
The New WHO growth charts - Hamilton Family Health Team
The New WHO growth charts - Hamilton Family Health Team

You also want an ePaper? Increase the reach of your titles
YUMPU automatically turns print PDFs into web optimized ePapers that Google loves.
<strong>The</strong> <strong>New</strong> <strong>WHO</strong> <strong>growth</strong> <strong>charts</strong>2006 <strong>WHO</strong> Child Growth Standards (0-5 years old)2007 <strong>WHO</strong> Growth Reference (5-19 years old)1
Outline•2006 <strong>WHO</strong> Child Growth Standards vs.CDC•Use of BMI in pediatric populations•2007 <strong>WHO</strong> Growth reference•Interpreting the <strong>WHO</strong> <strong>growth</strong> <strong>charts</strong>•What to expect?•Tools and resources2
<strong>WHO</strong> Child Growth Standards (0 – 5 yrsold)• <strong>The</strong> Multicentre Growth Reference Study(MGRS) – Brazil, Ghana, India, Oman, USA• Optimal conditions◦Breastfeeding◦Non-smoking mother◦Accessible healthcare◦Complementary feeding after 6 months (GlobalStrategy for Infants and Young Children FeedingGuidelines)3
<strong>WHO</strong> Child Growth Standards• Environmental vs. genetics as the principaldeterminant of <strong>growth</strong> disparity◦Difference among countries – 3%◦Individual variance – 70%• Standard vs. reference• Windows of Achievement Timeline - 6 key motordevelopment milestones• BMI <strong>charts</strong> for infants to (0-5 years)4
<strong>WHO</strong> 2006 Standards Multi-country Predominantlybreastfed Longitudinal (i.e. eachinfant measured 21x) Use of z-scores andcorrespondingpercentiles BMI <strong>charts</strong> for infantsCDC 2000 Reference Single country Formula + breastfed(50%), 33% >3mths Cross sectional (i.e.measured once) Use of percentiles BMI is notrecommended lessthan 2 years old5
<strong>The</strong> use of z-score vs. percentiles•Percentiles◦Child’s position within the reference population•Z-scores (Standard deviation scores)6
Comparing z-scores and percentilesZ-scoreRounded percentile3 99th2 97th1 85%0 50%-1 15%-2 3rd-3 1st8
Comparing z-scores and percentiles•Percentiles are less useful in describingextremes of a distribution•Z-score values correspond to similarchanges regardless of which part of of thedistribution•14 y.o, weight increased from 95 -110-125 kg◦Percentile: 99.3 th ….99.7 th …99.9 th◦Z-score: 2.47…2.82…3.089
Comparing z-scores and percentiles•<strong>WHO</strong> recommends use of z-scores overpercentiles•Canadian-<strong>WHO</strong> <strong>charts</strong> include 0.1 to99.9 th percentiles◦Better detects extreme underweight or obesity•Stayed tune!!10
BMI (0 to 2 years)• Canada has yet to adopt use of BMI in infants• Canada-<strong>WHO</strong> BMI <strong>charts</strong> available only forages 2-19 years• Most studies for BMI done in children 2 yearsand older• Less evidence that BMI for age is better thanweight-for-age or weight-for-length12
Pediatric BMI– Issues To Consider•Identification of overweight and obesity◦Not a diagnostic criteria for classifying children◦Screening tool – guide for further assessmentor intervention•Identification of underweight or FTT (new)◦Based on adult cut-offs◦Correlation between BMI and lean body massless established13
Pediatric BMI– Issues to Consider•Adiposity rebound◦BMI for age declines after 1 year of age andfalls to a minimum at 4-6 years old◦Increase in BMI before 4-6 years old isassociated with obesity in adulthood14
Pediatric BMI– Issues To Consider•Responding to over-nutrition identified byBMI◦Weight loss not recommended◦Rather, goal is to “slow down rate of weightgain”, “allow height to catch up”15
2007 <strong>WHO</strong> Growth Reference (5 – 19 yrs)•Similar study to <strong>WHO</strong> Child GrowthStandards not feasible•Revision of data (1977 NCHS/<strong>WHO</strong>)•Data from 1963 – 1974 (American data)•2000 CDC data not included to reduceinfluence of rising obesity16
2007 <strong>WHO</strong> Growth Reference (5 – 19 yrs)•Match of curve with <strong>WHO</strong> Child GrowthStandards• Cut-off corresponds to adult BMI◦Overweight: 85 th % …. BMI 25◦Obese: 97 th % …. BMI 30•A better reference17
What to expect?•Transition to <strong>WHO</strong> Child GrowthStandards•Children on <strong>WHO</strong> <strong>growth</strong> chart aregenerally taller and leaner than CDC18
What to expect?•Canadian Regional Database•More infants (0-6mths) screened asunderweight◦Breastfed infants gain weight faster thanformula-fed infants; <strong>WHO</strong> curve shifts upward◦After that, it’s the reverse•Higher stunting rates19
What to expect?•More children classified as overweight orobese•Lower prevalence of wasting20
Using the <strong>growth</strong> <strong>charts</strong>•Based on immunization schedule,additional visits within first month and at 9months (i.e. 1-2weeks, 1,2,4,6,9,12,18,24 months and4-6 yrs)•Pre-term infants (
Interpreting <strong>growth</strong> <strong>charts</strong>•Serial measurements more meaningfulthan single reading•Trajectory towards vs. away from themean (i.e. 50 th %tile)Direction of serial measurements more importantthan actual percentile22
Interpreting <strong>growth</strong> <strong>charts</strong>•Percentile positions of variousanthropometric measures (i.e. length,weight, head circ.) are quite similar•Do not wait until curve crosses 2 or morepercentiles◦<strong>WHO</strong> percentile curves are further apart23
Tools and Resources24
<strong>WHO</strong> Growth Charts•Copies accessible from:http://www.dietitians.ca/resources/resourcesearch.asp?fn=view&contentid=1451725
ReferencesCorby L, Secker D. Growth Monitoring of Infants and Children Using the 2006 World <strong>Health</strong>Organizaion [<strong>WHO</strong>] Child Growth Standards and 2007 <strong>WHO</strong> Growth References –Questions and Answers for <strong>Health</strong> Professionals. Current Issues- <strong>The</strong> Inside Story. 2010.Available from: http://www.dietitians.ca/members_only/backgrounders.aspDietitians of Canada, Canadian Paediatric Society, <strong>The</strong> College of <strong>Family</strong> Physicians ofCanada and Community <strong>Health</strong>y Nurses of Canada. <strong>The</strong> Use of Growth Charts forAssessing and Monitoring Growth in Canadian Infants and Children. Can J Diet Prac Res2004; 65:22-32.Dietitians of Canada, Canadian Paediatric Society, <strong>The</strong> College of <strong>Family</strong> Physicians ofCanada and Community <strong>Health</strong>y Nurses of Canada. Promoting Optimal Monitoring of ChildGrowth in Canada: Using the <strong>New</strong> <strong>WHO</strong> Growth Charts. 2010. Available from:http://www.dietitians.ca/pdf/Growth_Charts_DC_full_report_Feb10.pdfWorld <strong>Health</strong> Organization. What are the <strong>WHO</strong> Child Growth Standards?. Available from:http://www.who.int/nutrition/media_page/backgrounders_1_en.pdfWorld <strong>Health</strong> Organization. What Impact Will the <strong>WHO</strong> Child Growth Standards Have?.Available from: http://www.who.int/nutrition/media_page/backgrounders_2_en.pdfWorld <strong>Health</strong> Organization. <strong>WHO</strong> Child Growth Standards and Infant and Young ChildrenFeeding. Available from: http://www.who.int/nutrition/media_page/backgrounders_3_en.pdfWorld <strong>Health</strong> Organization. Training Course on Child Growth Assessment. 2008. Availablefrom: http://www.who.int/child<strong>growth</strong>/training/en/26
Useful links from DC•<strong>Health</strong> Professional’s Guide to Using the<strong>WHO</strong> <strong>growth</strong> <strong>charts</strong>http://www.dietitians.ca/pdf/DC_<strong>Health</strong>ProGrowthGuideE_BW.pdf•Handout for parentshttp://www.dietitians.ca/pdf/DC_ChildGrowParentsE_BW.pdf27
More useful links from <strong>WHO</strong>•Investigating causes of under- or overnutritionhttp://www.who.int/child<strong>growth</strong>/training/jobaid_investigating_causes.pdf•Training Module and other toolshttp://www.who.int/child<strong>growth</strong>/training/en/28