Geologic Mapping in Utah - Utah Geological Survey - Utah.gov
Geologic Mapping in Utah - Utah Geological Survey - Utah.gov
Geologic Mapping in Utah - Utah Geological Survey - Utah.gov

You also want an ePaper? Increase the reach of your titles
YUMPU automatically turns print PDFs into web optimized ePapers that Google loves.
U T A H G E O L O G I C A L S U R V E Y<br />
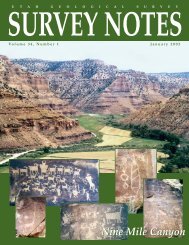
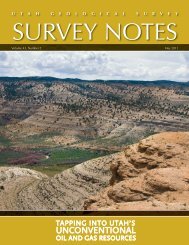
SURVEY NOTES<br />
Volume 40, Number 1<br />
<strong>Geologic</strong> <strong>Mapp<strong>in</strong>g</strong> <strong>in</strong> <strong>Utah</strong><br />
January 2008
CONTENTS<br />
GEOLOGIC MAPPING IN UTAH .......... 1–6<br />
Digital Technology ..............................1<br />
From Field to Published Map ......... 3<br />
News and Short Notes ...................... 5<br />
GeoSights ..................................................... 7<br />
Glad You Asked ........................................... 8<br />
Energy News ............................................ 10<br />
Teacher’s Corner ..................................... 11<br />
<strong>Survey</strong> News ............................................. 12<br />
New Publications .................................... 12<br />
Design: Liz Paton<br />
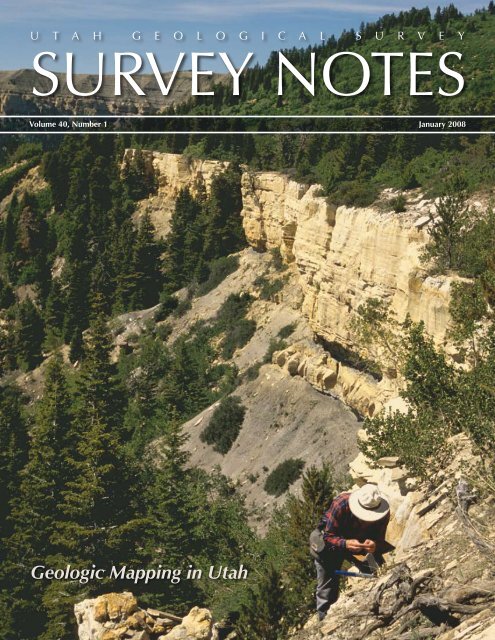
Cover: UGS geologist Bob Biek exam<strong>in</strong>es Cretaceous outcrop<br />
while mapp<strong>in</strong>g on the Kolob Terrace near Zion National<br />
Park. Photo by Mike Hylland.<br />
State of <strong>Utah</strong><br />
Jon Huntsman, Jr., Governor<br />
Department of Natural Resources<br />
Michael Styler, Executive Director<br />
UGS Board<br />
Steve Church, Chair<br />
Geoff Bedell Jack Hamilton<br />
Mark Bunnell Alisa Schofield<br />
Kenneth Puchlik David Simon<br />
Kev<strong>in</strong> Carter (Trust Lands Adm<strong>in</strong>istration-ex officio)<br />
UGS Staff<br />
Adm<strong>in</strong>istration<br />
Richard G. Allis, Director<br />
Kimm Harty, Deputy Director<br />
John K<strong>in</strong>gsley, Associate Director<br />
Starr Soliz, Secretary/Receptionist<br />
Dianne Davis, Adm<strong>in</strong>istrative Secretary<br />
Kathi Galusha, Account<strong>in</strong>g Officer<br />
L<strong>in</strong>da Bennett, Account<strong>in</strong>g Technician<br />
Michael Hylland, Technical Reviewer<br />
Robert Ressetar, Technical Reviewer<br />
Editorial Staff Vicky Clarke<br />
Sharon Hamre, James Parker, Lori Douglas, Liz Paton<br />
<strong>Geologic</strong> Hazards Gary Christenson<br />
William Lund, Barry Solomon, Francis Ashland,<br />
Richard Giraud, Greg McDonald, Lucas Shaw,<br />
Chris DuRoss, Tyler Knudsen, Corey Unger<br />
Energy and M<strong>in</strong>erals David Tabet<br />
Robert Blackett, Roger Bon, Thomas Chidsey,<br />
Mike La<strong>in</strong>e, Bryce Tripp, Craig Morgan, Jeff Quick,<br />
J. Wallace Gwynn, Cheryl Gust<strong>in</strong>, Tom Dempster,<br />
Brigitte Hucka, Taylor Boden, Ken Krahulec, Valerie Davis,<br />
Stephanie Carney, Brad Wolverton, Mike Vanden Berg<br />
<strong>Geologic</strong> <strong>Mapp<strong>in</strong>g</strong> Grant Willis<br />
Jon K<strong>in</strong>g, Douglas Spr<strong>in</strong>kel, Janice Hayden, Kent Brown,<br />
Bob Biek, Basia Matyjasik, Lisa Brown, Don Clark,<br />
J. Buck Ehler, Paul Kuehne<br />
<strong>Geologic</strong> Information and Outreach Sandra Eldredge<br />
William Case, Mage Yonetani, Christ<strong>in</strong>e Wilkerson,<br />
Patricia Stokes, Mark Milligan, Rob Nielson, Jim Davis,<br />
Emily Chapman, Carole McCalla, Lance Weaver<br />
Ground Water and Paleontology Michael Lowe<br />
James Kirkland, Janae Wallace, Martha Hayden,<br />
Hugh Hurlow, Lucy Jordan, Don DeBlieux, Kim Nay,<br />
Stefan Kirby, Kev<strong>in</strong> Thomas, Rebecca Med<strong>in</strong>a,<br />
Jennifer Cav<strong>in</strong>, Walid Sabbah, Rich Emerson,<br />
Matt Affolter<br />
State Energy Program Philip Powlick<br />
Denise Beaudo<strong>in</strong>, Jason Berry, Will Chatw<strong>in</strong><br />
THE DIRECTOR’S PERSPECTIVE<br />
This issue of <strong>Survey</strong> Notes highlights<br />
the digital mapp<strong>in</strong>g technologies<br />
that the <strong>Utah</strong> <strong>Geologic</strong>al<br />
<strong>Survey</strong> (UGS) is now us<strong>in</strong>g to<br />
improve the efficiency and accuracy<br />
of <strong>Utah</strong>’s geologic maps. In comparison<br />
to the country as a whole,<br />
the percentage of the state covered<br />
by relatively detailed geologic maps<br />
is low. At present rates of mapp<strong>in</strong>g,<br />
we expect to complete geologic<br />
mapp<strong>in</strong>g of the whole state at a<br />
scale of 1:100,000 by about 2015; at<br />
the same time we are also mapp<strong>in</strong>g high-priority<br />
urban growth areas at 1:24,000. With the rapid<br />
population and economic growth <strong>in</strong> <strong>Utah</strong>,<br />
<strong>in</strong>creased awareness of natural hazards by local<br />
authorities, and an exploration boom caused by<br />
high prices for many natural resource commodities,<br />
the demand for geologic <strong>in</strong>formation has<br />
never been higher.<br />
The UGS has forwarded to the Governor’s Office<br />
of Plann<strong>in</strong>g and Budget (GOPB) its annual<br />
summary of m<strong>in</strong>eral resource production value<br />
<strong>in</strong> <strong>Utah</strong> for 2007 (see graph). Although the<br />
total value of $7.7 billion is 4 percent less than<br />
the record high value for 2006, the trend for<br />
the past two years is about double the average<br />
value for the 1980s and 1990s. The slight dip <strong>in</strong><br />
total value for 2007 is mostly due to a decrease<br />
<strong>in</strong> natural gas prices result<strong>in</strong>g from a local oversupply<br />
<strong>in</strong> the Rocky Mounta<strong>in</strong> region. In fact,<br />
<strong>Utah</strong>’s annual natural gas production <strong>in</strong>creased<br />
14 percent and is a record at 364 billion cubic<br />
feet. New pipel<strong>in</strong>es that are planned or under<br />
construction connect<strong>in</strong>g this region to other<br />
natural-gas-demand regions mean that the price<br />
M<strong>in</strong>eral Production (million $2007)<br />
8,000<br />
7,000<br />
6,000<br />
5,000<br />
4,000<br />
3,000<br />
2,000<br />
1,000<br />
by Richard G. Allis<br />
0<br />
uranium<br />
coal<br />
1960 1965 1970 1975 1980 1985 1990 1995 2000 2005<br />
Source: GOPB (2008). Economic Report to the<br />
Governor, Chapter on “M<strong>in</strong>erals” by UGS<br />
oil<br />
Year<br />
differential should dim<strong>in</strong>ish dur<strong>in</strong>g<br />
2008. <strong>Utah</strong>’s oil production<br />
<strong>in</strong> 2007 <strong>in</strong>creased by 9 percent<br />
to 19.5 million barrels, cont<strong>in</strong>u<strong>in</strong>g<br />
the growth trend that began<br />
<strong>in</strong> 2004 when oil prices started<br />
to rise. Coal production <strong>in</strong> 2007<br />
decreased by 10 percent to 24<br />
million tons due to m<strong>in</strong>e closures.<br />
Non-fuel m<strong>in</strong>eral production<br />
values cont<strong>in</strong>ue to be dom<strong>in</strong>ated<br />
by copper and molybdenum from<br />
the B<strong>in</strong>gham m<strong>in</strong>e. F<strong>in</strong>ally, uranium<br />
production resumed <strong>in</strong> 2007 <strong>in</strong> southeastern<br />
<strong>Utah</strong> after a 15-year lull. Expected production<br />
<strong>in</strong> 2008 should be sufficient to once aga<strong>in</strong><br />
show on the graph of total production value.<br />
The Energy Information Agency’s latest compilation<br />
of oil and gas reserves <strong>in</strong> each state has<br />
<strong>Utah</strong> at or near the top for reserve additions <strong>in</strong><br />
both oil and natural gas (EIA, 2006 annual report,http://www.eia.doe.<strong>gov</strong>/pub/oil_gas/natural_gas/data_publications/advanced_summary/<br />
current/adsum.pdf). Although total oil reserves<br />
for the U.S. decreased by 3.6 percent, <strong>Utah</strong> had<br />
the largest reserve additions (78 million barrels,<br />
or 30 percent <strong>in</strong>crease) compared to 2005<br />
reserves. <strong>Utah</strong> also had the third-largest natural<br />
gas reserve additions (850 billion cubic feet, or<br />
20 percent <strong>in</strong>crease) to the national total, which<br />
<strong>in</strong>creased by 3.3 percent <strong>in</strong> 2006. The ratio of<br />
total reserves to the annual production rate for<br />
<strong>Utah</strong> has risen to 17 years for oil and 14 years for<br />
natural gas, which is near the historical maximum<br />
for each product. Drill<strong>in</strong>g <strong>in</strong> <strong>Utah</strong> has<br />
cont<strong>in</strong>ued at record high levels through 2007,<br />
with over 1100 wells spudded (Division of Oil,<br />
Gas and M<strong>in</strong><strong>in</strong>g, http://<br />
oilgas.ogm.utah.<strong>gov</strong>/<br />
Statistics/Statistics.cfm).<br />
In 2007, over 50 percent<br />
of wells exceeded 8000<br />
feet, compared to only 32<br />
percent of wells just five<br />
years earlier. The deeper<br />
drill<strong>in</strong>g is f<strong>in</strong>d<strong>in</strong>g new<br />
gas reserves, particularly<br />
<strong>in</strong> the U<strong>in</strong>ta Bas<strong>in</strong>. The<br />
UGS expects these suc-<br />
natural gas<br />
cesses to cont<strong>in</strong>ue, and<br />
for the m<strong>in</strong>eral resources<br />
sector to play an important<br />
part <strong>in</strong> <strong>Utah</strong>’s vibrant<br />
economy.<br />
nonfuel m<strong>in</strong>erals<br />
<strong>Survey</strong> Notes is published three times yearly by the <strong>Utah</strong> <strong>Geologic</strong>al <strong>Survey</strong>, 1594 W. North Temple, Suite 3110, Salt Lake City, <strong>Utah</strong> 84116; (801) 537-3300. The <strong>Utah</strong> <strong>Geologic</strong>al <strong>Survey</strong> provides<br />
timely scientific <strong>in</strong>formation about <strong>Utah</strong>’s geologic environment, resources, and hazards. The UGS is a division of the Department of Natural Resources. S<strong>in</strong>gle copies of <strong>Survey</strong> Notes are distributed<br />
free of charge with<strong>in</strong> the United States and reproduction is encouraged with recognition of source. Copies are available at http://geology.utah.<strong>gov</strong>/surveynotes<br />
ISSN 1061-7930
Us<strong>in</strong>g Digital Technology <strong>in</strong> the Field<br />
by Douglas A. Spr<strong>in</strong>kel and Kent D. Brown<br />
The <strong>Utah</strong> <strong>Geologic</strong>al <strong>Survey</strong><br />
(UGS) works hard to publish<br />
high-quality geologic maps of<br />
<strong>Utah</strong>. We have been successful<br />
because of the comb<strong>in</strong>ed efforts<br />
of dedicated geologists and<br />
cartographers us<strong>in</strong>g cutt<strong>in</strong>gedge<br />
technologies. Recently,<br />
the availability of rugged, portable<br />
computer equipment and<br />
specialized software has taken<br />
our field acquisition of geologic<br />
data <strong>in</strong>to the digital age.<br />
Each geologic map that the<br />
UGS produces requires fieldwork<br />
where geologic <strong>in</strong>forma-<br />
tion is recorded on aerial photographs,<br />
topographic maps,<br />
and <strong>in</strong> notebooks. Through<br />
the 1980s, geologic l<strong>in</strong>es were<br />
hand-transferred to a polyester<br />
film topographic base map,<br />
and then the map was f<strong>in</strong>alized<br />
us<strong>in</strong>g analog cartographic techniques.<br />
S<strong>in</strong>ce about 1991, however,<br />
we have <strong>in</strong>creas<strong>in</strong>gly used<br />
digital technologies to transfer<br />
field mapp<strong>in</strong>g, create an editable<br />
geologic map, and prepare<br />
f<strong>in</strong>al maps for publication<br />
(see companion article <strong>in</strong> this<br />
issue). Now, we are beg<strong>in</strong>n<strong>in</strong>g<br />
to use digital technologies <strong>in</strong><br />
the field to further streaml<strong>in</strong>e<br />
map preparation. An ongo<strong>in</strong>g<br />
project to geologically map<br />
several 30' x 60' quadrangles<br />
(1:100,000 scale) <strong>in</strong> the U<strong>in</strong>ta<br />
Mounta<strong>in</strong>s and U<strong>in</strong>ta Bas<strong>in</strong> <strong>in</strong><br />
northeastern <strong>Utah</strong> illustrates<br />
how the mapp<strong>in</strong>g process has<br />
evolved.<br />
In 1999–2001, we mapped<br />
the Dutch John quadrangle<br />
us<strong>in</strong>g traditional methods;<br />
these <strong>in</strong>cluded <strong>in</strong>k<strong>in</strong>g l<strong>in</strong>es<br />
and po<strong>in</strong>ts on “stereo pairs” of<br />
aerial photographs (overlapp<strong>in</strong>g<br />
aerial photos that, when<br />
viewed through a stereoscope,<br />
produce a three-dimensional<br />
image of the terra<strong>in</strong>). We then<br />
hand-transferred the l<strong>in</strong>es<br />
and po<strong>in</strong>ts onto orthophoto<br />
quadrangle base maps. The<br />
GEOLOGIC<br />
MAPPING IN UTAH<br />
<strong>in</strong>ked orthophotos were then<br />
photographically reduced to<br />
the same scale as the polyester<br />
film base that would be used to<br />
produce the f<strong>in</strong>al map. The reduced<br />
orthophotos were placed<br />
under the polyester film base,<br />
onto which the geologic l<strong>in</strong>es<br />
and po<strong>in</strong>ts were then traced.<br />
Each l<strong>in</strong>e and po<strong>in</strong>t, therefore,<br />
was redrawn three times to get<br />
to this stage! Additional <strong>in</strong>k<strong>in</strong>g<br />
was needed dur<strong>in</strong>g review<br />
of the geologic map prior to<br />
open-file release.<br />
The next map <strong>in</strong> the project,<br />
the Vernal quadrangle, was the<br />
first quadrangle <strong>in</strong> which field<br />
mapp<strong>in</strong>g and later steps were<br />
done digitally. In the field,<br />
we used a portable computer<br />
called a tablet to record geologic<br />
<strong>in</strong>formation. Specialized<br />
Above: A UGS geologist uses a tablet computer to record field data on the<br />
outcrop.<br />
Left: A screen-captured image from the tablet computer show<strong>in</strong>g the<br />
geology of part of Flam<strong>in</strong>g Gorge overla<strong>in</strong> on a color digital orthophoto.<br />
JANUARY 2008 1
This picture of the “Red Fleet” <strong>in</strong> the Dutch John quadrangle was taken with a digital camera, transferred to the tablet computer, and then annotated <strong>in</strong><br />
the field from where it was taken.<br />
software allows the user to draw l<strong>in</strong>es and<br />
po<strong>in</strong>ts on digital base maps and then transfer<br />
the data directly <strong>in</strong>to the office computer<br />
used to f<strong>in</strong>alize the map. This elim<strong>in</strong>ates<br />
the several steps of hand-transferr<strong>in</strong>g<br />
and re-<strong>in</strong>k<strong>in</strong>g required by the traditional<br />
methods. We are cont<strong>in</strong>u<strong>in</strong>g to ref<strong>in</strong>e the<br />
digital methods dur<strong>in</strong>g our current mapp<strong>in</strong>g<br />
of the Seep Ridge quadrangle.<br />
For the most part, geologic mapp<strong>in</strong>g us<strong>in</strong>g<br />
digital field techniques is similar to<br />
traditional methods. A geologist still goes<br />
to the field with a rock hammer, hand lens,<br />
pocket transit compass, and stereo pairs of<br />
aerial photographs to map formation contacts<br />
and faults, measure bedd<strong>in</strong>g attitudes<br />
(strike and dip), collect samples, and take<br />
field notes. However, <strong>in</strong>stead of draw<strong>in</strong>g<br />
l<strong>in</strong>es on aerial photographs or topographic<br />
base maps, the geologist draws l<strong>in</strong>es on<br />
2 SURVEY NOTES<br />
digital images (digital raster graphic<br />
[DRG] topographic or digital orthophoto<br />
base maps) displayed on the tablet’s screen.<br />
The screen is touch-sensitive, allow<strong>in</strong>g the<br />
geologist to draw l<strong>in</strong>es us<strong>in</strong>g a stylus or<br />
digital pen. In addition, geologic features<br />
can be added to the map “on the fly” as the<br />
geologist walks the contact or fault with an<br />
<strong>in</strong>tegrated global position<strong>in</strong>g system (GPS)<br />
receiver. Other geologic features such as<br />
bedd<strong>in</strong>g attitudes and sample locations<br />
are also easily and accurately recorded<br />
us<strong>in</strong>g the GPS receiver and are immediately<br />
displayed on the tablet’s screen.<br />
Field notes are electronically written <strong>in</strong>to<br />
word-process<strong>in</strong>g files us<strong>in</strong>g the stylus or<br />
portable external keyboard. F<strong>in</strong>ally, digital<br />
photography permits the geologist to take<br />
a picture of a scene, transfer the image to<br />
the tablet computer, and then annotate the<br />
photograph <strong>in</strong> the field.<br />
Digital geologic field mapp<strong>in</strong>g offers several<br />
advantages over traditional methods,<br />
but some of the “old” techniques are still<br />
needed. For example, the tablet cannot<br />
display stereo images, so stereo pairs of<br />
aerial photographs and a stereoscope are<br />
still needed to see the geology “from the<br />
air” <strong>in</strong> three dimensions. Compared to<br />
traditional methods as a whole, however,<br />
digital geologic mapp<strong>in</strong>g is more accurate,<br />
permits the geologist to consistently attribute<br />
data <strong>in</strong> its f<strong>in</strong>al form, and reduces<br />
errors, all of which save time. Ultimately,<br />
digital mapp<strong>in</strong>g techniques help us <strong>in</strong> our<br />
goal to provide accurate geologic maps <strong>in</strong><br />
a timely manner for effective understand<strong>in</strong>g<br />
and stewardship of <strong>Utah</strong>’s geologic<br />
resources.
From Field <strong>Mapp<strong>in</strong>g</strong> To Published Map<br />
by Kent D. Brown<br />
Most of us are familiar with photographs<br />
of early explorers of the American West,<br />
fight<strong>in</strong>g for their lives try<strong>in</strong>g to maneuver<br />
overloaded wooden boats down the rag<strong>in</strong>g<br />
Colorado River. Some of these explorers<br />
were geologists determ<strong>in</strong>ed to map the<br />
rugged expanse of unknown territory. Not<br />
only did they map the geology, but they<br />
also spent long periods of time mak<strong>in</strong>g<br />
relatively crude topographic maps on<br />
which the geologic maps were constructed.<br />
Today, geologic mapp<strong>in</strong>g <strong>in</strong> <strong>Utah</strong> cont<strong>in</strong>-<br />
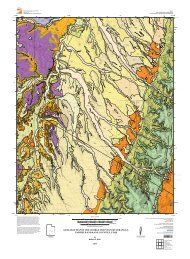
A<br />
B<br />
In one method of geologic map production, a geologist’s<br />
orig<strong>in</strong>al mapp<strong>in</strong>g on a paper base map (A) is scanned,<br />
the result<strong>in</strong>g raster image is geospatially corrected, and<br />
then the raster image is converted to vector l<strong>in</strong>es (B).<br />
ues with the same spirit of exploration and<br />
discovery, but of course is be<strong>in</strong>g done us<strong>in</strong>g<br />
vastly superior tools and techniques.<br />
<strong>Geologic</strong> mapp<strong>in</strong>g techniques have undergone<br />
major changes s<strong>in</strong>ce those early days<br />
of lugg<strong>in</strong>g unwieldy equipment to remote<br />
locations <strong>in</strong> boats and on the backs of men<br />
and beasts. As with most technological<br />
advances, over the next half century equipment<br />
got better, smaller, and less expensive.<br />
A major advance came <strong>in</strong> the 1940s<br />
when aerial-photography technology<br />
greatly expanded and aerial<br />
photos became available to geologists.<br />
Draw<strong>in</strong>g geologic features on<br />
stereo aerial photos (paired photos<br />
that produce a three-dimensional<br />
[3-D] image) became commonplace<br />
after World War II, and complex<br />
mach<strong>in</strong>es used to transfer this <strong>in</strong>formation<br />
onto an accurately scaled<br />
map were available; this stereo process<br />
is known as photogrammetry.<br />
Today this technology cont<strong>in</strong>ues to<br />
advance with digital aerial cameras<br />
and photogrammetry accomplished<br />
us<strong>in</strong>g computer software.<br />
The <strong>Geologic</strong> <strong>Mapp<strong>in</strong>g</strong> Program of<br />
the <strong>Utah</strong> <strong>Geologic</strong>al <strong>Survey</strong> uses a<br />
comb<strong>in</strong>ation of up-to-date software<br />
technologies and proven traditional<br />
methods to prepare geologic maps<br />
for publication. Field mapp<strong>in</strong>g<br />
techniques used by geologists are<br />
numerous, but produc<strong>in</strong>g a prelim<strong>in</strong>ary<br />
geologic map suitable for<br />
open-file release generally <strong>in</strong>volves<br />
one of three methods: (1) direct<br />
mapp<strong>in</strong>g on aerial photographs and<br />
then redraw<strong>in</strong>g the geologic features<br />
on paper topographic maps (base<br />
maps with or without superimposed<br />
photographic images), (2) direct<br />
mapp<strong>in</strong>g on aerial photographs and<br />
GEOLOGIC<br />
MAPPING IN UTAH<br />
then us<strong>in</strong>g photogrammetry software to<br />
digitally transfer the geologic features,<br />
<strong>in</strong> stereo, to a Computer Aided Design<br />
(CAD) file compatible with Geographic<br />
Information System (GIS) software, or (3)<br />
digitally collect<strong>in</strong>g and attribut<strong>in</strong>g geologic<br />
data <strong>in</strong> the field us<strong>in</strong>g a rugged tablet<br />
computer with <strong>in</strong>tegrated Global Position<strong>in</strong>g<br />
System (GPS) receiver and geospatial<br />
software, which creates GIS data. The term<br />
“geospatial” is used here to describe geographic<br />
data that are accurately referenced<br />
to a precise location on Earth’s surface.<br />
Each of these methods has its strengths<br />
and weaknesses, and the need for flexibility<br />
and <strong>in</strong>dividual mapp<strong>in</strong>g style make<br />
them all valid techniques.<br />
In the first method, we scan and geospatially<br />
correct the paper map drafted by the<br />
field geologist. Scann<strong>in</strong>g the paper map<br />
converts it to a raster image much like a<br />
digital camera converts a scene to a file of<br />
image pixels. For our maps, this image is<br />
then corrected to make it fit a real-world<br />
coord<strong>in</strong>ate system. From this geospatially<br />
corrected image, the geologic map is<br />
digitally vectorized. We use software that<br />
converts the raster image to vectors—<strong>in</strong><br />
other words, it makes l<strong>in</strong>es from image<br />
pixels. The result is a multi-layered CAD<br />
file that can be imported <strong>in</strong>to GIS software<br />
to create a fully attributed geodatabase<br />
(computer database of geographic map<br />
features) of the geologic map.<br />
The second method is the most precise<br />
and technically advanced way we create<br />
geologic maps and reduces errors caused<br />
by copy<strong>in</strong>g l<strong>in</strong>es twice <strong>in</strong> the paper map<br />
method. Two aerial photographs hav<strong>in</strong>g<br />
60 percent overlap are referred to as a stereo<br />
pair; this overlap is needed to use photogrammetry.<br />
When positioned correctly<br />
this pair of photos can be viewed <strong>in</strong> stereo<br />
show<strong>in</strong>g 3-D depth of view. However,<br />
JANUARY 2008 3
Top: For some mapp<strong>in</strong>g projects, geologists compile geologic<br />
data <strong>in</strong> stereo on a computer monitor with the help of special<br />
glasses.<br />
Bottom: Another method of geologic data collection uses a<br />
rugged tablet computer and GIS software. Images of topographic<br />
maps and orthophotos are displayed on the screen<br />
to aid the geologist when record<strong>in</strong>g geologic data <strong>in</strong> the field.<br />
Doug Spr<strong>in</strong>kel is a Senior Geologist<br />
with<strong>in</strong> the UGS <strong>Geologic</strong><br />
<strong>Mapp<strong>in</strong>g</strong> Program. His<br />
pr<strong>in</strong>cipal responsibility is to<br />
map the geology of the U<strong>in</strong>ta<br />
Mounta<strong>in</strong>s and U<strong>in</strong>ta Bas<strong>in</strong>.<br />
In addition to his mapp<strong>in</strong>g<br />
efforts <strong>in</strong> northeastern <strong>Utah</strong>,<br />
Doug has mapped quadrangles<br />
<strong>in</strong> the central <strong>Utah</strong> thrust<br />
belt. Other ongo<strong>in</strong>g projects<br />
<strong>in</strong>clude a study of Middle Jurassic<br />
strata and unconformities and regional correlation of<br />
Lower Jurassic rocks. Doug has co-edited two popular books<br />
on <strong>Utah</strong> geology and authored or co-authored 6 geologic<br />
maps, 54 professional articles, and 25 abstracts.<br />
4 SURVEY NOTES<br />
this stereo view is considered raw or distorted. To accurately map us<strong>in</strong>g this<br />
photo pair, we scan them at high resolution (1000+ dpi) and save the images<br />
as Tagged Image Format (TIF) files. Then, we use photogrammetry software<br />
to perform spatial orientations on the TIF images to correct all distortion,<br />
accurately scale them, and assign real-world coord<strong>in</strong>ates to this stereo image.<br />
When completed, these steps allow the geologist to view the map area on the<br />
computer monitor, <strong>in</strong> stereo, through special glasses. The geologic features are<br />
then drawn on the 3-D surface the geologist sees us<strong>in</strong>g a software <strong>in</strong>put device<br />
known as a “3-D Mouse.” With this process we create a very precise and<br />
feature-rich 3-D CAD file that is then imported <strong>in</strong>to GIS software to create a<br />
geodatabase of the geologic map.<br />
The third method allows the mapp<strong>in</strong>g geologist to use a rugged tablet computer<br />
and GIS software <strong>in</strong> the field (see companion article <strong>in</strong> this issue). Digital<br />
base map images are displayed on the screen for positional reference; among<br />
them are topographic, geospatially corrected photographic (orthophoto),<br />
and shaded-relief maps, as well as images of other geologic maps. The GIS<br />
software is configured to use data <strong>in</strong>put forms, with pull-down pick-lists, to<br />
simplify and standardize the collection of geologic data. It can also store field<br />
notes and digital photographs of sights <strong>in</strong> the field mapp<strong>in</strong>g area. This method<br />
allows the geologist to create a digital map <strong>in</strong> the field with attributed and<br />
colored map-unit polygons, geologic symbols, and feature labels. Although<br />
the tablet computer cannot display stereo images, and geologic l<strong>in</strong>es drawn us<strong>in</strong>g<br />
the tablet tend to be less precise than when us<strong>in</strong>g photogrammetry, use of<br />
the tablet can save significant amounts of time <strong>in</strong> the overall mapp<strong>in</strong>g process.<br />
Regardless of which method is employed, the prelim<strong>in</strong>ary data are used to<br />
make <strong>in</strong>kjet plots of the maps for review. After the geologist’s review, GIS<br />
analysts <strong>in</strong> the UGS <strong>Geologic</strong> <strong>Mapp<strong>in</strong>g</strong> Program create GIS geodatabases<br />
conform<strong>in</strong>g to UGS data standards. From these geodatabases, files are created<br />
to use <strong>in</strong> publication software to make formal geologic map layouts and map<br />
explanation sheets. Then, after UGS review and approval, f<strong>in</strong>al-version map<br />
files are sent to a pr<strong>in</strong>t<strong>in</strong>g company or are used to pr<strong>in</strong>t maps <strong>in</strong>-house on<br />
<strong>in</strong>kjet plotters.<br />
About the Authors<br />
Kent Brown is a GIS analyst and<br />
photogrammetrist with the UGS<br />
<strong>Geologic</strong> <strong>Mapp<strong>in</strong>g</strong> Program and<br />
has been <strong>in</strong>strumental <strong>in</strong> the development<br />
of the program’s geologic<br />
map publication methods.<br />
He jo<strong>in</strong>ed the UGS <strong>in</strong> 1983 and<br />
served as Senior Cartographer<br />
<strong>in</strong> the Editorial Program before<br />
transferr<strong>in</strong>g to the <strong>Geologic</strong><br />
<strong>Mapp<strong>in</strong>g</strong> Program <strong>in</strong> 1990 to<br />
manage a newly acquired photogrammetry<br />
system. S<strong>in</strong>ce 2002, up-to-date digital photogrammetry<br />
methods have been used and he has developed a system<br />
for standardized geologic data creation that is compatible with<br />
GIS software.
News and Short Notes<br />
by Grant C. Willis<br />
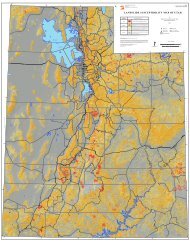
Status of 7.5’ and 30’x60’ Quadrangle Series<br />
The UGS <strong>Geologic</strong> <strong>Mapp<strong>in</strong>g</strong> Program produces geologic maps at<br />
two primary scales—1:24,000 (7.5' quadrangles) and 1:100,000<br />
(30'x60' quadrangles). All maps are released as published maps<br />
or open-file reports as soon as possible after completion, and are<br />
available <strong>in</strong> pr<strong>in</strong>ted (press run) or plot-on-demand formats from<br />
the DNR Map and Bookstore, and for view<strong>in</strong>g and download<strong>in</strong>g<br />
from the UGS Web site (geology.utah.<strong>gov</strong>). All 30'x60' quadrangles,<br />
and a few 7.5' quadrangles and other maps, are also produced<br />
<strong>in</strong> Geographic Information System (GIS) format (menu-driven<br />
CDs are available for purchase from the DNR Map and Bookstore;<br />
“bare-bones” GIS files are available for download<strong>in</strong>g from the<br />
UGS Web site—see “GIS Maps Onl<strong>in</strong>e”).<br />
GEOLOGIC<br />
MAPPING IN UTAH<br />
<strong>Utah</strong> is covered by 46 U.S. <strong>Geologic</strong>al <strong>Survey</strong> (USGS) 30'x60'<br />
quadrangles (plus a narrow strip of 10 more along the western<br />
border with Nevada). We are systematically mapp<strong>in</strong>g the geology<br />
of all 1:100,000-scale quadrangles with a goal to complete the state<br />
by 2015. Each quadrangle takes a geologist about three years to<br />
complete by compil<strong>in</strong>g exist<strong>in</strong>g maps where suitable and conduct<strong>in</strong>g<br />
new mapp<strong>in</strong>g where needed. Currently, about 26 quadrangles<br />
have been completed (20 <strong>in</strong> color and the rest <strong>in</strong> black and white),<br />
and GIS database files have been completed for about 19 quadrangles.<br />
<strong>Utah</strong> is covered by 1512 USGS 7.5' quadrangles (exclud<strong>in</strong>g a few<br />
t<strong>in</strong>y slivers where the state boundary jogs). Currently, geologic<br />
mapp<strong>in</strong>g of 458 quadrangles has been completed<br />
(though some need to be updated) and mapp<strong>in</strong>g<br />
of 47 is <strong>in</strong> progress by UGS, USGS, and university<br />
geologists. Each quadrangle requires about a year of<br />
work, <strong>in</strong>clud<strong>in</strong>g field mapp<strong>in</strong>g, compilation, writ<strong>in</strong>g,<br />
and reviews. At this rate, the daunt<strong>in</strong>g task of<br />
mapp<strong>in</strong>g the entire state will require nearly 100 years,<br />
so the UGS focuses on areas that the State <strong>Mapp<strong>in</strong>g</strong><br />
Advisory Committee (representatives from federal,<br />
state, and local land-management agencies, geologic<br />
associations, universities, and others <strong>in</strong>terested <strong>in</strong><br />
geologic mapp<strong>in</strong>g) designates as top priorities. Most<br />
top-priority quadrangles are <strong>in</strong> the Wasatch Front<br />
and St. George/Cedar City/Kanab areas, though a few<br />
are near other grow<strong>in</strong>g cities and <strong>in</strong> popular recreation<br />
and economic resource areas.<br />
GIS Maps Onl<strong>in</strong>e<br />
In the September 2006 issue of <strong>Survey</strong> Notes, we announced<br />
the start of a new <strong>in</strong>itiative to make Geographic<br />
Information System (GIS) files of geologic<br />
maps available onl<strong>in</strong>e. Recently, we posted our 20th<br />
GIS map, mak<strong>in</strong>g our Web site the premier source of<br />
GIS geologic map data for <strong>Utah</strong>. The site is grow<strong>in</strong>g<br />
fast—five more maps should be posted over the next<br />
six months. Check out our Web site at geology.utah.<br />
<strong>gov</strong>; click on: maps and publications/onl<strong>in</strong>e maps/<br />
GIS.<br />
STATEMAP, FEDMAP, EDMAP<br />
The National Cooperative <strong>Geologic</strong> <strong>Mapp<strong>in</strong>g</strong> Program,<br />
which is funded by an act of the U.S. Congress,<br />
JANUARY 2008 5
forms the backbone of geologic mapp<strong>in</strong>g <strong>in</strong> the United States.<br />
First passed <strong>in</strong> 1992 through the lobby<strong>in</strong>g efforts of many geologists<br />
and geologic organizations, state and local <strong>gov</strong>ernments,<br />
the USGS, educators at all levels, and large and small <strong>in</strong>dustries<br />
of many types, this popular program has been reauthorized<br />
twice. It conta<strong>in</strong>s three mapp<strong>in</strong>g components: STATEMAP,<br />
FEDMAP, and EDMAP. The STATEMAP component funds<br />
a large percentage of UGS geologic mapp<strong>in</strong>g, FEDMAP funds<br />
USGS geologic mapp<strong>in</strong>g, and EDMAP makes funds available<br />
to universities.<br />
Through the FEDMAP program, the USGS recently funded<br />
David Miller, a USGS geologist who has produced many maps<br />
for the UGS, to complete the Newfoundland Mounta<strong>in</strong>s and<br />
Tremonton 30'x60' quadrangles, and the M<strong>in</strong>ers Canyon 7.5'<br />
quadrangle on the border with Nevada. He started these<br />
projects <strong>in</strong> the early 1990s, but was then transferred to other<br />
parts of the country when the USGS suffered a large f<strong>in</strong>ancial<br />
cutback. We are pleased that these important projects will<br />
soon be completed.<br />
The EDMAP program provides funds for graduate and undergraduate<br />
students and their professors to complete geologic<br />
mapp<strong>in</strong>g and mapp<strong>in</strong>g-related projects. About a dozen ED-<br />
MAP projects have been completed <strong>in</strong> <strong>Utah</strong> <strong>in</strong> the past decade.<br />
Five new projects were funded <strong>in</strong> early 2007: Jessen Butte 7.5'<br />
quadrangle <strong>in</strong> Daggett County (Brigham Young University),<br />
K<strong>in</strong>gs Peak 7.5' quadrangle <strong>in</strong> Summit and Duchesne Counties<br />
(Idaho State University), Brian Head 7.5' quadrangle <strong>in</strong><br />
Iron County (Southern <strong>Utah</strong> University), parts of Stockton and<br />
South Mounta<strong>in</strong> 7.5' quadrangles <strong>in</strong> Tooele County (University<br />
of <strong>Utah</strong>), and a study of the Proterozoic rocks of the U<strong>in</strong>ta<br />
Mounta<strong>in</strong>s (<strong>Utah</strong> State University). We recently wrote letters<br />
support<strong>in</strong>g eight new proposals for 2008, and are hopeful that<br />
all of these new projects will be funded.<br />
UGS Garners Top STATEMAP Proposal Award<br />
Each year the UGS competes with about 45 other state geological surveys for match<strong>in</strong>g STATEMAP funds that support about onethird<br />
of our geologic mapp<strong>in</strong>g effort. A national committee of state and USGS geologists scores proposals and awards funds. The UGS<br />
has traditionally done very well—generally we are one of the top five states. Recently, we were notified that we received the top score<br />
and largest award for 2007–08 mapp<strong>in</strong>g—$246,075. With the state match, this nearly half-million-dollar project is fund<strong>in</strong>g cont<strong>in</strong>ued<br />
geologic mapp<strong>in</strong>g <strong>in</strong> the Seep Ridge (U<strong>in</strong>tah, Duchesne, and Carbon Counties), Wildcat Mounta<strong>in</strong> (Tooele County), and Caliente<br />
(westernmost Iron and Wash<strong>in</strong>gton Counties) 30'x60' quadrangles; Orem, Pelican Po<strong>in</strong>t, and Rays Valley (<strong>Utah</strong> County), Farm<strong>in</strong>gton<br />
(Davis County), Mount Pisgah (Cache and Box Elder Counties), Temple Mounta<strong>in</strong> (Emery County), and Mount Carmel (Kane<br />
County) 7.5' quadrangles; and GIS database production of the St. George and narrow strip of Clover Mounta<strong>in</strong> 30'x60' quadrangles<br />
(Wash<strong>in</strong>gton County).<br />
6 SURVEY NOTES
GEOSIGHTS<br />
The Onion Creek Salt Diapir, Grand County, <strong>Utah</strong><br />
by Carole McCalla<br />
Introduction: What’s that smell? Located <strong>in</strong> southeastern <strong>Utah</strong>’s<br />
slickrock country is a unique geologic feature with a dist<strong>in</strong>ct smell<br />
of its own. Aptly named, the Onion Creek salt diapir is near the<br />
Fisher Towers Recreation Site northeast of the town of Moab (for a<br />
description of Fisher Towers, see the “Geosights” article <strong>in</strong> the July<br />
2004 issue of <strong>Survey</strong> Notes). Flow<strong>in</strong>g through the diapir is St<strong>in</strong>k<strong>in</strong>g<br />
Spr<strong>in</strong>g, a naturally occurr<strong>in</strong>g sulfur-rich spr<strong>in</strong>g.<br />
<strong>Geologic</strong> Information: Dur<strong>in</strong>g the Pennsylvanian Period (about<br />
300 million years ago), most of <strong>Utah</strong> was covered by an ancient<br />
sea. The Moab area was located <strong>in</strong> an enormous depression called<br />
the Paradox Bas<strong>in</strong>. As sea levels fluctuated over millions of years,<br />
multiple cycles of flood<strong>in</strong>g and evaporat<strong>in</strong>g occurred <strong>in</strong> the bas<strong>in</strong>,<br />
leav<strong>in</strong>g thousands of feet of salt beh<strong>in</strong>d. The result<strong>in</strong>g Paradox<br />
Formation is 65 to 85 percent salt and is <strong>in</strong>terbedded with layers of<br />
gypsum and anhydrite.<br />
These salt beds eventually became buried by other rock layers.<br />
Because salt deposits are less dense than overly<strong>in</strong>g rock deposits,<br />
they behave buoyantly and rise toward the surface. The salt<br />
squeezes upward and <strong>in</strong>trudes <strong>in</strong>to the overly<strong>in</strong>g rocks through<br />
zones of weakness such as fractures and faults. As the salt moves,<br />
it bends and penetrates the overly<strong>in</strong>g rock. The <strong>in</strong>trud<strong>in</strong>g “salt<br />
bubbles” are called salt diapirs. (See “Teachers Corner” <strong>in</strong> this issue<br />
of <strong>Survey</strong> Notes for an illustration of a salt diapir.)<br />
So, what about that st<strong>in</strong>ky smell? Sulfur is present <strong>in</strong> the area,<br />
which results <strong>in</strong> the smell. Where did the sulfur come from? Salt<br />
diapirs develop a cap rock of relatively <strong>in</strong>soluble anhydrite and<br />
gypsum (calcium-sulfate m<strong>in</strong>erals) which accumulate as the result<br />
of leach<strong>in</strong>g dur<strong>in</strong>g the diapir’s rise toward the surface. The cap<br />
rock conta<strong>in</strong>s sulfate-reduc<strong>in</strong>g bacteria that produce sulfur and<br />
hydrogen-sulfide gas. St<strong>in</strong>k<strong>in</strong>g Spr<strong>in</strong>g carries the foul-smell<strong>in</strong>g<br />
sulfurous gas to the surface.<br />
In most environments,<br />
salt<br />
that reaches the<br />
surface weathers<br />
rapidly<br />
because salt is<br />
very soluble. The<br />
salt of the Onion<br />
Creek diapir is<br />
still exposed and<br />
visible, at least for<br />
now. However,<br />
probably only a<br />
small amount is<br />
visible compared<br />
to what has<br />
already been dissolved<br />
away.<br />
How to get there: From Moab, travel approximately<br />
2 miles northwest along U.S. 191 to the<br />
turnoff for <strong>Utah</strong> State Highway 128. Turn right<br />
(northeast) and travel approximately 20 miles<br />
to the turnoff at Onion Creek Road (just past<br />
Sorrel River Ranch Resort). Fisher Towers can<br />
be seen to the east at the turnoff. Turn right<br />
(east), leave the pavement, and proceed 5 to<br />
6 miles to The Narrows and St<strong>in</strong>k<strong>in</strong>g Spr<strong>in</strong>g.<br />
Cont<strong>in</strong>ue 13 miles to Fisher Valley and the end<br />
of the graded road.<br />
The Onion Creek<br />
diapir is about 2<br />
miles long and 1<br />
mile wide. The<br />
white-colored<br />
salt and gypsum beds of the diapir are <strong>in</strong> strik<strong>in</strong>g contrast with the<br />
surround<strong>in</strong>g red rocks of the Triassic Moenkopi Formation (approximately<br />
245 million years old) and the reddish-brown sandstone,<br />
mudstone, and conglomerate of the Permian Cutler Formation (approximately<br />
290 million years old). The diapir conta<strong>in</strong>s numerous<br />
small faults and folds that resulted from the salt movement.<br />
The rocks and terra<strong>in</strong> of the area record a long history of deposition,<br />
deformation, and geomorphic change related to movement<br />
of the Onion Creek diapir. Several pulses of<br />
salt flowed <strong>in</strong>to the diapir between about<br />
2–3 million and 250,000 years ago, and the<br />
diapir may still be active today. Nearby<br />
Fisher Creek once flowed along the present<br />
course of Onion Creek to the Colorado<br />
River. The ris<strong>in</strong>g salt diapir created a natural<br />
dam that resulted <strong>in</strong> the deposition of over<br />
400 feet of bas<strong>in</strong>-fill sediments <strong>in</strong> Fisher<br />
Valley. After the bas<strong>in</strong> filled up, Fisher Creek<br />
established a new course to the Dolores<br />
River. Today, Onion Creek flows toward the<br />
Colorado River, through both the bas<strong>in</strong>-fill<br />
sediments and the diapir. Eventually, cont<strong>in</strong>ued<br />
headward erosion may allow Onion<br />
Creek to capture Fisher Creek, restor<strong>in</strong>g the<br />
orig<strong>in</strong>al dra<strong>in</strong>age course.<br />
View of the Onion Creek salt diapir look<strong>in</strong>g northwest.<br />
Note the tilted rock layers on the right. These<br />
deposits were folded upward as the salt penetrated<br />
through the Cutler Formation.<br />
JANUARY 2008 7
?? ?<br />
“GLAD YOU ASKED”<br />
The Earth produces a magnetic field similar to that produced by a bar<br />
magnet, as illustrated <strong>in</strong> this model us<strong>in</strong>g iron fil<strong>in</strong>gs. The iron fil<strong>in</strong>gs align<br />
themselves along the l<strong>in</strong>es of magnetic force generated by the magnet.<br />
8 SURVEY NOTES<br />
What is Magnetic<br />
Decl<strong>in</strong>ation?<br />
by Jim Davis<br />
Many people buy topographic maps to aid <strong>in</strong> backcountry<br />
navigation, but some do not know what to make of the<br />
rather cryptic <strong>in</strong>formation regard<strong>in</strong>g magnetic decl<strong>in</strong>ation.<br />
If it is pr<strong>in</strong>ted <strong>in</strong> the map marg<strong>in</strong>, it must be important. But<br />
what exactly is magnetic decl<strong>in</strong>ation?<br />
To understand magnetic decl<strong>in</strong>ation, it helps to first consider<br />
Earth’s magnetism. Molten iron circulat<strong>in</strong>g with<strong>in</strong> the<br />
Earth’s hot outer core generates electrical currents, which<br />
<strong>in</strong> turn generate a magnetic field similar to that of a giant<br />
bar magnet. The magnetic field arises <strong>in</strong> Earth’s <strong>in</strong>terior<br />
and extends over the surface, <strong>in</strong>to the atmosphere, and<br />
far <strong>in</strong>to space. The Earth’s magnetic field serves a number<br />
of useful and <strong>in</strong>terest<strong>in</strong>g purposes, such as protect<strong>in</strong>g<br />
the Earth from <strong>in</strong>com<strong>in</strong>g solar w<strong>in</strong>d particles, generat<strong>in</strong>g<br />
the spectacular polar auroral light displays, and assist<strong>in</strong>g<br />
many animal species <strong>in</strong> global navigation (for example, sea<br />
turtles, honeybees, whales and dolph<strong>in</strong>s, tuna and salmon,<br />
pigeons, sparrows and rob<strong>in</strong>s). The magnetic field is also<br />
important because it determ<strong>in</strong>es what direction a compass<br />
needle will po<strong>in</strong>t—the needle aligns with l<strong>in</strong>es of magnetic<br />
force at the Earth’s surface, l<strong>in</strong>es that converge at the<br />
magnetic poles.<br />
The Earth’s magnetic and geographic poles are <strong>in</strong> different<br />
places, and magnetic decl<strong>in</strong>ation is the angular difference<br />
between the direction a compass needle po<strong>in</strong>ts and<br />
the direction to the geographic North Pole. For most of<br />
the populated world, this angle is between zero and 30<br />
degrees. Currently, Salt Lake City has a magnetic decl<strong>in</strong>ation<br />
of about 12.5 degrees east (<strong>in</strong> other words, true north<br />
is 12.5 degrees west of the direction a compass needle<br />
po<strong>in</strong>ts), but the angle has been gett<strong>in</strong>g smaller over time.<br />
The geographic North and South Poles, located at 90°<br />
latitude, are stationary and co<strong>in</strong>cide with the axis of Earth’s<br />
daily rotation. Conversely, the magnetic poles migrate over<br />
time. First located <strong>in</strong> 1831, the North Magnetic Pole has<br />
s<strong>in</strong>ce moved hundreds of miles closer to the geographic<br />
North Pole. The North Magnetic Pole wobbles every day <strong>in</strong><br />
an elliptical path as much as 50 miles across, and it cont<strong>in</strong>uously<br />
drifts about 2–30 miles or more per year, occasionally<br />
chang<strong>in</strong>g direction. The rate of movement also changes.<br />
Over the past three decades the North Magnetic Pole’s rate<br />
of movement has greatly <strong>in</strong>creased (the South Magnetic<br />
Pole, just off Antarctica, has moved sluggishly by comparison).<br />
For a century the North Magnetic Pole has moved
northwest over northern Canada—it has accelerated, deserted<br />
Canada, and is trekk<strong>in</strong>g across the Arctic Ocean toward Siberia.<br />
By 2018 it is expected to pass with<strong>in</strong> 250 miles of the geographic<br />
North Pole.<br />
A wander<strong>in</strong>g magnetic pole corresponds to a chang<strong>in</strong>g magnetic<br />
decl<strong>in</strong>ation for any particular location. The change of the magnetic<br />
decl<strong>in</strong>ation was first recognized nearly four centuries ago when<br />
discrepancies were noticed <strong>in</strong> compass read<strong>in</strong>gs over time at the<br />
same location. For Salt Lake City, decl<strong>in</strong>ation is currently decreas<strong>in</strong>g<br />
at a rate of about 7 m<strong>in</strong>utes of a degree per year. Besides updat<strong>in</strong>g<br />
decl<strong>in</strong>ation maps, magnetic field changes br<strong>in</strong>g about such<br />
actions as the occasional renumber<strong>in</strong>g and repa<strong>in</strong>t<strong>in</strong>g of airport<br />
runways, which are characteristically named based on magnetic<br />
head<strong>in</strong>g.<br />
Know<strong>in</strong>g the current magnetic decl<strong>in</strong>ation of your position allows<br />
you to determ<strong>in</strong>e compass bear<strong>in</strong>gs from a map that match what<br />
the actual bear<strong>in</strong>gs are <strong>in</strong> the real world. This is critical for crosscountry<br />
navigation from po<strong>in</strong>t A to po<strong>in</strong>t B. Decl<strong>in</strong>ation is <strong>in</strong>cluded<br />
<strong>in</strong> the explanatory <strong>in</strong>formation of U.S. <strong>Geologic</strong>al <strong>Survey</strong> (USGS)<br />
topographic quadrangle maps and maps <strong>in</strong>tended for navigational<br />
or wilderness use. On USGS maps, the decl<strong>in</strong>ation diagram shows<br />
geographic north as a vertical l<strong>in</strong>e with a five-po<strong>in</strong>ted star (H) at<br />
the top. The direction of magnetic north is <strong>in</strong>dicated by a l<strong>in</strong>e at an<br />
angle to the right (here <strong>in</strong> <strong>Utah</strong>) with an arrowhead and is marked<br />
“MN.” The diagram <strong>in</strong>cludes the size of the angle between geographic<br />
north and magnetic north <strong>in</strong> degrees, or mils, or typically<br />
both. Unrelated to decl<strong>in</strong>ation, USGS maps also <strong>in</strong>clude a third<br />
l<strong>in</strong>e (yes, a third north!) on the diagram marked “GN” or grid north,<br />
GN<br />
0°32'<br />
9 MILS<br />
1963<br />
MN<br />
16.5°<br />
293 MILS<br />
0°32'<br />
9 MILS<br />
GN<br />
1998<br />
MN<br />
14°<br />
249 MILS<br />
Magnetic decl<strong>in</strong>ation for the Sugar House quadrangle (Salt Lake City<br />
area) <strong>in</strong> 1963 and 1998, show<strong>in</strong>g a 2.5-degree decrease <strong>in</strong> magnetic decl<strong>in</strong>ation<br />
over this time period. S<strong>in</strong>ce 1998, it has decreased an additional<br />
1.5 degrees.<br />
which refers to the Universal Transverse Mercator (UTM) grid. For<br />
more <strong>in</strong>formation on the UTM grid see USGS Fact Sheet 077-01 at<br />
http://erg.usgs.<strong>gov</strong>/isb/pubs/factsheets/fs07701.html.<br />
The present magnetic decl<strong>in</strong>ation can be computed for any location<br />
by us<strong>in</strong>g an onl<strong>in</strong>e tool of the National Geophysical Data<br />
Center, a division of the National Oceanic and Atmospheric Adm<strong>in</strong>istration<br />
(NOAA), at http://www.ngdc.noaa.<strong>gov</strong>/seg/geomag/jsp/<br />
Decl<strong>in</strong>ation.jsp. Enter latitude and longitude, or zip code, and the<br />
current magnetic decl<strong>in</strong>ation for any location, as well as the rate of<br />
change, is calculated.<br />
Historical reconstruction of the location of the North Magnetic Pole s<strong>in</strong>ce the year 1831 and projected through the year 2010 (pole locations from<br />
NOAA’s National Geophysical Data Center, December 2005).<br />
JANUARY 2008 9
ENERGY NEWS<br />
SEP and Energy Codes Tra<strong>in</strong><strong>in</strong>g—<br />
Sav<strong>in</strong>g Energy for the Long Term<br />
by Philip Powlick<br />
10 SURVEY NOTES<br />
Do you know what’s <strong>in</strong>side the walls of your home? How<br />
much <strong>in</strong>sulation is <strong>in</strong> your attic? How efficient your furnace<br />
is? Most people have no idea how energy efficient their<br />
home is, even if it is new. Yet the energy we use for heat<strong>in</strong>g<br />
and cool<strong>in</strong>g our homes accounts for a significant part of<br />
our overall energy use. Accord<strong>in</strong>g to U.S. Department of<br />
Energy household consumption data, 57 percent of all<br />
the energy consumed by households <strong>in</strong> <strong>Utah</strong>’s<br />
climate zone is used for space heat<strong>in</strong>g—<br />
energy worth nearly $1,000 annually per<br />
household—and another 4 percent of<br />
all energy is used for cool<strong>in</strong>g. Many<br />
states, <strong>in</strong>clud<strong>in</strong>g <strong>Utah</strong>, try to achieve<br />
a basel<strong>in</strong>e level of energy efficiency<br />
<strong>in</strong> build<strong>in</strong>gs through the use of<br />
energy codes.<br />
Energy codes are a rather obscure<br />
topic, but they have a major impact<br />
on the economy of both <strong>in</strong>dividual<br />
households and the nation as a whole.<br />
Energy consumed <strong>in</strong> build<strong>in</strong>gs represents<br />
about one-third of all energy used <strong>in</strong> the<br />
United States. Energy codes are similar to fire<br />
and safety codes—they set standards that contractors<br />
must meet to ensure at least a m<strong>in</strong>imal level of energy efficiency<br />
<strong>in</strong> a build<strong>in</strong>g. Energy codes typically focus on systems<br />
that will affect the energy use of a build<strong>in</strong>g for years—if not<br />
decades—to come. For <strong>in</strong>stance, a build<strong>in</strong>g’s envelope (the<br />
comb<strong>in</strong>ation of exterior and <strong>in</strong>terior walls and the spaces<br />
between them) will rarely, if ever, be modified after it is built.<br />
If the envelope is poorly sealed or under<strong>in</strong>sulated and air<br />
handl<strong>in</strong>g systems are <strong>in</strong>stalled poorly, energy is wasted for<br />
years. Over the life of even a small house, thousands of dollars<br />
can be lost.<br />
Energy codes cover commercial build<strong>in</strong>gs as well. Have<br />
you ever stopped to th<strong>in</strong>k that the lights above your desk<br />
may really be small space heaters—most <strong>in</strong>candescent lights<br />
are—and how that affects the cool<strong>in</strong>g load on the build<strong>in</strong>g?<br />
Did you know that revolv<strong>in</strong>g doors are often <strong>in</strong>stalled <strong>in</strong><br />
large build<strong>in</strong>gs to comply with energy code requirements?<br />
Energy codes for commercial build<strong>in</strong>gs cover a wide variety<br />
of topics <strong>in</strong>clud<strong>in</strong>g light<strong>in</strong>g density (watts per square foot),<br />
envelope requirements, air handl<strong>in</strong>g (heat<strong>in</strong>g, cool<strong>in</strong>g, ductwork,<br />
motors, etc.), doors, and w<strong>in</strong>dows.<br />
Energy code standards <strong>in</strong> the United States are established<br />
by the International Codes Council (ICC). Us<strong>in</strong>g a stakeholder<br />
<strong>in</strong>put process, the ICC revises the International Energy<br />
Conservation Code (IECC) every 2–3 years. The IECC<br />
is <strong>in</strong>tended to be a relatively easy to understand set of rules<br />
for designers and contractors to follow when they construct<br />
new or expand exist<strong>in</strong>g build<strong>in</strong>gs. The latest version, IECC<br />
2006, became effective on January 1, 2007. An alternative,<br />
more complex and technical set of standards (ASHRAE<br />
90.1) is established by the American Society of Heat<strong>in</strong>g,<br />
Refrigerat<strong>in</strong>g, and Air-Condition<strong>in</strong>g Eng<strong>in</strong>eers. The two<br />
standards are complimentary and the IECC makes provision<br />
for alternative compliance us<strong>in</strong>g ASHRAE methods.<br />
States vary widely <strong>in</strong> the str<strong>in</strong>gency and enforcement of<br />
energy codes. Some (e.g., Wyom<strong>in</strong>g, Tennessee) set no<br />
statewide standards and leave adoption and enforcement of<br />
codes to local <strong>gov</strong>ernments. Others (e.g., California)<br />
have state-specific standards that are even more<br />
str<strong>in</strong>gent than the 2006 IECC. <strong>Utah</strong>’s law is<br />
among the most progressive <strong>in</strong> the nation<br />
<strong>in</strong> mandat<strong>in</strong>g use of the latest version<br />
of the IECC statewide. Though local<br />
amendments are allowed, they may<br />
only make the energy-sav<strong>in</strong>g components<br />
of the code more, not less,<br />
rigorous. However, enforcement<br />
of codes is left to local <strong>gov</strong>ernments<br />
and it is here that <strong>Utah</strong> has historically<br />
seen mixed performance. Local<br />
build<strong>in</strong>g code officials also enforce other<br />
build<strong>in</strong>g codes (e.g., plumb<strong>in</strong>g and electrical<br />
standards) for health and safety. Some<br />
<strong>in</strong>spectors follow a hierarchy where health and<br />
safety come first and energy efficiency is not a major<br />
enforcement priority. Because of periodic code revisions,<br />
it is also difficult for <strong>in</strong>spectors to keep abreast of the latest<br />
energy code requirements. Because some localities do not<br />
strictly enforce the latest IECC, some builders have been lax<br />
<strong>in</strong> voluntarily comply<strong>in</strong>g with the energy code. As a result,<br />
code compliance has historically been spotty across the state.<br />
This represents a lost opportunity for the state’s economy<br />
and environment.<br />
In autumn of 2006, several factors merged to create a<br />
chance to improve <strong>Utah</strong>’s energy code compliance and<br />
save the state millions of dollars <strong>in</strong> energy costs. Both of<br />
<strong>Utah</strong>’s major utilities (Rocky Mounta<strong>in</strong> Power and Questar<br />
Gas) began to design demand-side management programs<br />
aimed at reduc<strong>in</strong>g energy use <strong>in</strong> homes. At the same time,<br />
the UGS’ State Energy Program (SEP) staff, realiz<strong>in</strong>g that<br />
the new IECC 2006 was soon to become effective, saw an<br />
opportunity. SEP approached both utilities and suggested<br />
a jo<strong>in</strong>t program of energy codes tra<strong>in</strong><strong>in</strong>g for 2007. The<br />
program would highlight changes <strong>in</strong> the newly adopted code<br />
and would be designed for contractors, eng<strong>in</strong>eers, architects,<br />
and local code officials. SEP would manage the program,<br />
and the utilities (with the approval of <strong>Utah</strong>’s Public Service<br />
Commission) would provide the fund<strong>in</strong>g ($90,000) to hire a<br />
nationally known codes expert to conduct tra<strong>in</strong><strong>in</strong>g sessions<br />
around the state.<br />
(cont<strong>in</strong>ued on page 13)
The Dome/ Diapir/ Dome<br />
Mounta<strong>in</strong> Dilemma<br />
by Sandy Eldredge<br />
An average of 270 <strong>in</strong>quiries about dome mounta<strong>in</strong>s<br />
reach our Web site every month. <strong>Utah</strong> teachers who<br />
address landforms often identify mounta<strong>in</strong> types<br />
formed by different processes. Up until the 1990s,<br />
some curricula materials listed four types of mounta<strong>in</strong>s<br />
(although there are more): fold, fault, volcanic,<br />
and dome. Teachers often def<strong>in</strong>ed a dome mounta<strong>in</strong><br />
as form<strong>in</strong>g from ris<strong>in</strong>g magma that pushed the<br />
overly<strong>in</strong>g rock layers upward to form a dome shape,<br />
without the magma break<strong>in</strong>g through the surface.<br />
However, geologists have a broader dome-mounta<strong>in</strong><br />
def<strong>in</strong>ition that <strong>in</strong>cludes any region of flat-ly<strong>in</strong>g sedimentary<br />
rocks warped upward to form a roughly circular<br />
shape, as well as accumulations of lava that pile<br />
up over a volcanic vent. Add<strong>in</strong>g to the confusion is<br />
that many mounta<strong>in</strong>s that do not fit the formal def<strong>in</strong>ition<br />
above are called dome mounta<strong>in</strong>s just because<br />
of their rounded shapes. These mounta<strong>in</strong>s should be<br />
referred to as just “dome-shaped” mounta<strong>in</strong>s.<br />
To help unravel some of the ambiguities, let’s take<br />
a look at several dome features and how they are<br />
formed.<br />
What is a dome?<br />
A dome is a circular or elliptical uplifted geologic feature<br />
on which the rock layers slope gently downward<br />
<strong>in</strong> all directions from a central high po<strong>in</strong>t. Generally<br />
the term is used for any dome-shaped landform.<br />
What are some of the dome structures?<br />
Lava domes, salt domes, salt diapirs, dome mounta<strong>in</strong>s,<br />
and laccoliths are several of many dome<br />
features.<br />
Southeastern <strong>Utah</strong>’s laccoliths are the La Sal, Henry,<br />
Abajo, and Navajo Mounta<strong>in</strong>s that rise above the<br />
flat sedimentary rock expanses. The La Sals, Henrys,<br />
and Abajos have aggregations of peaks composed<br />
of the igneous rock now exposed after the overly<strong>in</strong>g<br />
sedimentary rock layers were eroded off. Navajo<br />
Mounta<strong>in</strong>, a solitary dome mounta<strong>in</strong>, is different <strong>in</strong><br />
that the sedimentary rocks still cover the probable<br />
underly<strong>in</strong>g igneous <strong>in</strong>trusion.<br />
Teacher’s Corner<br />
Elden Mounta<strong>in</strong> is a lava dome <strong>in</strong> the San Francisco<br />
volcanic field <strong>in</strong> Arizona. Photo courtesy of<br />
U.S. <strong>Geologic</strong>al <strong>Survey</strong>.<br />
SALT DOME<br />
Salt domes are formed<br />
by upward-flow<strong>in</strong>g salt<br />
that warps the overly<strong>in</strong>g<br />
rock layers. Salt domes<br />
are common along the<br />
Gulf Coast where salt<br />
beds are covered by a<br />
thick sequence of sedimentary<br />
rocks.<br />
IGNEOUS<br />
INTRUSION<br />
SALT LAYER<br />
The salt core breaks through the overly<strong>in</strong>g<br />
rocks, and possibly the surface, creat<strong>in</strong>g a<br />
salt diapir.<br />
DOME MOUNTAIN<br />
Dome mounta<strong>in</strong>s form <strong>in</strong><br />
areas of flat-ly<strong>in</strong>g sedimentary<br />
rocks that are warped up<br />
to create a roughly circular<br />
shape. A <strong>Utah</strong> example is<br />
Navajo Mounta<strong>in</strong>, which most<br />
likely has a core of igneous<br />
rock that arched up the overly<strong>in</strong>g<br />
sedimentary rock layers.<br />
Example of a laccolithic <strong>in</strong>trusion arch<strong>in</strong>g overly<strong>in</strong>g<br />
sedimentary rock layers that still cover the igneous<br />
rock (similar to Navajo Mounta<strong>in</strong>).<br />
LAVA DOME<br />
Lava (volcanic) domes<br />
are rounded, steepsided<br />
mounds built by<br />
the accumulation of<br />
viscous lava that typically<br />
does not move<br />
far from the volcanic<br />
vent before cool<strong>in</strong>g<br />
and crystalliz<strong>in</strong>g.<br />
The weight of the overly<strong>in</strong>g<br />
rock layers forces the<br />
salt to flow upward.<br />
UPWARD<br />
FLOWING<br />
SALT<br />
SALT DIAPIRS<br />
Salt diapirs are “pierced domes,”<br />
where the overly<strong>in</strong>g uplifted<br />
rocks have been pierced or ruptured<br />
by the ris<strong>in</strong>g salt core. A<br />
<strong>Utah</strong> example is the Onion Creek<br />
salt diapir (see the “GeoSights”<br />
article <strong>in</strong> this <strong>Survey</strong> Notes issue).<br />
Diapirs can also be formed by<br />
flow<strong>in</strong>g shale or magma.<br />
Navajo Mounta<strong>in</strong> <strong>in</strong> San Juan County is a<br />
dome mounta<strong>in</strong> that was probably formed<br />
by a laccolith.<br />
LACCOLITHS<br />
Laccoliths are large bodies<br />
of igneous rock that<br />
were <strong>in</strong>jected as magma<br />
between sedimentary<br />
rock layers, arch<strong>in</strong>g the<br />
overly<strong>in</strong>g layers <strong>in</strong>to a<br />
domelike form while<br />
leav<strong>in</strong>g the rock layers<br />
below relatively flat.<br />
JANUARY 2008 11
SURVEY NEWS<br />
ENERGY<br />
Dr. Lehi H<strong>in</strong>tze and Dr. Robert B. Smith<br />
12 SURVEY NOTES<br />
Charles Bishop announced his resignation after work<strong>in</strong>g<br />
for the UGS for 21 years, most recently as a hydrogeologist<br />
with the Ground Water and Paleontology Program. Charles<br />
accepted a position with the Department of Environmental<br />
Quality. Best of luck, Charlie!<br />
Sharon Wakefield retired after 22 years with the UGS. Sharon<br />
worked <strong>in</strong> several different positions s<strong>in</strong>ce she started <strong>in</strong><br />
1986, the last be<strong>in</strong>g GIS Information Analyst for the Energy<br />
and M<strong>in</strong>erals Program. We wish Sharon well <strong>in</strong> her retirement!<br />
Dianne Davis is the new Adm<strong>in</strong>istrative Secretary, replac<strong>in</strong>g<br />
JoLynn Campbell who left <strong>in</strong> October after accept<strong>in</strong>g a<br />
Landslide susceptibility map of<br />
<strong>Utah</strong>, by Richard E. Giraud and<br />
Lucas M. Shaw, DVD (11 p., 1 pl.,<br />
1:500,000 [conta<strong>in</strong>s GIS]), ISBN<br />
1-55791-780-9, M-228 ....... $19.95<br />
The prelim<strong>in</strong>ary landslide history<br />
database of <strong>Utah</strong>, 1850–1978,<br />
by Ashley H. Elliott and Michael J.<br />
Kirschbaum, CD, OFR-514 ... $14.95<br />
Annotated bibliography of <strong>Utah</strong><br />
tar sands and related <strong>in</strong>formation,<br />
by J. Wallace Gwynn and<br />
Francis V. Hanson, CD (115 p.),<br />
OFR-503 ................................... $14.95<br />
A plan to reduce losses from geologic<br />
hazards <strong>in</strong> <strong>Utah</strong>—Recommendations<br />
of the Governor’s<br />
<strong>Geologic</strong> Hazards Work<strong>in</strong>g<br />
Group 2006–2007, compiled by<br />
Gary E. Christenson and Francis X.<br />
Ashland, 30 p., ISBN 1-55791-786-8,<br />
C-104 ........................................ $19.95<br />
2007 LEHI HINTZE AWARD<br />
The <strong>Utah</strong> <strong>Geologic</strong>al Association and UGS presented Dr. Robert B. Smith the 2007 Lehi H<strong>in</strong>tze<br />
Award for outstand<strong>in</strong>g contributions to the understand<strong>in</strong>g of <strong>Utah</strong> geology. Dr. Smith has spent<br />
over 40 years study<strong>in</strong>g the seismicity, earthquake hazards, crustal structure, and seismotectonics<br />
of western North America. He has been a remarkably productive and dist<strong>in</strong>guished earth<br />
scientist, an effective and respected educator, and has helped popularize geology and geophysics<br />
through his publications. Dr. Smith is currently professor of geophysics with the Department<br />
of Geology and Geophysics at the University of <strong>Utah</strong>.<br />
Named for the first recipient, Dr. Lehi F. H<strong>in</strong>tze of Brigham Young University, the Lehi H<strong>in</strong>tze<br />
Award was established <strong>in</strong> 2003 by the <strong>Utah</strong> <strong>Geologic</strong>al Association and the UGS to recognize<br />
outstand<strong>in</strong>g contributions to the understand<strong>in</strong>g of <strong>Utah</strong> geology.<br />
EMPLOYEE NEWS<br />
NEW PUBLICATIONS<br />
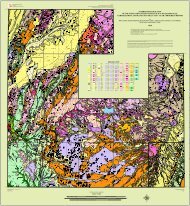
<strong>Geologic</strong> map of the Spanish Fork<br />
quadrangle, <strong>Utah</strong> County, <strong>Utah</strong>,<br />
by Barry J. Solomon, Donald L.<br />
Clark, and Michael N. Machette, 3<br />
pl., 1:24,000, ISBN 1-55791-776-0,<br />
M-227 ....................................... $13.95<br />
Recommended septic tank soilabsorption-system<br />
densities for<br />
the pr<strong>in</strong>cipal bas<strong>in</strong>-fill aquifer,<br />
Sanpete Valley, Sanpete County,<br />
<strong>Utah</strong>, by Charles E. Bishop, Janae<br />
Wallace, and Mike Lowe, CD (28 p.<br />
+ 8 p. appendix, 1 pl., 1:100,000),<br />
ISBN 1-5579-774-4,<br />
RI-259 ....................................... $14.95<br />
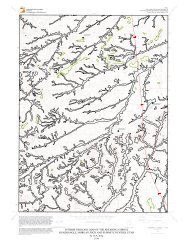
Interim geologic map of the Vernal<br />
30’ x 60’ quadrangle, U<strong>in</strong>tah and<br />
Duchesne Counties, <strong>Utah</strong>, and<br />
Moffat and Rio Blanco Counties,<br />
Colorado, by Douglas A. Spr<strong>in</strong>kel,<br />
CD (3 pl., 1:100,000 [conta<strong>in</strong>s GIS<br />
data]), OFR-506DM .............. $19.95<br />
position with the Division of Forestry, Fire and State Lands.<br />
Dianne comes to us from the Division of Fleet Services.<br />
Welcome to Will Chatw<strong>in</strong>, the new Energy Efficiency<br />
Specialist <strong>in</strong> the State Energy Program. Will comes from the<br />
University of <strong>Utah</strong> where he received his bachelor’s degree<br />
<strong>in</strong> Technology Assessment.<br />
Liz Paton, our graphic designer, has accepted a position as<br />
Art Director with a local magaz<strong>in</strong>e. Liz has been responsible<br />
for the design and layout of <strong>Survey</strong> Notes s<strong>in</strong>ce September<br />
2006. She has been a great asset to the UGS, and we<br />
will miss her creative talent. Best of luck, Liz, <strong>in</strong> your new<br />
endeavor.<br />
Interim geologic map of the Henrie<br />
Knolls quadrangle, Garfield,<br />
Iron, and Kane Counties, <strong>Utah</strong>,<br />
by Robert F. Biek, David W. Moore,<br />
and L. David Nealey, 2 pl., 1:24,000,<br />
OFR-502 .................................... $7.50<br />
Active landslides <strong>in</strong> the Creekside<br />
Drive area, Mounta<strong>in</strong> Green,<br />
Morgan County, <strong>Utah</strong>, between<br />
June 2005 and December 2006,<br />
by Francis X. Ashland, 25 p., ISBN<br />
1-55791-777-9, RI-260 .......... $9.95<br />
Interim geologic map of the Goldstrike<br />
quadrangle and east part<br />
of the Docs Pass quadrangle,<br />
Wash<strong>in</strong>gton County, <strong>Utah</strong>, by<br />
Peter D. Rowley, R. Ernest Anderson,<br />
David B. Hacker, Jonathan T.<br />
Boswell, David J. Maxwell, Dennis<br />
P. Cox, Ronald Willden, and<br />
Don H. Adair, 27 p., 1 pl., 1:24,000,<br />
OFR-510 .................................... $8.00
Progress report geologic map of part<br />
of the Seep Ridge 30’ x 60’ quadrangle,<br />
U<strong>in</strong>tah, Duchesne, and Carbon<br />
Counties, <strong>Utah</strong>, and Rio Blanco<br />
and Garfield Counties, Colorado<br />
(year 1 of 2), by Douglas A. Spr<strong>in</strong>kel,<br />
2 pl., 1:100,000, OFR-507 ........... $7.50<br />
Progress report geologic map of Dugway<br />
Prov<strong>in</strong>g Ground and adjacent<br />
areas, parts of the Wildcat Mounta<strong>in</strong>,<br />
Rush Valley, and Fish Spr<strong>in</strong>gs<br />
(Energy News cont<strong>in</strong>ued from page 10)<br />
30’ x 60’quadrangles, Tooele County,<br />
<strong>Utah</strong> (year 1 of 2), by Donald L.<br />
Clark, Charles G. Oviatt, and David<br />
Page, 3 pl., scale 1:100,000,<br />
OFR-501 ........................................... $9.95<br />
Annual review and forecast of <strong>Utah</strong><br />
coal production and distribution—2006,<br />
by Michael D. Vanden<br />
Berg, 37 p., ISBN 1-55791-783-3,<br />
C-103 .............................................. $12.95<br />
The codes tra<strong>in</strong><strong>in</strong>g program was launched <strong>in</strong> June 2007 with Eric<br />
Makela (Boise, Idaho) provid<strong>in</strong>g 42 tra<strong>in</strong><strong>in</strong>g sessions spread over 22 days<br />
to nearly 800 students. Locations have ranged widely across the state,<br />
from Brigham City to St. George and to Moab. Sessions have been<br />
offered focus<strong>in</strong>g on residential code basics, IECC 2006 updates, and<br />
commercial build<strong>in</strong>gs. Feedback from attendees suggests that there is a<br />
demand among <strong>Utah</strong>’s build<strong>in</strong>g community for more <strong>in</strong>formation, not<br />
only about energy codes, but about energy efficient build<strong>in</strong>g practices<br />
<strong>in</strong> general. As a result, SEP and our partners are already plann<strong>in</strong>g<br />
to cont<strong>in</strong>ue the codes tra<strong>in</strong><strong>in</strong>g program <strong>in</strong> 2008. Over time, we hope<br />
to transform the way build<strong>in</strong>gs <strong>in</strong> <strong>Utah</strong> are constructed, mak<strong>in</strong>g code<br />
compliance—and even build<strong>in</strong>g beyond code—standard practice. The<br />
energy efficient build<strong>in</strong>gs that we hope to see built today should help<br />
<strong>Utah</strong> homeowners and bus<strong>in</strong>esses to save energy for many years—and<br />
many dollars—to come.<br />
Jim Kirkland and Don DeBlieux unveil the reconstructed Last Chance ceratopsian<br />
skull dur<strong>in</strong>g Earth Science Week.<br />
Interim geologic map of the Thompson<br />
Po<strong>in</strong>t quadrangle, Kane County,<br />
<strong>Utah</strong>, and Cocon<strong>in</strong>o County,<br />
Arizona, by Janice M. Hayden, 2 pl.,<br />
1:24,000, OFR-511 ....................... $8.00<br />
The 2005–06 Creekside Drive area<br />
landslides, Mounta<strong>in</strong> Green, Morgan<br />
County, <strong>Utah</strong>, by Ashley Elliott,<br />
2 p., PI-91 ........................................... Free<br />
An example of energy sav<strong>in</strong>gs built <strong>in</strong>to a new home: Raised<br />
heel roof trusses that extend the top of exterior walls allow<br />
for a uniformly thick layer of <strong>in</strong>sulation. Ord<strong>in</strong>ary roof trusses<br />
that come to a po<strong>in</strong>t at the exterior wall do not allow for thick<br />
<strong>in</strong>sulation layers on the sides, result<strong>in</strong>g <strong>in</strong> energy losses over<br />
the lifetime of the house. Photo source: National Renewable<br />
Energy Laboratory.<br />
Earth Science Week Kicks Off with<br />
Ceratopsian Unveil<strong>in</strong>g<br />
Reporters from T.V. stations and newspapers were on hand the<br />
first day of Earth Science Week (ESW), celebrated October 15–<br />
17 at the UGS’s Core Research Center. Dur<strong>in</strong>g a break <strong>in</strong> ESW<br />
activities, UGS paleontologists Jim Kirkland and Don DeBlieux<br />
unveiled the reconstructed skull of the Last Chance ceratopsian,<br />
discovered by DeBlieux <strong>in</strong> 2002 near Last Chance Creek <strong>in</strong><br />
southern <strong>Utah</strong>. Some of the 4th-grade students present were<br />
even <strong>in</strong>terviewed by several reporters (see the September<br />
2007 issue of <strong>Survey</strong> Notes for a detailed illustration and more<br />
<strong>in</strong>formation about of the Last Chance ceratopsian).<br />
Dur<strong>in</strong>g this year’s ESW, 685 students participated <strong>in</strong> activities<br />
such as pann<strong>in</strong>g for “gold” and identify<strong>in</strong>g rocks and m<strong>in</strong>erals.<br />
View more ESW photos and the 2007 declaration signed by<br />
Governor Huntsman at http://geology.utah.<strong>gov</strong>/teacher/esweek.htm.<br />
JANUARY 2008 13
ANNOTATED BIBLIOGRAPHY OF UTAH TAR SANDS<br />
AND RELATED INFORMATION<br />
by J. Wallace Gwynn and Francis V. Hanson<br />
OFR 503<br />
UTAH GEOLOGICAL SURVEY<br />
a division of<br />
<strong>Utah</strong> Department of Natural Resources<br />
2007<br />
UTAH GEOLOGICAL SURVEY<br />
1594 W. North Temple, Suite 3110<br />
Box 146100<br />
Salt Lake City, UT 84114-6100<br />
Address service requested<br />
<strong>Survey</strong> Notes<br />
ANNOTATED BIBLIOGRAPHY OF UTAH TAR SANDS<br />
AND RELATED INFORMATION<br />
by J. Wallace Gwynn and Francis V. Hanson<br />
<strong>Utah</strong>’s tar sand resources are the largest <strong>in</strong> the United States.<br />
The U<strong>in</strong>ta Bas<strong>in</strong> hosts the majority of <strong>Utah</strong>’s tar sands, both<br />
<strong>in</strong> terms of the number of deposits and resources <strong>in</strong>-place<br />
(measured and estimated). Despite unsuccessful past<br />
attempts to develop this heavy-oil resource, the current<br />
period of susta<strong>in</strong>ed high oil prices is stimulat<strong>in</strong>g renewed<br />
<strong>in</strong>terest. Advances <strong>in</strong> oil extraction from tar sands <strong>in</strong> other<br />
countries make the vast <strong>Utah</strong> deposits an attractive target.<br />
This publication provides an annotated reference list of<br />
<strong>Utah</strong>’s tar sand literature and technical <strong>in</strong>formation on<br />
nearly 100 <strong>in</strong>dividual deposits, as well as extraction and<br />
upgrad<strong>in</strong>g processes. Some other references related to<br />
patents, oil shale, and other hydrocarbon resources are also<br />
<strong>in</strong>cluded. This compilation will be valuable to those <strong>in</strong>terested<br />
<strong>in</strong> the exploration for, and development of, <strong>Utah</strong>’s tar<br />
sand resources. The bibliography, consist<strong>in</strong>g of digital text<br />
files on compact disk, is searchable for specific deposits or<br />
general terms. A brief <strong>in</strong>troductory section describes the<br />
past, present, and future of <strong>Utah</strong>’s tar sand <strong>in</strong>dustry.<br />
Open-File Report 503 .............................................................. $14.95<br />
Natural Resources Map & Bookstore<br />
1594 W. North Temple • Salt Lake City, UT 84116<br />
801-537-3320 or 1-888-UTAHMAP • http://mapstore.utah.<strong>gov</strong><br />
PRSRT STD<br />
U.S. Postage<br />
PAID<br />
Salt Lake City, UT<br />
Permit No. 4728