Wetlands in northern Salt Lake Valley, Salt Lake County, Utah
Wetlands in northern Salt Lake Valley, Salt Lake County, Utah
Wetlands in northern Salt Lake Valley, Salt Lake County, Utah

You also want an ePaper? Increase the reach of your titles
YUMPU automatically turns print PDFs into web optimized ePapers that Google loves.
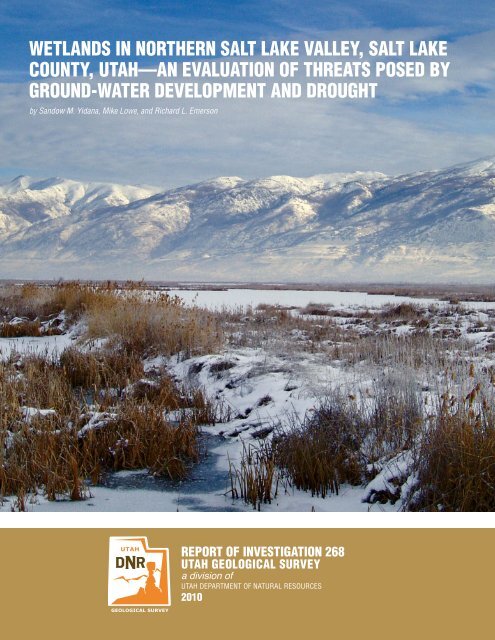
WETLANDS IN NORTHERN SALT LAKE VALLEY, SALT LAKECOUNTY, UTAH—AN EVALUATION OF THREATS POSED BYGROUND-WATER DEVELOPMENT AND DROUGHTby Sandow M. Yidana, Mike Lowe, and Richard L. EmersonREPORT OF INVESTIGATION 268UTAH GEOLOGICAL SURVEYa division ofUTAH DEPARTMENT OF NATURAL RESOURCES2010
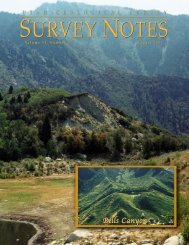
WETLANDS IN NORTHERN SALT LAKE VALLEY, SALT LAKECOUNTY, UTAH—AN EVALUATION OF THREATS POSED BYGROUND-WATER DEVELOPMENT AND DROUGHTby Sandow M. Yidana, Mike Lowe, and Richard L. EmersonCover Photo: View look<strong>in</strong>g to the northeast of southern Great <strong>Salt</strong> <strong>Lake</strong> wetlands <strong>in</strong> <strong>Salt</strong> <strong>Lake</strong> <strong>County</strong>, <strong>Utah</strong>.REPORT OF INVESTIGATION 268UTAH GEOLOGICAL SURVEYa division ofUTAH DEPARTMENT OF NATURAL RESOURCES2010
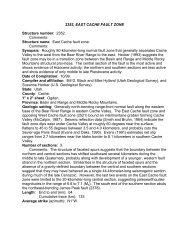
WETLANDS IN NORTHERN SALT LAKE VALLEY, SALT LAKECOUNTY, UTAH—AN EVALUATION OF THREATS POSED BYGROUND-WATER DEVELOPMENT AND DROUGHTby Sandow M. Yidana, Mike Lowe, and Richard L. EmersonABSTRACT<strong>Salt</strong> <strong>Lake</strong> <strong>Valley</strong> is a largely urban area with a grow<strong>in</strong>g population.Most of the development <strong>in</strong> <strong>Salt</strong> <strong>Lake</strong> <strong>Valley</strong> usesmunicipal water sources, pr<strong>in</strong>cipally wells completed <strong>in</strong> thebas<strong>in</strong>-fill aquifer system. The population growth and concomitant<strong>in</strong>crease <strong>in</strong> municipal ground-water pump<strong>in</strong>g couldsignificantly decrease the amount of ground water dischargedfrom the pr<strong>in</strong>cipal aquifer system (where most wells are completed)to the shallow unconf<strong>in</strong>ed aquifer system.The shallow unconf<strong>in</strong>ed aquifer overlies conf<strong>in</strong><strong>in</strong>g beds abovethe pr<strong>in</strong>cipal aquifer system <strong>in</strong> the central and <strong>northern</strong> partsof the valley, and provides water to spr<strong>in</strong>gs and approximately58,000 acres (23,500 hm 2 ) of wetlands <strong>in</strong> ground-water dischargeareas. Decreased recharge to the shallow unconf<strong>in</strong>edaquifer from the pr<strong>in</strong>cipal aquifer due to <strong>in</strong>creased groundwaterpump<strong>in</strong>g could reduce water supply to these spr<strong>in</strong>gsand wetlands. Also, water supply to the spr<strong>in</strong>gs and wetlandsis affected by climatic conditions and Great <strong>Salt</strong> <strong>Lake</strong> level.Drought conditions dur<strong>in</strong>g 1999–2004 reduced the amount ofrecharge to ground-water aquifers across the state, <strong>in</strong>clud<strong>in</strong>gthe Great <strong>Salt</strong> <strong>Lake</strong> area, negatively impact<strong>in</strong>g the <strong>Salt</strong> <strong>Lake</strong><strong>Valley</strong> wetlands. In 2005 and 2008, the elevation of Great <strong>Salt</strong><strong>Lake</strong> decl<strong>in</strong>ed to near its historic lowstand reached <strong>in</strong> 1963,allow<strong>in</strong>g some parts of the <strong>Salt</strong> <strong>Lake</strong> <strong>Valley</strong> wetlands to dewater.To evaluate the potential impacts of drought and <strong>in</strong>creased developmenton the <strong>Salt</strong> <strong>Lake</strong> <strong>Valley</strong> wetlands, we used exist<strong>in</strong>gdata to estimate a water budget and develop regional, threedimensional,steady-state and transient MODFLOW modelsto evaluate water-budget changes for the wetland areas; theseefforts focused on wetlands around the marg<strong>in</strong>s of Great <strong>Salt</strong><strong>Lake</strong>, although the results may apply to all of the wetlands<strong>in</strong> <strong>Salt</strong> <strong>Lake</strong> <strong>Valley</strong>. The model<strong>in</strong>g suggests that subsurface<strong>in</strong>flow <strong>in</strong>to the wetland areas would be most affected by decreasedsubsurface <strong>in</strong>flow due to long-term (20-year) droughtconditions, which would also cause changes <strong>in</strong> Great <strong>Salt</strong><strong>Lake</strong> levels, but subsurface <strong>in</strong>flow would also decrease due to<strong>in</strong>creased municipal and <strong>in</strong>dustrial well withdrawals over thesame time period. Therefore, the worst-case scenario for thewetlands would be a comb<strong>in</strong>ation of both conditions. If theU.S. Environmental Protection Agency’s goal on no net lossof wetlands is to be met, the <strong>Salt</strong> <strong>Lake</strong> <strong>Valley</strong> wetland areasshould be managed to ma<strong>in</strong>ta<strong>in</strong> their current budget of water(estimated at about 52,420 acre-feet per year [65 hm 3 /yr] ofrecharge).We also <strong>in</strong>stalled shallow monitor<strong>in</strong>g wells <strong>in</strong> the <strong>Salt</strong> <strong>Lake</strong><strong>Valley</strong> wetland areas to determ<strong>in</strong>e hydraulic gradient andground-water quality <strong>in</strong> the shallow unconf<strong>in</strong>ed aquifer. Themagnitude and direction of the hydraulic gradient are similarto those documented previously, where ground water <strong>in</strong> thewetland areas flows north toward Great <strong>Salt</strong> <strong>Lake</strong>. Total-dissolved-solidsconcentrations for water samples collected fromtwo shallow monitor<strong>in</strong>g wells are 6786 and 21,324 mg/L.This model-dependent study <strong>in</strong>dicates that wetlands <strong>in</strong> <strong>Salt</strong><strong>Lake</strong> <strong>Valley</strong> may be stressed <strong>in</strong> the future. Drought and <strong>in</strong>creaseddevelopment due to population growth could dramaticallyreduce the amount of water the wetlands receive. Measuresto reduce the potential for degradation of the <strong>Salt</strong> <strong>Lake</strong><strong>Valley</strong> wetlands <strong>in</strong>clude development restrictions, re-use ofwastewater upgradient of the wetlands, and implementationof water conservation practices.INTRODUCTIONBackground<strong>Salt</strong> <strong>Lake</strong> <strong>Valley</strong> (figures 1 and 2), <strong>in</strong> <strong>Salt</strong> <strong>Lake</strong> <strong>County</strong>, <strong>Utah</strong>,is a largely urban area along the southern marg<strong>in</strong> of Great <strong>Salt</strong><strong>Lake</strong> that cont<strong>in</strong>ues to undergo population growth. Most ofthe development <strong>in</strong> <strong>Salt</strong> <strong>Lake</strong> <strong>Valley</strong> uses municipal watersources, pr<strong>in</strong>cipally wells completed <strong>in</strong> the bas<strong>in</strong>-fill aquifersystem. The population growth and concomitant <strong>in</strong>crease <strong>in</strong>ground-water usage for municipal supply (figure 3) could significantlydecrease the amount of ground water dischargedfrom the pr<strong>in</strong>cipal aquifer system (where most wells are completed)to the shallow unconf<strong>in</strong>ed aquifer system. The shallowunconf<strong>in</strong>ed aquifer overlies conf<strong>in</strong><strong>in</strong>g beds above the pr<strong>in</strong>cipalaquifer system <strong>in</strong> the central and <strong>northern</strong> parts of the valley,and provides water to spr<strong>in</strong>gs and approximately 58,000acres (23,500 hm 2 ) of wetlands <strong>in</strong> ground-water dischargeareas, which accounts for 98% of <strong>Salt</strong> <strong>Lake</strong> <strong>County</strong> wetlands.<strong>Salt</strong> <strong>Lake</strong> <strong>Valley</strong> has been closed to new water rights appropriationss<strong>in</strong>ce 2002, and between 1991 and 2002 only fixedtimewater appropriations were available to residents withspecial circumstances (<strong>Utah</strong> Division of Water Rights, 2008a,
4<strong>Utah</strong> Geological SurveyFigure 3. Annual water usages by category for <strong>Salt</strong> <strong>Lake</strong> <strong>Valley</strong> (based on data from <strong>Utah</strong> Division of Water Rights).Purpose and ScopeThe purpose of this study is to use exist<strong>in</strong>g data to estimate awater budget for the wetland areas, and to use exist<strong>in</strong>g steadystateand transient ground-water flow models developed by theU.S. Geological Survey (USGS) (Lambert, 1995a) to simulatethe hydrologic effects on wetlands from various recharge ratesand projected ground-water withdrawals at various projectedGreat <strong>Salt</strong> <strong>Lake</strong> levels; the estimated water budget and modelsimulations focus on wetlands around the marg<strong>in</strong>s of Great<strong>Salt</strong> <strong>Lake</strong>, although the study results may apply to all of thewetlands <strong>in</strong> <strong>Salt</strong> <strong>Lake</strong> <strong>Valley</strong>. These simulations can be usedto assess potential threats to wetlands from <strong>in</strong>creased groundwaterwithdrawals and drought, and provide a basis for (1)implement<strong>in</strong>g restrictions on domestic withdrawals, (2) assess<strong>in</strong>gwater needs for wetland preservation, and (3) encourag<strong>in</strong>gthe development of water conservation programs.Our study comb<strong>in</strong>es empirical and model<strong>in</strong>g analyses to understandthe effects of changes <strong>in</strong> land use and climate. Weused an estimated water budget to compare and <strong>in</strong>terpretnumerical ground-water flow models, which simulate fluxes<strong>in</strong>to and out of the <strong>Salt</strong> <strong>Lake</strong> <strong>Valley</strong> wetland areas. Numericalground-water flow models have been used to understandthe <strong>in</strong>teraction between wetlands and ground water <strong>in</strong> otherstudies (Burk and others, 2005; Bishop and others, 2009). Theaccuracy of the solutions obta<strong>in</strong>ed by numerical methods isgenerally sufficient; however, the accuracy depends on severalfactors, <strong>in</strong>clud<strong>in</strong>g our understand<strong>in</strong>g of the complexityof the system, boundary and <strong>in</strong>itial conditions, and numericalmethods used.A second objective is to document the hydraulic gradient andcurrent quality of ground water <strong>in</strong> the wetland areas near Great<strong>Salt</strong> <strong>Lake</strong>. We used water levels <strong>in</strong> shallow wells to documentthe hydraulic gradient <strong>in</strong> the shallow unconf<strong>in</strong>ed aquifer, anddata from water samples from two of the wells to provide <strong>in</strong>sight<strong>in</strong>to the current quality of ground water flow<strong>in</strong>g <strong>in</strong>to thewetland areas. Data from two wells are not sufficient to accuratelycharacterize the quality of ground water enter<strong>in</strong>g thewetland areas, but <strong>in</strong>formation from these two wells <strong>in</strong> additionto data from previous work provide a sense of the qualityof ground water recharg<strong>in</strong>g the wetland areas.This report provides the necessary <strong>in</strong>tegration of geologicand hydrologic wetland studies to more fully understand thehydrologic system of the <strong>Salt</strong> <strong>Lake</strong> <strong>Valley</strong> wetlands area <strong>in</strong>relation to wetland functionality, with emphasis on the wetlandsnear Great <strong>Salt</strong> <strong>Lake</strong>. The scope of this study <strong>in</strong>cludes athorough literature search; a compilation of published and unpublishedgeologic, hydrologic, and wetland <strong>in</strong>formation; andfield sampl<strong>in</strong>g and analysis of water data from shallow wells.Detailed USGS ground-water models, which are described<strong>in</strong> this report, were used by the USGS and other agencies toidentify historical changes <strong>in</strong> the ground-water flow system <strong>in</strong><strong>Salt</strong> <strong>Lake</strong> <strong>Valley</strong>.
<strong>Wetlands</strong> <strong>in</strong> Northern <strong>Salt</strong> <strong>Lake</strong> <strong>Valley</strong>, <strong>Salt</strong> <strong>Lake</strong> <strong>County</strong>, <strong>Utah</strong>—an evaluation of the threats posed by ground-water developement and drought 5MethodsWe <strong>in</strong>stalled 12 shallow monitor<strong>in</strong>g wells <strong>in</strong> three wetlandareas near Great <strong>Salt</strong> <strong>Lake</strong> (figure 1 and appendix C). Twowells were sampled for water quality, and ground-water depthwas measured <strong>in</strong> n<strong>in</strong>e of the wells (three wells did not yieldwater). The wells were manually <strong>in</strong>stalled us<strong>in</strong>g a hand augerto bore a hole <strong>in</strong>to the ground to a depth of 3 to 7 feet (1–2 m),and then <strong>in</strong>sert<strong>in</strong>g one-<strong>in</strong>ch-diameter slotted PVC and backfill<strong>in</strong>gthe void between the borehole and PVC with the handaugercutt<strong>in</strong>gs. We mapped the well locations us<strong>in</strong>g a TrimbleTotal Station GPS system hav<strong>in</strong>g sub-centimeter vertical andhorizontal accuracy. Water levels <strong>in</strong> the wells were measuredmanually dur<strong>in</strong>g the spr<strong>in</strong>g and summer of 2008. The two water-qualitymonitor<strong>in</strong>g wells were sampled <strong>in</strong> May 2008, andthe samples were analyzed at the <strong>Utah</strong> Division of Epidemiologyand Laboratory Services for general chemistry, dissolvedmetals, nutrients, and total organic carbon. Computer model<strong>in</strong>gwas conducted dur<strong>in</strong>g 2007 and 2008.Previous StudiesRichardson (1906) conducted the first <strong>in</strong>vestigation of groundwaterconditions <strong>in</strong> <strong>Salt</strong> <strong>Lake</strong> <strong>Valley</strong> (previously known asJordan <strong>Valley</strong>); that study, which <strong>in</strong>cluded <strong>Utah</strong> <strong>Valley</strong>, producedmaps show<strong>in</strong>g depth to ground water and areas offlow<strong>in</strong>g wells. Taylor and Leggette (1949) conducted a morethorough <strong>in</strong>vestigation that <strong>in</strong>cluded many well records, anddiscussions of ground-water occurrence, recharge and discharge,and chemical quality. Lofgren (1952) discussed thestatus of ground-water development <strong>in</strong> <strong>Salt</strong> <strong>Lake</strong> <strong>Valley</strong> as of1951. Marsell (1964) discussed water-supply issues as part ofa comprehensive review of the geology of <strong>Salt</strong> <strong>Lake</strong> <strong>County</strong>.Mar<strong>in</strong>e and Price (1964) updated previous studies and subdividedthe valley <strong>in</strong>to ground-water districts for water-resourcemanagement purposes. Hely and others (1967, 1968, 1969)compiled hydrologic and climatalogic data that were used toproduce a summary of ground-water hydrology <strong>in</strong> <strong>Salt</strong> <strong>Lake</strong><strong>Valley</strong> (Mower, 1969a) and water resources <strong>in</strong> <strong>Salt</strong> <strong>Lake</strong><strong>County</strong> (Hely and others, 1971). Arnow and Mattick (1968)evaluated the thickness of bas<strong>in</strong>-fill deposits. Mower (1968)discussed ground-water discharge toward Great <strong>Salt</strong> <strong>Lake</strong> <strong>in</strong>bas<strong>in</strong>-fill deposits. Mower (1969b) discussed ground-water<strong>in</strong>flow through channel fill <strong>in</strong> seven Wasatch Range canyons<strong>in</strong> <strong>Salt</strong> <strong>Lake</strong> <strong>County</strong>. Arnow and others (1970) used waterwelllogs to del<strong>in</strong>eate the pre-Quaternary surface <strong>in</strong> <strong>Salt</strong> <strong>Lake</strong><strong>Valley</strong> to be used as a general guide for water-well drill<strong>in</strong>g.Mower (1970) discussed ground-water recharge to <strong>Salt</strong> <strong>Lake</strong><strong>Valley</strong> from <strong>Utah</strong> <strong>Valley</strong>. Seiler and Waddell (1984) conductedan assessment of the shallow unconf<strong>in</strong>ed aquifer <strong>in</strong> <strong>Salt</strong><strong>Lake</strong> <strong>Valley</strong>. Herbert and others (1985) conducted a seepagestudy of six canals <strong>in</strong> <strong>Salt</strong> <strong>Lake</strong> <strong>County</strong>. Waddell and others(1987b) evaluated the chemical quality of ground water <strong>in</strong>the bas<strong>in</strong>-fill aquifer for the 1969–85 time period. Waddelland others (1987a) evaluated ground-water conditions <strong>in</strong> <strong>Salt</strong><strong>Lake</strong> <strong>Valley</strong> with emphasis on predicted effects of <strong>in</strong>creasedwithdrawals from wells. Thiros (1992) compiled selected hydrologicdata for <strong>Salt</strong> <strong>Lake</strong> <strong>Valley</strong> with emphasis on data fromthe shallow unconf<strong>in</strong>ed aquifer and conf<strong>in</strong><strong>in</strong>g layers. Andersonand others (1994; see also Anderson and Susong, 1995)mapped ground-water recharge and discharge areas for thepr<strong>in</strong>cipal aquifers along the Wasatch Front, <strong>in</strong>clud<strong>in</strong>g the pr<strong>in</strong>cipalaquifer <strong>in</strong> <strong>Salt</strong> <strong>Lake</strong> <strong>Valley</strong>. Thiros (1995) <strong>in</strong>vestigatedthe chemical composition and movement of ground water, andthe hydrologic properties of bas<strong>in</strong>-fill material, to better understandthe flow system <strong>in</strong> <strong>Salt</strong> <strong>Lake</strong> <strong>Valley</strong>. Lambert (1995a)produced a three-dimensional, f<strong>in</strong>ite-difference, numericalground-water flow model for the bas<strong>in</strong>-fill aquifer, which he(Lambert, 1995b) subsequently used to produce capture zonesfor selected public supply wells and simulate (Lambert, 1996)the movement of sulfate <strong>in</strong> ground water. Waddell and others(2004) assessed water quality <strong>in</strong> the Great <strong>Salt</strong> <strong>Lake</strong> bas<strong>in</strong>s, <strong>in</strong>clud<strong>in</strong>g<strong>Salt</strong> <strong>Lake</strong> <strong>Valley</strong>. Burden and others (2005) describedchanges <strong>in</strong> ground-water conditions <strong>in</strong> <strong>Utah</strong>, <strong>in</strong>clud<strong>in</strong>g <strong>Salt</strong><strong>Lake</strong> <strong>Valley</strong>, from 1975 to 2005. Lowe and others (2005) andLowe and Wallace (2006) mapped ground-water sensitivityand vulnerability to pesticides for the <strong>Salt</strong> <strong>Lake</strong> <strong>Valley</strong> bas<strong>in</strong>fillaquifer. Wallace and Lowe (2009) mapped ground-waterquality classes for the <strong>Salt</strong> <strong>Lake</strong> <strong>Valley</strong> bas<strong>in</strong>-fill aquifer.SETTINGPhysiography<strong>Salt</strong> <strong>Lake</strong> <strong>Valley</strong> is a north-south-trend<strong>in</strong>g valley located <strong>in</strong>north-central <strong>Utah</strong> southeast of Great <strong>Salt</strong> <strong>Lake</strong>. <strong>Salt</strong> <strong>Lake</strong><strong>Valley</strong> is <strong>in</strong> the <strong>Salt</strong> <strong>Lake</strong> <strong>Valley</strong> segment of the Wasatch Front<strong>Valley</strong>s section of the Great Bas<strong>in</strong> physiographic prov<strong>in</strong>ce(Stokes, 1977). The valley is bounded on the east and northeastby the central portion of the Wasatch Range, on the northwestby Great <strong>Salt</strong> <strong>Lake</strong>, on the west by the Oquirrh Mounta<strong>in</strong>s,and on the south by the Traverse Mounta<strong>in</strong>s. Elevationsrange from about 4200 feet (1280 m) <strong>in</strong> the lowest part of thevalley near Great <strong>Salt</strong> <strong>Lake</strong> to more than 7000 feet (2130 m)<strong>in</strong> the Traverse Mounta<strong>in</strong>s, 9000 feet (2740 m) <strong>in</strong> the OquirrhMounta<strong>in</strong>s, and 11,000 feet (3350 m) <strong>in</strong> the Wasatch Range.<strong>Salt</strong> <strong>Lake</strong> <strong>Valley</strong> has also been referred to as Jordan <strong>Valley</strong> becauseof the Jordan River, which flows northward <strong>in</strong>to the valleythrough the Jordan Narrows, a water gap <strong>in</strong> the TraverseMounta<strong>in</strong>s, and ultimately <strong>in</strong>to Great <strong>Salt</strong> <strong>Lake</strong>. Six othermajor streams flow <strong>in</strong>to the valley from the Wasatch Rangeto the east and <strong>in</strong>to the Jordan River; these streams are ma<strong>in</strong>lyfed by snowmelt dur<strong>in</strong>g the spr<strong>in</strong>g and early summer. M<strong>in</strong>oramounts of water enter the valley from the Oquirrh Mounta<strong>in</strong>s.The mounta<strong>in</strong>s that surround <strong>Salt</strong> <strong>Lake</strong> <strong>Valley</strong> are composedof rocks that range <strong>in</strong> age from Precambrian to Tertiary. TheWasatch Range consists of Precambrian, Paleozoic, Mesozoic,and Cenozoic sedimentary and metasedimentary rocks thathave been <strong>in</strong>truded by Tertiary granitic and dioritic stocks.
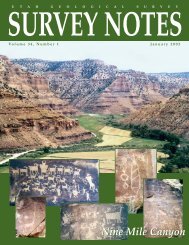
6The Oquirrh Mounta<strong>in</strong>s consist of Paleozoic sedimentaryrocks, predom<strong>in</strong>antly the Oquirrh Formation, and <strong>in</strong>trusiveand extrusive Cenozoic rocks. The Traverse Mounta<strong>in</strong>s arecomposed of Paleozoic sedimentary rocks and Cenozoic volcanics.<strong>Salt</strong> <strong>Lake</strong> <strong>Valley</strong> occupies a graben that is bounded by faultson its east, west, and south sides. Sediments have been fill<strong>in</strong>gthis graben s<strong>in</strong>ce Tertiary time. The Tertiary and Quaternarybas<strong>in</strong> fill is up to 4000 feet (1220 m) thick <strong>in</strong> some areas ofthe valley (Mattick, 1970), and consists of unconsolidated tosemiconsolidated clay, silt, sand, gravel, and tuff. Quaternarysediments <strong>in</strong> the upper part of the bas<strong>in</strong> fill range from 0 to2000 feet (0–610 m) thick (Arnow and others, 1970). Thedepositional sequence <strong>in</strong> the bas<strong>in</strong> fill is complex (Mar<strong>in</strong>e andPrice, 1964) due to alternat<strong>in</strong>g periods of lacustr<strong>in</strong>e and <strong>in</strong>terlacustr<strong>in</strong>econditions dur<strong>in</strong>g the late Tertiary and Quaternary.Dur<strong>in</strong>g the lacustr<strong>in</strong>e periods, or deep-lake cycles (figure 4),much of <strong>Salt</strong> <strong>Lake</strong> <strong>Valley</strong> was covered with water and offshoresilt and clay were deposited <strong>in</strong> the central parts of thevalley while deltaic (at the mouths of canyons) and nearshoresand and gravel were deposited along valley marg<strong>in</strong>s. Dur<strong>in</strong>g<strong>in</strong>terlacustr<strong>in</strong>e periods, sediments were deposited primarilyas alluvial fans at canyon mouths and as fluvial-channel andfloodpla<strong>in</strong> sediments <strong>in</strong> the central parts of the valley. As ageneral rule, coarser gra<strong>in</strong>ed sediments exist near valley marg<strong>in</strong>sand f<strong>in</strong>er gra<strong>in</strong>ed sediments exist <strong>in</strong> the middle and northend of the valley.ClimateThe climate <strong>in</strong> <strong>Salt</strong> <strong>Lake</strong> <strong>Valley</strong> can be described as semiaridwith hot summers and moderately cold w<strong>in</strong>ters. Due to thelocal topography and the great relief between the mounta<strong>in</strong>sand valley, the weather can be quite variable and is very much<strong>Utah</strong> Geological Surveyrelated to orographic effects and local weather patterns (Murphy,1981). The mounta<strong>in</strong>s surround<strong>in</strong>g the valley typicallyreceive substantially more precipitation and have cooler temperaturesthan the valley, and the southeast part of <strong>Salt</strong> <strong>Lake</strong><strong>County</strong> receives the most precipitation.In <strong>Salt</strong> <strong>Lake</strong> <strong>County</strong>, 24 weather stations are or have beenoperated by the <strong>Utah</strong> Climate Center, and Moller and Gillies(2008) provide <strong>in</strong>formation for n<strong>in</strong>e of these stations. Basedon data collected from those weather stations, <strong>Salt</strong> <strong>Lake</strong> <strong>Valley</strong>receives between 13.74 and 25.79 <strong>in</strong>ches (34.9 and 65.5 cm)of precipitation annually, at the Draper Po<strong>in</strong>t of the Mounta<strong>in</strong>and Cottonwood Weir stations, respectively. The mounta<strong>in</strong>sreceive much more precipitation; the Alta station (elevation8730 feet [2661 m]) receives 58.28 <strong>in</strong>ches (148.03 cm) of precipitationannually.Temperatures <strong>in</strong> <strong>Salt</strong> <strong>Lake</strong> <strong>County</strong> are also quite variable, andlike precipitation, are related to elevation; the mounta<strong>in</strong>s are10 to 15˚F (5 to 8˚C) cooler than the valley. To illustrate theseextremes, the <strong>Salt</strong> <strong>Lake</strong> City International Airport station hasan elevation of 4225 feet (1288 m) and a normal maximumtemperature, normal m<strong>in</strong>imum temperature, normal meantemperature, and record high temperature of 64.0, 41.2, 52.6,and 107.0˚F (17.8, 5.1, 11.4, and 41.7˚C), respectively. Incontrast, the Alta station has an elevation of 8730 feet (2661m) and a normal maximum temperature, normal m<strong>in</strong>imumtemperature, normal mean temperature, and record high temperatureof 47.8, 28.7, 38.2, and 94.0˚F (8.8, -1.8, 3.4, and34.4˚C), respectively (Moller and Gillies, 2008).Evapotranspiration is dependent upon solar radiation, temperature,w<strong>in</strong>d, and humidity, but does not directly correlatewith elevation like temperature and precipitation, at least <strong>in</strong><strong>Salt</strong> <strong>Lake</strong> <strong>County</strong>. The Draper Po<strong>in</strong>t of the Mounta<strong>in</strong> stationFigure 4. Schematic diagram of probable lake levels <strong>in</strong> the Bonneville bas<strong>in</strong> dur<strong>in</strong>g the past170,000 years. Modified from Machette and others (1992); note breaks <strong>in</strong> temporal scale.
<strong>Wetlands</strong> <strong>in</strong> Northern <strong>Salt</strong> <strong>Lake</strong> <strong>Valley</strong>, <strong>Salt</strong> <strong>Lake</strong> <strong>County</strong>, <strong>Utah</strong>—an evaluation of the threats posed by ground-water developement and drought 7recorded the greatest evapotranspiration value of 47.64 <strong>in</strong>ches(121.01 cm) and the Alta station recorded the lowest value of28.87 <strong>in</strong>ches (73.33 cm) (Moller and Gillies, 2008). However,most weather stations have evapotranspiration values between42 and 48 <strong>in</strong>ches (107 and 122 cm), <strong>in</strong>clud<strong>in</strong>g the Mounta<strong>in</strong>Dell station (44.88 <strong>in</strong>ches [113.0 cm]), which has an elevationof 5420 feet (1652 m) and is located <strong>in</strong> Parleys Canyon(Moller and Gillies, 2008).Population and Land Use<strong>Salt</strong> <strong>Lake</strong> <strong>County</strong> has the largest county population <strong>in</strong> <strong>Utah</strong>,estimated at 1,009,518 <strong>in</strong> 2007 (Demographic and EconomicAnalysis Section, 2008). Based on this estimate, <strong>Salt</strong> <strong>Lake</strong><strong>County</strong> residents make up 42% of <strong>Utah</strong>’s total population of2,385,358 (Demographic and Economic Analysis Section,2008). The population of <strong>Salt</strong> <strong>Lake</strong> <strong>County</strong> is expected to<strong>in</strong>crease to 1,663,994 <strong>in</strong> 2050 (Demographic and EconomicAnalysis Section, 2005). The <strong>in</strong>crease <strong>in</strong> population <strong>in</strong> <strong>Salt</strong><strong>Lake</strong> <strong>County</strong> between 2000 and 2007 averaged 1.7% per year(Demographic and Economic Analysis Section, 2008).<strong>Salt</strong> <strong>Lake</strong> <strong>Valley</strong> was permanently settled <strong>in</strong> 1847 by Mormonpioneers. Agriculture, the dom<strong>in</strong>ant land use then, is nowpracticed by relatively few <strong>in</strong> the valley (although many residentshave gardens). <strong>Salt</strong> <strong>Lake</strong> City, <strong>Utah</strong>’s capital, is now amajor metropolitan area with numerous types of bus<strong>in</strong>essesand <strong>in</strong>dustries. Most <strong>Salt</strong> <strong>Lake</strong> <strong>County</strong> residents (94%) liveand work with<strong>in</strong> the county (Demographic and EconomicAnalysis Section, 2003). <strong>Salt</strong> <strong>Lake</strong> <strong>County</strong>’s largest employeris the University of <strong>Utah</strong>, followed by the State of <strong>Utah</strong> andthe Granite and Jordan School Districts, so local governmentagencies provide a substantial number of jobs (<strong>Salt</strong> <strong>Lake</strong><strong>County</strong> Economic Development Department, undated). Residentialand commercial developments are major <strong>in</strong>dustries <strong>in</strong>the valley, so most exist<strong>in</strong>g open space is either be<strong>in</strong>g developedor is planned for development, <strong>in</strong>clud<strong>in</strong>g some wetlandareas.GROUND‐WATER CONDITIONSBas<strong>in</strong>‐Fill AquifersBas<strong>in</strong>-fill aquifers <strong>in</strong> <strong>Salt</strong> <strong>Lake</strong> <strong>Valley</strong> <strong>in</strong>clude (1) a conf<strong>in</strong>edaquifer <strong>in</strong> the central and <strong>northern</strong> parts of the valley, (2) adeep unconf<strong>in</strong>ed aquifer between the conf<strong>in</strong>ed aquifer and themounta<strong>in</strong>s, (3) a shallow unconf<strong>in</strong>ed aquifer overly<strong>in</strong>g the artesianaquifer, and, locally, (4) unconf<strong>in</strong>ed perched aquifers(Hely and others, 1971). Together, the conf<strong>in</strong>ed aquifer andthe deep unconf<strong>in</strong>ed aquifer form the “pr<strong>in</strong>cipal aquifer”—most of the ground water discharged from wells <strong>in</strong> <strong>Salt</strong> <strong>Lake</strong><strong>Valley</strong> is from the pr<strong>in</strong>cipal aquifer.The conf<strong>in</strong>ed aquifer consists primarily of Quaternary clay,silt, sand, and gravel that are hydraulically <strong>in</strong>terconnected(Hely and others, 1971). The Quaternary deposits range <strong>in</strong>thickness from 0 to over 2000 feet (0–600+ m) (Arnow andothers, 1970); underly<strong>in</strong>g these sediments are relatively impermeableconsolidated and semiconsolidated Tertiary andpre-Tertiary deposits. A few areas exist where the Tertiary depositsconsist of permeable sand and gravel that yield waterto wells, and these areas are considered part of the pr<strong>in</strong>cipalaquifer (Hely and others, 1971).Overly<strong>in</strong>g the conf<strong>in</strong>ed aquifer is an upper conf<strong>in</strong><strong>in</strong>g layercomposed of Quaternary deposits of clay, silt, and f<strong>in</strong>e sandthat collectively create a s<strong>in</strong>gle impermeable layer. The conf<strong>in</strong><strong>in</strong>glayer is between 40 and 100 feet (12 and 30 m) thick,and the top of the layer is between 50 and 150 feet (15 and 46m) below the land surface.The shallow unconf<strong>in</strong>ed aquifer overlies the conf<strong>in</strong><strong>in</strong>g layerand is composed primarily of f<strong>in</strong>e-gra<strong>in</strong>ed sediments (Helyand others, 1971). It is only slightly more permeable than theconf<strong>in</strong><strong>in</strong>g layer, and <strong>in</strong> some areas it is difficult to differentiatebetween the two (Hely and others, 1971). The shallowunconf<strong>in</strong>ed aquifer has a maximum thickness of about 50 feet(15 m) and yields little water (the water is generally of lowquality), so it is rarely used for water supply (Seiler and Waddell,1984).The deep unconf<strong>in</strong>ed aquifer lies between the conf<strong>in</strong>ed aquiferand the mounta<strong>in</strong>s. It is part of the pr<strong>in</strong>cipal aquifer, wherethe water table lies below the conf<strong>in</strong><strong>in</strong>g layer or the conf<strong>in</strong><strong>in</strong>glayer is absent (Hely and others, 1971). Perched aquifersexist above the deep unconf<strong>in</strong>ed aquifer where there is anunsaturated zone between the water table <strong>in</strong> the deep unconf<strong>in</strong>edaquifer and the bottom of the upper conf<strong>in</strong><strong>in</strong>g layer. Thepr<strong>in</strong>cipal areas with perched aquifers are east of Midvale andbetween Riverton and Herriman (Hely and others, 1971), butless extensive perched aquifers are scattered around the marg<strong>in</strong>sof <strong>Salt</strong> <strong>Lake</strong> <strong>Valley</strong>.Recharge to the ground-water flow system <strong>in</strong> the bas<strong>in</strong>-fillaquifer is primarily from <strong>in</strong>flow from consolidated rock alongthe valley marg<strong>in</strong>s; seepage from rivers, streams, and canalsthat have a water-level elevation higher than the water table;<strong>in</strong>filtration of precipitation on the valley floor; and <strong>in</strong>filtrationfrom unconsumed irrigation water (Hely and others, 1971).Ground water flows from the primary recharge areas <strong>in</strong> themounta<strong>in</strong>s and near the valley marg<strong>in</strong>s to the deep unconf<strong>in</strong>edaquifer, then toward the central and <strong>northern</strong> parts of thevalley, where the pr<strong>in</strong>cipal aquifer is conf<strong>in</strong>ed (figures 5 and6). This creates an upward gradient, and ground water <strong>in</strong> theconf<strong>in</strong>ed aquifer flows upward <strong>in</strong>to the conf<strong>in</strong><strong>in</strong>g layer andthen <strong>in</strong>to the shallow unconf<strong>in</strong>ed aquifer, where it discharges<strong>in</strong>to the Jordan River, spr<strong>in</strong>gs, dra<strong>in</strong>s, canals, and Great <strong>Salt</strong><strong>Lake</strong>, or is lost through evapotranspiration. Ground water <strong>in</strong>the pr<strong>in</strong>cipal aquifer is either discharged <strong>in</strong>to the shallow unconf<strong>in</strong>edaquifer or is withdrawn by wells (Hely and others,1971).
8<strong>Utah</strong> Geological SurveyFigure 5. Generalized block diagram show<strong>in</strong>g water-bear<strong>in</strong>g formations, probable directions of ground-water movement (arrows), andareas of recharge and discharge, <strong>Salt</strong> <strong>Lake</strong> <strong>Valley</strong>, <strong>Salt</strong> <strong>Lake</strong> <strong>County</strong>, <strong>Utah</strong> (modified from Hely and others, 1971; Thiros and Mann<strong>in</strong>g, 2004).Transmissivity and storage coefficients range from 1000 to50,000 feet squared per day (90–5000 m 2 /d) and 0.15 to lessthan 0.0001 for the unconf<strong>in</strong>ed and conf<strong>in</strong>ed parts of the pr<strong>in</strong>cipalaquifer, respectively (Hely and others, 1971). The transmissivityof the shallow unconf<strong>in</strong>ed aquifer ranges from 50to 4000 feet squared per day (5–400 m 2 /d) (Waddell and others,1987a), and the storage coefficient is estimated to average0.15 (Hely and others, 1971). The vertical hydraulic conductivityof the conf<strong>in</strong><strong>in</strong>g bed between the shallow unconf<strong>in</strong>edand pr<strong>in</strong>cipal aquifer is estimated to average 0.025 feet perday (0.008 m/d) (Hely and others, 1971).Water levels <strong>in</strong> wells completed <strong>in</strong> the pr<strong>in</strong>cipal aquifer generallydecl<strong>in</strong>ed <strong>in</strong> most parts of <strong>Salt</strong> <strong>Lake</strong> <strong>Valley</strong> between1975 and 2005 (Burden and others, 2005), with the greatestdecl<strong>in</strong>es <strong>in</strong> the central-eastern and southern parts of the valley(figure 7). Water levels rose <strong>in</strong> wells <strong>in</strong> the northwestern andnortheastern parts of the valley dur<strong>in</strong>g the same time period.Ground‐Water QualityThe chemical composition of ground water <strong>in</strong> <strong>Salt</strong> <strong>Lake</strong> <strong>Valley</strong>varies with location and depth, primarily due to qualityof recharge sources and water-rock <strong>in</strong>teractions as it movesthrough the aquifer. Most of the recharge occurs on the eastside of the valley, and ground water <strong>in</strong> the pr<strong>in</strong>cipal aquifertypically has lower total-dissolved-solids (TDS) concentrationsnear the mouths of the larger streams (Big CottonwoodCreek, Little Cottonwood Creek) <strong>in</strong> southeastern <strong>Salt</strong> <strong>Lake</strong><strong>Valley</strong> (Hely and others, 1971); calcium-magnesium-bicarbonatetype ground water is generally found <strong>in</strong> this part ofthe valley (Thiros, 1995). Both bicarbonate type ground waterand sodium-chloride type ground water exist <strong>in</strong> the northwesternpart of <strong>Salt</strong> <strong>Lake</strong> <strong>Valley</strong> (Thiros, 1995). Ground water <strong>in</strong>the pr<strong>in</strong>cipal aquifer with the highest TDS concentrations isgenerally found <strong>in</strong> the vic<strong>in</strong>ity of Great <strong>Salt</strong> <strong>Lake</strong> <strong>in</strong> the northwesternpart of the valley (Hely and others, 1971). Based onwells completed <strong>in</strong> the pr<strong>in</strong>cipal aquifer from 1988 to 1992,the TDS concentrations ranged from 110 mg/L on the southeastside of the valley to 48,100 mg/L on the northwest side(Thiros, 1995). Ground-water quality classification of thepr<strong>in</strong>cipal bas<strong>in</strong>-fill aquifer is based on the <strong>Utah</strong> Water QualityBoard’s system, which is based primarily on TDS concentration(table 1). Accord<strong>in</strong>g to this system, 19% of the bas<strong>in</strong>-fillarea is classified as Prist<strong>in</strong>e ground water, 62% is classified asDr<strong>in</strong>k<strong>in</strong>g Water Quality ground water, 7% is classified as Lim-
<strong>Wetlands</strong> <strong>in</strong> Northern <strong>Salt</strong> <strong>Lake</strong> <strong>Valley</strong>, <strong>Salt</strong> <strong>Lake</strong> <strong>County</strong>, <strong>Utah</strong>—an evaluation of the threats posed by ground-water developement and drought 9(modified from Lambert and others, 1995).Figure 6. Recharge and discharge areas, <strong>Salt</strong> <strong>Lake</strong> <strong>Valley</strong> (modified from Anderson and others, 1994).ited Use ground water, and 12% is classified as Sal<strong>in</strong>e groundwater (Wallace and Lowe, 2009) (figure 8). Ground water <strong>in</strong>the pr<strong>in</strong>cipal aquifer generally has lower TDS concentrationsthan water <strong>in</strong> the shallow unconf<strong>in</strong>ed aquifer (Hely and others,1971).Total-dissolved-solids concentrations for ground water <strong>in</strong> theshallow unconf<strong>in</strong>ed aquifer range from 331 mg/L <strong>in</strong> the easternportion to 20,900 mg/L for the western portion of the valley(Thiros, 1995). The proximity to land surface, evapotranspiration,dissolution of m<strong>in</strong>erals, and recharge from water divertedfrom the Jordan River create more localized variationsand higher dissolved-solids concentrations <strong>in</strong> water from theshallow unconf<strong>in</strong>ed aquifer (Hely and others, 1971; Thiros,1995). Chloride concentrations have steadily <strong>in</strong>creased <strong>in</strong> thepr<strong>in</strong>cipal aquifer, probably from salt used for de-ic<strong>in</strong>g roads(Thiros, 1995).Ground water between the mouth of B<strong>in</strong>gham Canyon andthe Jordan River has been contam<strong>in</strong>ated by seepage fromevaporation ponds associated with m<strong>in</strong><strong>in</strong>g activities (Helyand others, 1971). The contam<strong>in</strong>ated ground water is acidic
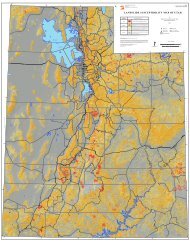
10<strong>Utah</strong> Geological SurveyFigure 7. Change <strong>in</strong> water level <strong>in</strong> <strong>Salt</strong> <strong>Lake</strong> <strong>Valley</strong> from spr<strong>in</strong>g 1975 to spr<strong>in</strong>g 2005 (modified from Burden and others, 2005).Table 1. Ground-water quality classes under the <strong>Utah</strong> Water Quality Board’s total-dissolved-solids- (TDS) based classification system(modified from <strong>Utah</strong> Division of Water Quality, 1998).Ground-Water Quality Class TDS Concentration Beneficial UseClass IA 1 /IB 1 /IC 2 less than 500 mg/L 3 Prist<strong>in</strong>e/Irreplaceable/Ecologically ImportantClass II 500 to less than 3000 mg/L Dr<strong>in</strong>k<strong>in</strong>g Water 4Class III 3000 to less than 10,000 mg/L Limited Use 5Class IV 10,000 mg/L and greater Sal<strong>in</strong>e 61 Irreplaceable ground water (Class IB) is a source of water for a community public dr<strong>in</strong>k<strong>in</strong>g-water system for which no otherreliable supply of comparable quality and quantity is available due to economic or <strong>in</strong>stitutional constra<strong>in</strong>ts; it is a ground-waterquality class that is not based on TDS. In addition to TDS, Class IA must not exceed any ground-water quality standards.2 Ecologically Important ground water (Class IC) is a source of ground-water discharge important to the cont<strong>in</strong>ued existenceof wildlife habitat; it is a ground-water quality class that is not based on TDS.3 For concentrations less than 7000 mg/L, mg/L is about equal to parts per million (ppm).4 Water hav<strong>in</strong>g TDS concentrations <strong>in</strong> the upper range of this class must generally undergo some treatment before be<strong>in</strong>g usedas dr<strong>in</strong>k<strong>in</strong>g water.5 Generally used for <strong>in</strong>dustrial purposes.6 May have economic value as br<strong>in</strong>e.
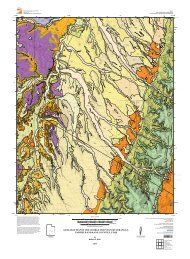
<strong>Wetlands</strong> <strong>in</strong> Northern <strong>Salt</strong> <strong>Lake</strong> <strong>Valley</strong>, <strong>Salt</strong> <strong>Lake</strong> <strong>County</strong>, <strong>Utah</strong>—an evaluation of the threats posed by ground-water developement and drought 11Figure 8. Ground-water quality classes for the pr<strong>in</strong>cipal bas<strong>in</strong>-fill aquifer, <strong>Salt</strong> lake <strong>Valley</strong> (from Wallace and Lowe, 2009).and has TDS concentrations as high as 75,000 mg/L (Waddelland others, 1987b). Ground water <strong>in</strong> the shallow unconf<strong>in</strong>edand pr<strong>in</strong>cipal aquifer <strong>in</strong> the vic<strong>in</strong>ity of South <strong>Salt</strong> <strong>Lake</strong> nearthe Jordan River has also been contam<strong>in</strong>ated by leachate fromuranium-mill tail<strong>in</strong>gs; ground water from this area has TDSconcentrations as high as 21,000 mg/L, and is contam<strong>in</strong>atedwith chloride, sulfate, iron, and uranium (Waddell and others,1987b). Volatile organic compounds and pesticides (primarilyatraz<strong>in</strong>e) are commonly found <strong>in</strong> monitor<strong>in</strong>g wells completed<strong>in</strong> the shallow unconf<strong>in</strong>ed aquifers; most of the volatile organiccompounds and all of the pesticides from shallow wellssampled <strong>in</strong> 1999 were below dr<strong>in</strong>k<strong>in</strong>g water standards (Waddelland others, 2004).WETLANDSIntroduction<strong>Wetlands</strong> are one of the most important ecosystems on Earth.They perform numerous biological and hydrological functions
12and are a valuable resource to communities. Wetland functions<strong>in</strong>clude wastewater treatment or water filtration, biogeochemicalcycl<strong>in</strong>g, floodwater control and storage, wildlifehabitat, biologic productivity, and food-cha<strong>in</strong> support; additionally,they have economic and cultural value (Lock, 1994)such as <strong>in</strong>creased residential property values.<strong>Wetlands</strong> are fac<strong>in</strong>g long-term impacts from both humanrelatedand natural causes. Human impacts are due to agricultural,<strong>in</strong>dustrial, and urban development and the result<strong>in</strong>gpollution. Natural impacts are generally due to climatologicalchanges. In the United States, an estimated 53% of wetlands<strong>in</strong> the lower 48 states have been destroyed s<strong>in</strong>ce the 1700sdue to human activities (Mitsch and Gossel<strong>in</strong>k, 2000). Agriculturalfields, commercial developments, and residentialdevelopments have typically replaced wetlands. Prior to themid-1970s, U.S. domestic policies encouraged the dra<strong>in</strong>ageof wetlands so that the land could be developed for economicbenefits. Now that the value and importance of wetlands havebeen recognized, conservation efforts have followed. The currentgoal of the U.S. government is to prevent net loss of wetlands,so when development of wetlands occurs, the amountof wetland area lost must be restored, created, or enhancedthrough the wetland mitigation process (U.S. Fish and WildlifeService, 1994). For additional <strong>in</strong>formation about wetlandsbackground, def<strong>in</strong>itions, and functions, refer to appendix A.<strong>Salt</strong> <strong>Lake</strong> <strong>County</strong> <strong>Wetlands</strong>Current National Wetland Inventory data (U.S. Fish andWildlife Service, 2010) show that 77% of wetlands <strong>in</strong> <strong>Utah</strong>are located with<strong>in</strong> 3 miles (5 km) of Great <strong>Salt</strong> <strong>Lake</strong>, whichcorresponds to an estimated 1.1 million acres (4450 km 2 ) ofwetlands. The <strong>Salt</strong> <strong>Lake</strong> <strong>County</strong> wetlands are mostly concentrated<strong>in</strong> the <strong>northern</strong> portion of the county along the shore ofGreat <strong>Salt</strong> <strong>Lake</strong> correspond<strong>in</strong>g to 49,300 acres (20,000 hm 2 ),or 84% with<strong>in</strong> 3 miles (5 km) of Great <strong>Salt</strong> <strong>Lake</strong>.Lock (1994) estimated that 30% of <strong>Utah</strong>’s wetlands has beenlost, mostly due to land-development practices. <strong>Salt</strong> <strong>Lake</strong><strong>County</strong> wetlands have been impacted by agricultural activities(<strong>in</strong>clud<strong>in</strong>g graz<strong>in</strong>g), <strong>in</strong>dustrial and urban development,and water diversions with ditches and dikes.N<strong>in</strong>ety-one percent of the wetlands are located <strong>in</strong> the pr<strong>in</strong>cipalaquifer ground-water discharge areas as determ<strong>in</strong>ed byAnderson and others (1994; figure 6), where there are one ormore conf<strong>in</strong>ed aquifers with an upward vertical flow gradientat depth and an overly<strong>in</strong>g shallow unconf<strong>in</strong>ed aquifer near theland surface. Much of the water supply for the wetlands isfrom the shallow unconf<strong>in</strong>ed aquifer. Thus, the elevation ofthe water table <strong>in</strong> the shallow unconf<strong>in</strong>ed aquifer partly determ<strong>in</strong>esthe areal extent of the wetlands. The shallow watertableelevation can also be controlled by surface water supplyto the wetlands, which varies with changes <strong>in</strong> recharge dueto climatic conditions and/or ground-water withdrawals fromwells and fluctuat<strong>in</strong>g Great <strong>Salt</strong> <strong>Lake</strong> levels.Wetland Types<strong>Utah</strong> Geological SurveyThe Emergency Wetland Resources Act of 1986 directs theU.S. Fish and Wildlife Service to map the wetlands of theUnited States; this mapp<strong>in</strong>g effort is referred to as the National<strong>Wetlands</strong> Inventory (NWI). <strong>Wetlands</strong> are typicallymapped us<strong>in</strong>g aerial photographs and are classified us<strong>in</strong>g theCoward<strong>in</strong> system. The Coward<strong>in</strong> system of wetland classification(Coward<strong>in</strong> and others, 1979) separates wetlands <strong>in</strong>tofive basic categories or systems: (1) lacustr<strong>in</strong>e, or lake-like,(2) river<strong>in</strong>e, or river, (3) palustr<strong>in</strong>e, or pond-like, (4) estuar<strong>in</strong>e,or estuary, and (5) mar<strong>in</strong>e, or oceanic. Once the wetlandshave been mapped and classified, any changes <strong>in</strong> their statusor trends can be monitored. NWI mapp<strong>in</strong>g for <strong>Salt</strong> <strong>Lake</strong><strong>County</strong> shows that the wetlands are dom<strong>in</strong>antly lacustr<strong>in</strong>e andpalustr<strong>in</strong>e with some river<strong>in</strong>e wetlands (figure 9, appendix B).Lacustr<strong>in</strong>e wetlands are associated with the shorel<strong>in</strong>e of Great<strong>Salt</strong> <strong>Lake</strong> as well as canals, ditches, and impoundments. Thepalustr<strong>in</strong>e wetlands are associated with spr<strong>in</strong>gs that dischargeground water.<strong>Salt</strong> <strong>Lake</strong> <strong>Valley</strong> wetlands occupy various types of habitats orenvironments. Except dur<strong>in</strong>g periods of extreme drought, thearea is largely permanently or periodically flooded lacustr<strong>in</strong>ewetland or open water (20,143 acres [8152 hm 2 ]) of Great <strong>Salt</strong><strong>Lake</strong>.From 2003 to 2008 much of this area was exposed as Great<strong>Salt</strong> <strong>Lake</strong> levels rema<strong>in</strong>ed near historic lows (figure 10).Other open-water environments are associated with sewagetreatmentponds and spr<strong>in</strong>g-fed ponds. The northwestern areaconsists of vegetated and non-vegetated m<strong>in</strong>eral and wet mudflats, transition<strong>in</strong>g to wet-meadow and emergent marsh environmentsto the northeastern border of the study area whereimpoundments have been built <strong>in</strong> the Farm<strong>in</strong>gton Bay WaterfowlManagement Area (FBWMA), private reserves, andhunt<strong>in</strong>g clubs.Orig<strong>in</strong>ally built <strong>in</strong> 1935 and occupy<strong>in</strong>g 3800 acres (1500 hm 2 ),the FBWMA has been expanded to over 12,000 acres (4900hm 2 ) <strong>in</strong> Davis and <strong>Salt</strong> <strong>Lake</strong> Counties and is managed by the<strong>Utah</strong> Division of Wildlife Resources (UDWR). As many as200 avian species have been documented us<strong>in</strong>g the wetlandsassociated with the FBWMA. The FBWMA wetlands providecritical year-round habitat for up to 57 species of waterfowland shorebirds, as many as 200,000 <strong>in</strong>dividuals, nest<strong>in</strong>g andforag<strong>in</strong>g <strong>in</strong> the spr<strong>in</strong>g and summer, and are also an importantstopover for millions of migrat<strong>in</strong>g waterfowl seasonally.The wetlands north of Interstate 80 are sourced by the JordanRiver, <strong>Salt</strong> <strong>Lake</strong> City Sewer Canal, Rudy Dra<strong>in</strong>, and Gogg<strong>in</strong>Dra<strong>in</strong> through a complex network of impoundments, canals,dikes, and various water-control structures (figure 11).Approximately 17,000 acres (6900 hm 2 ) of wetlands are dikedor impounded and are very precisely managed with waterdepths rang<strong>in</strong>g from 0 to 14 <strong>in</strong>ches (0–36 cm) to maximize waterfowlhabitat (<strong>Utah</strong> Division of Wildlife Resources, 2006).
18<strong>Utah</strong> Geological SurveyFigure 12. Areal extent of model layer 1 <strong>in</strong> <strong>Salt</strong> <strong>Lake</strong> <strong>Valley</strong> (from Lambert, 1995a).With respect to the specific wetlands areas under this scenario(table 4), recharge from precipitation would decrease from24,300 acre-feet per year (30 hm 3 /yr) dur<strong>in</strong>g the last stressperiod of the historical transient simulation (table 3) to 24,100acre-feet per year (29.7 hm 3 /yr). Subsurface <strong>in</strong>flow to the wetlandregions would similarly decrease from 27,800 acre-feetper year (34 hm 3 /yr) to 14,500 acre-feet per year (18 hm 3 /yr).Total ground-water discharge from the wetlands will be higherat 39,610 acre-feet per year (49 hm 3 /yr) than total groundwater<strong>in</strong>flow of 38,910 acre-feet per year (48 hm 3 /yr), result<strong>in</strong>g<strong>in</strong> a deficit of 1.8% <strong>in</strong> the ground-water budget.Scenario 2 – Increased Pump<strong>in</strong>gIf recharge rema<strong>in</strong>s the same as the level of the last stressperiod of the transient model (table 2) while pump<strong>in</strong>g rateis <strong>in</strong>creased by 10%, a surplus of about 1600 acre-feet peryear (2 hm 3 /yr) will develop <strong>in</strong> model layer 1. Other budgetcomponents are as shown <strong>in</strong> table 5. Our results show thatthe hydrologic conditions of the wetlands will improve undera 10% <strong>in</strong>crease <strong>in</strong> pump<strong>in</strong>g while ma<strong>in</strong>ta<strong>in</strong><strong>in</strong>g historical rechargelevels compared to a reduction <strong>in</strong> recharge by the samemarg<strong>in</strong>.
<strong>Wetlands</strong> <strong>in</strong> Northern <strong>Salt</strong> <strong>Lake</strong> <strong>Valley</strong>, <strong>Salt</strong> <strong>Lake</strong> <strong>County</strong>, <strong>Utah</strong>—an evaluation of the threats posed by ground-water developement and drought 19Table 2. Average annual simulated ground-water recharge and discharge for model layer 1.Water‐budgetcomponentSteady‐statesimulationsTransient‐statesimulationsChange from steadystate to transientEstimated quantity(acre-feet per year)Estimated quantity(acre-feet per year)%RechargeJordan River 1300 1900 +46Precipitation 88,000 83,000 -6Subsurface <strong>in</strong>flow(from pr<strong>in</strong>cipal aquifer)114,000 93,000 -19Irrigation fields 23,500 23,500 0Storage - 700 -TOTAL 226,800 202,100 ‐11DischargeGreat <strong>Salt</strong> <strong>Lake</strong> 1200 1200 0Spr<strong>in</strong>gs and dra<strong>in</strong>s 9600 7200 -25Evapotranspiration 36,400 32,000 -12Jordan River 140,000 116,000 -17Subsurface outflow 36,600 37,000 +1Canals 6300 6300 0TOTAL 230,100 199,700 ‐13Table 3. Ground-water budget for the wetland areas under steady-state and historical transient conditions.Water‐budget component Steady‐state simulations Transient‐state simulationsEstimated quantity(Acre-feet per year)Estimated quantity(Acre-feet per year)RechargeStorage - 290Jordan River 40 30Precipitation 23,700 24,300Subsurface <strong>in</strong>flow(from pr<strong>in</strong>cipal aquifer)26,400 27,800TOTAL 50,140 52,420DischargeGreat <strong>Salt</strong> <strong>Lake</strong> 1200 1200Spr<strong>in</strong>gs and dra<strong>in</strong>s 3500 3800Evapotranspiration 27,000 27,900Jordan River 18,500 19,100Subsurface outflow 10 80TOTAL 50,210 52,080
20<strong>Utah</strong> Geological SurveyTable 4. Ground-water budget for model layer 1and wetland areas after a 10% drop <strong>in</strong> recharge for 10 stress periods.Water‐budget componentModel layer 1(Acre‐feet per year)Wetland areas(Acre‐feet per year)RechargePrecipitation 75,000 24,100Subsurface <strong>in</strong>flow(from pr<strong>in</strong>cipal aquifer)93,000 14,500Irrigation fields 21,200 -Jordan River 1900 30DischargeStorage 77,700 280TOTAL 268,800 38,910Evapotranspiration 32,400 24,940Jordan River 116,200 10,150Spr<strong>in</strong>gs and dra<strong>in</strong>s 7200 2420Great <strong>Salt</strong> <strong>Lake</strong> 1200 1180Canals 6400 -Subsurface outflow 36,600 650Out storage 77,800 270TOTAL 277,800 39,610The wetland areas (table 5) would receive a total of 42,410acre-feet per year (50 hm 3 /yr) <strong>in</strong> recharge, and discharge atotal of 42,420 acre-feet per year (50 hm 3 /yr). A 10% <strong>in</strong>crease<strong>in</strong> pump<strong>in</strong>g at historical recharge rates will reduce evapotranspiration.Scenario 3 – Increased Pump<strong>in</strong>g and DecreasedRechargeA decrease <strong>in</strong> recharge by 10% with an <strong>in</strong>crease <strong>in</strong> pumpagefrom the pr<strong>in</strong>cipal aquifer by 10% would result <strong>in</strong> a deficitof about 19,000 acre-feet per year (23 hm 3 /yr) <strong>in</strong> the groundwaterbudget for model layer 1. Both recharge and dischargeare lower than the scenario under which there is a 10% decrease<strong>in</strong> recharge but pump<strong>in</strong>g rema<strong>in</strong>s the same (table 4),and the deficit <strong>in</strong> the ground-water budget is about doubled.The ground-water budget components under this scenario aresummarized <strong>in</strong> table 6.For the wetlands areas under this scenario (table 6), theground-water budget is expected to be <strong>in</strong> deficit by about1.5%. Evapotranspiration would decrease from its historicaltransient level of 27,900 acre-feet per year (34 hm 3 /yr) toabout 17,000 acre-feet per year (21 hm 3 /yr). About 3500 acrefeetper year (4 hm 3 /yr) of ground water would be dischargedthrough spr<strong>in</strong>gs and dra<strong>in</strong>s. This figure is lower comparedto the 3800 acre-feet per year (5 hm 3 /yr) discharged throughspr<strong>in</strong>gs and dra<strong>in</strong>s dur<strong>in</strong>g the last stress period of the historicaltransient simulation. Ground-water outflow to Great <strong>Salt</strong><strong>Lake</strong> would rema<strong>in</strong> the same at 1200 acre-feet per year (1.5hm 3 /yr), while subsurface outflow would drastically fall from80 acre-feet per year (0.1 hm 3 /yr) at the end the historicaltransient simulation to about 10 acre-feet per year (0.01 hm 3 /yr). The comb<strong>in</strong>ed effect of <strong>in</strong>creased pump<strong>in</strong>g and reducedrecharge would thus pose the most damag<strong>in</strong>g effect on theconditions of the wetlands <strong>in</strong> the area.Scenario 4 – Increased Recharge with Increas<strong>in</strong>gPumpageWith both pumpage and recharge <strong>in</strong>creased by 10%, theground-water budget for model layer 1 <strong>in</strong>dicates a surplus ofabout 11,000 acre-feet per year (14 hm 3 /yr) (table 7). In termsof wetlands hydrology, this is the best (most beneficial to wetlandshealth) of the scenarios we chose to model as part of thisstudy. Recharge from precipitation and subsurface rechargeboth <strong>in</strong>crease with respect to the historical and steady-statevalues. Model layer 1 has no pump<strong>in</strong>g wells completed with<strong>in</strong>it, and the pr<strong>in</strong>cipal sources of discharge are evapotranspiration,subsurface discharge, discharge through dra<strong>in</strong>s and
<strong>Wetlands</strong> <strong>in</strong> Northern <strong>Salt</strong> <strong>Lake</strong> <strong>Valley</strong>, <strong>Salt</strong> <strong>Lake</strong> <strong>County</strong>, <strong>Utah</strong>—an evaluation of the threats posed by ground-water developement and drought 21Table 5. Ground-water budget for model layer 1 and wetland areas after a 10% <strong>in</strong>crease <strong>in</strong> pump<strong>in</strong>g from the pr<strong>in</strong>cipal aquifer for10 stress periods, while ma<strong>in</strong>ta<strong>in</strong><strong>in</strong>g historical recharge levels.RechargeWater‐budget componentModel layer 1(Acre‐feet per year)Wetland areas(Acre‐feet per year)DischargePrecipitation 83,000 24,290Subsurface <strong>in</strong>flow(from pr<strong>in</strong>cipal aquifer)87,600 17,800Irrigation fields 23,500 -Jordan River 2000 30Storage 640 290TOTAL 196,940 42,410Evapotranspiration 31,700 17,910Jordan River 109,900 19,110Spr<strong>in</strong>gs and dra<strong>in</strong>s 7000 3820Great <strong>Salt</strong> <strong>Lake</strong> 1100 1190Canals 7000 -Subsurface outflow 38,000 80Out storage 630 310TOTAL 195,330 42,420Table 6. Ground-water budget for model layer 1 and wetland areas after a 10% decrease <strong>in</strong> recharge and a 10% <strong>in</strong>crease <strong>in</strong> pump<strong>in</strong>g.RechargeWater‐budget componentModel layer 1(Acre‐feet per year)Wetland areas(Acre‐feet per year)DischargePrecipitation 75,000 24,100Subsurface <strong>in</strong>flow(from pr<strong>in</strong>cipal aquifer)83,000 14,500Irrigation fields 21,200 -Jordan River 1900 30Storage 640 280TOTAL 181,740 38,910Evapotranspiration 32,000 17,000Jordan River 116,000 17,500Spr<strong>in</strong>gs and dra<strong>in</strong>s 7200 3500Great <strong>Salt</strong> <strong>Lake</strong> 1100 1200Canals 7000 -Subsurface outflow 36,600 10Out storage 630 300TOTAL 200,530 39,510
22<strong>Utah</strong> Geological SurveyTable 7. Ground-water budget for model layer 1 and wetland areas after a 10% <strong>in</strong>crease <strong>in</strong> recharge and pump<strong>in</strong>g.RechargeDischargeWater‐budget componentModel layer 1(Acre‐feet per year)Wetland areas(Acre‐feet per year)Precipitation 91,000 27,000Subsurface <strong>in</strong>flow(from pr<strong>in</strong>cipal aquifer)93,000 6200Irrigation fields 26,000 -Jordan River 1900 30Storage 600 280TOTAL 212,500 33,500Evapotranspiration 32,000 24,000Jordan River 116,000 630Spr<strong>in</strong>gs and dra<strong>in</strong>s 7200 2400Great <strong>Salt</strong> <strong>Lake</strong> 1200 1200Canals 7000 -Subsurface outflow 37,000 460Out storage 700 250TOTAL 201,100 28,940spr<strong>in</strong>gs, discharge to Great <strong>Salt</strong> <strong>Lake</strong>, and discharge throughcanals.If recharge <strong>in</strong>creases by 10% while pumpage <strong>in</strong>creases by thesame marg<strong>in</strong>, the wetland areas (table 7) would receive about4,560 acre-feet per year (6 hm 3 /yr) more recharge than discharge.Obviously, this would be beneficial for ma<strong>in</strong>ta<strong>in</strong><strong>in</strong>g<strong>Salt</strong> <strong>Lake</strong> <strong>Valley</strong> wetlands.Conclusions from Water‐Budget Model<strong>in</strong>gThe wetlands <strong>in</strong> <strong>Salt</strong> <strong>Lake</strong> <strong>Valley</strong> are downgradient of most ofthe water users <strong>in</strong> the bas<strong>in</strong>, so wetland health and functionalitydepend on upgradient activity.Determ<strong>in</strong><strong>in</strong>g the worst-case scenario for wetland degradationis difficult due to ground-water-model limitations (such assimplified ground-water recharge mechanisms) and the complexityof the ground-water flow system <strong>in</strong> <strong>Salt</strong> <strong>Lake</strong> <strong>Valley</strong>.As with all models, the ground-water flow models of <strong>Salt</strong> <strong>Lake</strong><strong>Valley</strong> are based on a conceptual model of the bas<strong>in</strong> that <strong>in</strong>turn depends on (1) how well we understand the processes operat<strong>in</strong>g<strong>in</strong> the aquifer, (2) how well we know and represent thegeometry of the system, and (3) how accurate our underly<strong>in</strong>gassumptions are <strong>in</strong> relation to development of the model. Webelieve Lambert (1995a) had a good understand<strong>in</strong>g of aquiferprocesses and system geometry and made relatively accurateassumptions <strong>in</strong> relation to the development of his models, butrecognize the limitations of ground-water model<strong>in</strong>g. Modelscan predict an outcome that may not actually occur with<strong>in</strong>the real-world ground-water system. However, the modelsoffer the best tools we have for evaluat<strong>in</strong>g the complexity ofground-water flow. The modeled results are meant to generatepossible outcomes for the proposed scenarios, which, mostimportantly, will help guide land-use plann<strong>in</strong>g and developmentdecisions.Ma<strong>in</strong>ta<strong>in</strong><strong>in</strong>g hydrologic conditions at their historical levels isextremely important for the ma<strong>in</strong>tenance of the <strong>Salt</strong> <strong>Lake</strong> <strong>Valley</strong>wetlands. The water-budget analysis we conducted quantifiesthe amount of water flow<strong>in</strong>g <strong>in</strong>to and out of the <strong>Salt</strong> <strong>Lake</strong><strong>Valley</strong> wetlands area, at least accord<strong>in</strong>g to the ground-waterflow models. Our model<strong>in</strong>g results suggest that recharge assubsurface <strong>in</strong>flow to wetland areas would decrease more bycont<strong>in</strong>u<strong>in</strong>g drought than by <strong>in</strong>creased pump<strong>in</strong>g (at least at thedecreased recharge and <strong>in</strong>creased pump<strong>in</strong>g levels used <strong>in</strong> ourscenarios), especially <strong>in</strong> light of the lower<strong>in</strong>g Great <strong>Salt</strong> <strong>Lake</strong>levels that could occur dur<strong>in</strong>g such a drought. The model suggeststhat a change to wetter-than-normal conditions would<strong>in</strong>crease recharge as subsurface <strong>in</strong>flow to the wetland areas,caus<strong>in</strong>g an <strong>in</strong>crease <strong>in</strong> spr<strong>in</strong>g and seep discharge and evapotranspiration;this represents the most beneficial scenario forthe wetlands. Increased water withdrawals from wells <strong>in</strong> <strong>Salt</strong><strong>Lake</strong> <strong>Valley</strong> causes a reduction <strong>in</strong> recharge to the wetland
<strong>Wetlands</strong> <strong>in</strong> Northern <strong>Salt</strong> <strong>Lake</strong> <strong>Valley</strong>, <strong>Salt</strong> <strong>Lake</strong> <strong>County</strong>, <strong>Utah</strong>—an evaluation of the threats posed by ground-water developement and drought 23areas, but most of the change is accounted for by reduced subsurfaceoutflow from the wetlands area. Development <strong>in</strong> <strong>Salt</strong><strong>Lake</strong> <strong>Valley</strong> does have some effect on recharge to the wetlandareas, as shown by the reduced recharge from steadystateconditions at the end of the transient simulation. Theworst-case scenario for the wetlands would be a comb<strong>in</strong>ationof long-term drought and <strong>in</strong>creased ground-water pumpage.Consider<strong>in</strong>g the pressure for more development and the likelihoodof periodic drought, this comb<strong>in</strong>ed scenario seems plausible.If this comb<strong>in</strong>ed scenario occurs, the loss of recharge tothe <strong>Salt</strong> <strong>Lake</strong> <strong>Valley</strong> wetland areas would most likely result<strong>in</strong> a decrease <strong>in</strong> wetland functionality; some parts of the wetlandswould dry up and upland plants would replace wetlandplants, or the land would become so dry and sal<strong>in</strong>e that onlyhalophilic plants would be able to survive. The other possibilityunder the comb<strong>in</strong>ed <strong>in</strong>creased pumpage and drought scenariowould be that the wetlands function for only a short timedur<strong>in</strong>g the spr<strong>in</strong>g when water is abundant enough to produceponds and marshes; later <strong>in</strong> the year the wetlands would dryup, leav<strong>in</strong>g little to no water for plants or animals <strong>in</strong> the wetlandcommunity.CONCLUSIONS ANDRECOMMENDATIONSThe federal government has a “no net loss” policy for wetlands,but the local community is responsible for identify<strong>in</strong>gthe threats posed to local wetlands, and develop<strong>in</strong>g a plan forpreserv<strong>in</strong>g and manag<strong>in</strong>g the wetlands. To meet this federalpolicy, the <strong>Salt</strong> <strong>Lake</strong> <strong>Valley</strong> wetlands area should be managedto ma<strong>in</strong>ta<strong>in</strong> the current water budget, estimated to <strong>in</strong>clude52,420 acre-feet per year (65 hm 3 /yr) of recharge from allsources, of which 27,800 acre-feet per year (34 hm 3 /yr) is subsurface<strong>in</strong>flow. To reduce the potential for degradation to the<strong>Salt</strong> <strong>Lake</strong> <strong>Valley</strong> wetlands, restrictions could be placed on theareas of potential development, such as allow<strong>in</strong>g developmentonly <strong>in</strong> upland environments or plac<strong>in</strong>g a non-developmentbuffer zone around the wetland areas. Overall, agriculturalland use is more beneficial to wetland health and functionalitythan <strong>in</strong>dustrial and urban land use, because of the prospectof recharge from irrigation and other agricultural return flow.If local governments <strong>in</strong>tend to allow cont<strong>in</strong>ued development<strong>in</strong> these areas, allow<strong>in</strong>g land uses that have m<strong>in</strong>imal impactsto wetlands, such as rotational graz<strong>in</strong>g on irrigated pastures,low-density rural developments, and s<strong>in</strong>gle-family residentialdevelopments with a half acre of native vegetation betweenhouses, would be the best approach for preserv<strong>in</strong>g the <strong>Salt</strong><strong>Lake</strong> <strong>Valley</strong> wetlands. Treated wastewater from municipalsewers, where possible, could be reused or discharged to theenvironment upgradient of the wetlands, preserv<strong>in</strong>g this waterfor wetland use. Implementation of water-conservation practiceswould also be beneficial for wetland environments. Thiswould help ensure that the wetlands receive the water theyneed to ma<strong>in</strong>ta<strong>in</strong> their functionality.Our study <strong>in</strong>dicates the wetlands <strong>in</strong> <strong>Salt</strong> <strong>Lake</strong> <strong>Valley</strong> may bestressed <strong>in</strong> the future. The potential causes of this stress aredrought and <strong>in</strong>creased development due to population growth,which could dramatically reduce the amount of water the wetlandsreceive. We cannot predict changes <strong>in</strong> climate with certa<strong>in</strong>ty,but we can plan appropriately for future development.ACKNOWLEDGMENTSWe thank the U.S. Environmental Protection Agency for provid<strong>in</strong>gpartial fund<strong>in</strong>g for this project. We give special thanksto Nancy Keate, former <strong>Wetlands</strong> Coord<strong>in</strong>ator for the State of<strong>Utah</strong>, for the help and guidance she provided for this project.We thank <strong>Salt</strong> <strong>Lake</strong> City International Airport Land Management,Rudy Duck Club, and the <strong>Utah</strong> Division of WildlifeResources (Lee Kay Center and Farm<strong>in</strong>gton Bay WaterfowlManagement Area) for allow<strong>in</strong>g access to their land for <strong>in</strong>stall<strong>in</strong>gmonitor<strong>in</strong>g wells, and Kim Nay, <strong>Utah</strong> GeologicalSurvey, for prepar<strong>in</strong>g many of the figures for this publication.Technical review comments were provided by Janae Wallace,Robert Ressetar, Mike Hylland, and Kimm Harty, <strong>Utah</strong> GeologicalSurvey.REFERENCESAnderson, P.B., and Susong, D.D., 1995, Hydrogeology of rechargeareas of the pr<strong>in</strong>cipal aquifers along the WasatchFront and adjacent areas, <strong>Utah</strong>, <strong>in</strong> Lund, W.R., editor, Environmental& eng<strong>in</strong>eer<strong>in</strong>g geology of the Wasatch Frontregion: <strong>Utah</strong> Geological Association Publication 24, p.249-268.Anderson, P.B., Susong, D.D., Wold, S.R., Heilweil, V.M., andBask<strong>in</strong>, R.L., 1994, Hydrogeology of recharge areas andwater quality of the pr<strong>in</strong>cipal aquifers along the WasatchFront and adjacent areas, <strong>Utah</strong>: U.S. Geological SurveyWater-Resources Investigations Report 93-4221, 74 p.Arnow, T., and Mattick, R.E., 1968, Thickness of valley fill <strong>in</strong>the Jordan <strong>Valley</strong> east of Great <strong>Salt</strong> <strong>Lake</strong>, <strong>Utah</strong>, <strong>in</strong> GeologicalSurvey research 1968: U.S. Geological SurveyProfessional Paper 600-B, p. B79-B82.Arnow, T., Van Horn, R., and LaPray, R., 1970, The pre-Quaternarysurface <strong>in</strong> the Jordan <strong>Valley</strong>, <strong>Utah</strong>, <strong>in</strong> GeologicalSurvey research 1970: U.S. Geological Survey ProfessionalPaper 700-D, p. D257-D261.Ashcroft, G.L, Jensen, D.T., and Brown, J.L., 1992, <strong>Utah</strong> climate:Logan, <strong>Utah</strong> Climate Center, <strong>Utah</strong> State University,125 p.Bishop, C.E., Lowe, M., Wallace, J., Emerson, R.L., andHorn, J.S., 2009, <strong>Wetlands</strong> <strong>in</strong> the Farm<strong>in</strong>gton Bay area,Davis <strong>County</strong>, <strong>Utah</strong>–an evaluation of threats posed byground-water development and drought: <strong>Utah</strong> Geological
24Survey Report of Investigation 264, 36 p.Burden, C.B., and others, 2005, Ground-water conditions <strong>in</strong><strong>Utah</strong>, spr<strong>in</strong>g of 2005: <strong>Utah</strong> Division of Water Resources,<strong>Utah</strong> Division of Water Rights, and U.S. Geological SurveyCooperative Investigations Report No. 46, 138 p.Burk, N., Bishop, C., and Lowe, M., 2005, <strong>Wetlands</strong> <strong>in</strong> Tooele<strong>Valley</strong>, <strong>Utah</strong>–an evaluation of threats posed by groundwaterdevelopment and drought: <strong>Utah</strong> Geological SurveySpecial Study 117, 37 p., scale 1:40,000.Coward<strong>in</strong>, L.M., Carter, V., Golet, F.C., and LaRoe, E.T.,1979, Classification of wetlands and deepwater habitatsof the United States: U.S. Fish and Wildlife Service,Wash<strong>in</strong>gton, D.C., 103 p.Demographic and Economic Analysis Section, 2003, <strong>Utah</strong>data guide, fall 2003: <strong>Salt</strong> <strong>Lake</strong> City, <strong>Utah</strong>’s Governor’sOffice of Plann<strong>in</strong>g and Budget, 12 p.Demographic and Economic Analysis Section, 2005, <strong>Utah</strong>data guide, summer/fall 2005: <strong>Salt</strong> <strong>Lake</strong> City, <strong>Utah</strong> Governor’sOffice of Plann<strong>in</strong>g and Budget, 12 p.Demographic and Economic Analysis Section, 2008, <strong>Utah</strong>data guide, summer 2008: <strong>Salt</strong> <strong>Lake</strong> City, <strong>Utah</strong> Governor’sOffice of Plann<strong>in</strong>g and Budget, 12 p.Hely, A.G., Mower, R.W., and Horr, C.A., 1967, Hydrologicand climatologic data, 1966, <strong>Salt</strong> <strong>Lake</strong> <strong>County</strong>, <strong>Utah</strong>:<strong>Utah</strong> Basic-Data Release No. 13, 85 p.Hely, A.G., Mower, R.W., and Horr, C.A., 1968, Hydrologicand climatologic data, 1967, <strong>Salt</strong> <strong>Lake</strong> <strong>County</strong>, <strong>Utah</strong>:<strong>Utah</strong> Basic-Data Release No. 15, 74 p.Hely, A.G., Mower, R.W., and Horr, C.A., 1969, Hydrologicand climatologic data, 1968, <strong>Salt</strong> <strong>Lake</strong> <strong>County</strong>, <strong>Utah</strong>:<strong>Utah</strong> Basic-Data Release No. 17, 70 p.Hely, A.G., Mower, R.W., and Horr, C.A., 1971, Water resourcesof <strong>Salt</strong> <strong>Lake</strong> <strong>County</strong>, <strong>Utah</strong>: <strong>Utah</strong> Department ofNatural Resources Technical Publication No. 31, 244 p.Herbert, L.R., Cruff, R.W., and Waddell, K.M., 1985, Seepagestudy of six canals <strong>in</strong> <strong>Salt</strong> <strong>Lake</strong> <strong>County</strong>, <strong>Utah</strong>, 1982-83:<strong>Utah</strong> Department of Natural Resources Technical PublicationNo. 82, 95 p.Lambert, P.M., 1995a, Numerical simulation of ground-waterflow <strong>in</strong> bas<strong>in</strong>-fill material <strong>in</strong> <strong>Salt</strong> <strong>Lake</strong> <strong>Valley</strong>, <strong>Utah</strong>: <strong>Utah</strong>Department of Natural Resources Technical Publication110-B, 58 p.Lambert, P.M., 1995b, Particle-track<strong>in</strong>g analysis of timerelatedcapture zones for selected public-supply wells <strong>in</strong><strong>Salt</strong> <strong>Lake</strong> <strong>Valley</strong>, <strong>Utah</strong>: <strong>Utah</strong> Department of Natural ResourcesTechnical Publication 110-C, 36 p.Lambert, P.M., 1996, Numerical simulation of the movementof sulfate <strong>in</strong> ground water <strong>in</strong> southwestern <strong>Salt</strong> <strong>Lake</strong> <strong>Valley</strong>,<strong>Utah</strong>: <strong>Utah</strong> Department of Natural Resources TechnicalPublication 110-D, 44 p.Lock, P.A., 1994, <strong>Utah</strong>’s wetland workbook: <strong>Salt</strong> <strong>Lake</strong> City,<strong>Utah</strong> Division of Wildlife Resources, 63 p.<strong>Utah</strong> Geological SurveyLofgren, B.E., 1952, Jordan <strong>Valley</strong>, <strong>Salt</strong> <strong>Lake</strong> <strong>County</strong>, <strong>in</strong> Statusof development of selected ground-water bas<strong>in</strong>s <strong>in</strong><strong>Utah</strong>: <strong>Utah</strong> State Eng<strong>in</strong>eer Technical Publication No. 7,p. 76-83.Lowe, M., and Wallace, J., 2006, Ground water sensitivity andvulnerability to pesticides, <strong>northern</strong> and central WasatchFront, <strong>Utah</strong>, <strong>in</strong> Harty, K.M., and Tabet, D.E, editors, Geologyof northwest <strong>Utah</strong>: <strong>Utah</strong> Geological AssociationPublication 34, 49 p.Lowe, M., Wallace, J., Burk, N., Johnson, A., Johnson, J., andRid<strong>in</strong>g, R., 2005, Ground-water sensitivity and vulnerabilityto pesticides, <strong>Salt</strong> <strong>Lake</strong> <strong>Valley</strong>, <strong>Salt</strong> <strong>Lake</strong> <strong>County</strong>,<strong>Utah</strong>: <strong>Utah</strong> Geological Survey Miscellaneous Publication05-7, 27 p., scale 1:120,000, CD-ROM.Machette, M.N., Personius, S.F., and Nelson, A.R., 1992, Paleoseismologyof the Wasatch fault zone—a summary ofrecent <strong>in</strong>vestigations, <strong>in</strong>terpretations, and conclusions,<strong>in</strong> Gori, P.L., and Hays, W.W., editors, Assessment andregional earthquake hazards and risk along the WasatchFront, <strong>Utah</strong>: U.S. Geological Survey Professional Paper1500-A-J, p. A1-A71.Mar<strong>in</strong>e, I.W., and Price, D., 1964, Geology and ground-waterresources of the Jordan <strong>Valley</strong>, <strong>Utah</strong>: <strong>Utah</strong> Geological andM<strong>in</strong>eralogical Survey Water Resources Bullet<strong>in</strong> 7, 68 p.Marsell, R.E., 1964, Water supply, <strong>in</strong> Crawford, A.L., editor,Geology of <strong>Salt</strong> <strong>Lake</strong> <strong>County</strong>: <strong>Utah</strong> Geological and M<strong>in</strong>eralogicalSurvey Bullet<strong>in</strong> 69, p. 141-155.Mattick, E.R., 1970, Thickness of unconsolidated to semiconsolidatedsediments <strong>in</strong> Jordan <strong>Valley</strong>, <strong>Utah</strong>: U.S. GeologicalSurvey Professional Paper 700-C, p. C119-C124.McDonald, M.G., and Harbaugh, A.W., 1988, A modularthree-dimensional f<strong>in</strong>ite-difference ground-water flowmodel: U.S. Geological Survey Techniques of Water-ResourcesInvestigations, book 6, chapter A1.Mitsch, W.J., and Gossel<strong>in</strong>k, J.G., 2000, <strong>Wetlands</strong>: New York,John Wiley and Sons, 920 p.Moller, A.L., and Gillies, R.R., 2008, <strong>Utah</strong> Climate (secondedition): Logan, <strong>Utah</strong>, <strong>Utah</strong> Climate Center, <strong>Utah</strong> StateUniversity, 109 p.Mower, R.W., 1968, Ground-water discharge toward Great<strong>Salt</strong> <strong>Lake</strong> through valley fill <strong>in</strong> the Jordan <strong>Valley</strong>, <strong>Utah</strong>, <strong>in</strong>Geological Survey research 1968: U.S. Geological SurveyProfessional Paper 600-D, p. D71-D74.Mower, R.W., 1969a, Groundwater hydrology of the Jordan<strong>Valley</strong>, <strong>Utah</strong>, <strong>in</strong> Jensen, M.L., editor, Guidebook of <strong>northern</strong><strong>Utah</strong>: <strong>Utah</strong> Geological and M<strong>in</strong>eralogical SurveyBullet<strong>in</strong> 82, p. 159-173.Mower, R.W., 1969b, Ground-water <strong>in</strong>flow toward Jordan<strong>Valley</strong> through channel fill <strong>in</strong> seven canyons <strong>in</strong> the WasatchRange near <strong>Salt</strong> <strong>Lake</strong> City, <strong>Utah</strong>, <strong>in</strong> Geological Surveyresearch 1969: U.S. Geological Survey ProfessionalPaper 650-C, p. C174-C176.
<strong>Wetlands</strong> <strong>in</strong> Northern <strong>Salt</strong> <strong>Lake</strong> <strong>Valley</strong>, <strong>Salt</strong> <strong>Lake</strong> <strong>County</strong>, <strong>Utah</strong>—an evaluation of the threats posed by ground-water developement and drought 25Mower, R.W., 1970, Ground-water <strong>in</strong>flow toward Jordan <strong>Valley</strong>from <strong>Utah</strong> <strong>Valley</strong> through valley fill near the JordanNarrows, <strong>Utah</strong>, <strong>in</strong> Geological Survey research 1970: U.S.Geological Survey Professional Paper 700-B, p. B199-B202.Murphy, D.R., 1981, Climatic zones, <strong>in</strong> Greer, D.C., Gurgel,K.D., Walquist, W.L., Christy, H.A., and Peterson, G.B.,editors, Atlas of <strong>Utah</strong>: Provo, <strong>Utah</strong>, Brigham Young UniversityPress, p. 55-70.National Wildlife Federation, 1989, A citizen’s guide to protect<strong>in</strong>gwetlands: Wash<strong>in</strong>gton, D.C., National WildlifeFederation, 64 p.Richardson, G.B., 1906, Underground water <strong>in</strong> the valleys of<strong>Utah</strong> <strong>Lake</strong> and Jordan River, <strong>Utah</strong>: U.S. Geological SurveyWater Supply Paper 157, 81 p.<strong>Salt</strong> <strong>Lake</strong> <strong>County</strong> Economic Development Department, undated,Top <strong>in</strong>dustries: Onl<strong>in</strong>e, http://www.econdev.slco.org/content/<strong>in</strong>dustry_t7.cfm, accessed March 23, 2005.Seiler, R.L., and Waddell, K.M., 1984, Reconnaissance of theshallow-unconf<strong>in</strong>ed aquifer <strong>in</strong> <strong>Salt</strong> <strong>Lake</strong> <strong>Valley</strong>, <strong>Utah</strong>:U.S. Geological Survey Water-Resources InvestigationsReport 83-4272, 34 p.Stokes, W.L., 1977, Subdivisions of the major physiographicprov<strong>in</strong>ces <strong>in</strong> <strong>Utah</strong>: <strong>Utah</strong> Geology, v. 4, no. 1, p. 1-17.Taylor, G.H., and Leggette, R.H., 1949, Ground water <strong>in</strong> Jordan<strong>Valley</strong>, <strong>Utah</strong>: U.S. Geological Survey Water SupplyPaper 1029, 357 p.Thiros, S.A., 1992, Selected hydrologic data for <strong>Salt</strong> <strong>Lake</strong><strong>Valley</strong>, <strong>Utah</strong>, 1990-92, with emphasis on data from theshallow unconf<strong>in</strong>ed aquifer and conf<strong>in</strong><strong>in</strong>g layers: U.S.Geological Survey Open-File Report 92-640, duplicatedas <strong>Utah</strong> Hydrologic-Data Report No. 49, 44 p.Thiros, S.A., 1995, Chemical composition of ground water,hydrologic properties of bas<strong>in</strong>-fill material, and groundwatermovement <strong>in</strong> <strong>Salt</strong> <strong>Lake</strong> <strong>Valley</strong>, <strong>Utah</strong>: <strong>Utah</strong> Departmentof Natural Resources Technical Publication No.110-A, 59 p.Thiros, S.A., and Mann<strong>in</strong>g, A.H., 2004, Quality and sourcesof ground-water used for public supply <strong>in</strong> <strong>Salt</strong> <strong>Lake</strong> <strong>Valley</strong>,<strong>Salt</strong> <strong>Lake</strong> <strong>County</strong>, <strong>Utah</strong>: U.S. Geological Survey Water-ResourcesInvestigations Report 03-4325, 95 p.U.S. Army Corps of Eng<strong>in</strong>eers, 1987, Corps of eng<strong>in</strong>eers wetlandsdel<strong>in</strong>eation manual: Vicksburg, Mississippi, U.S.Army Corps of Eng<strong>in</strong>eers Waterways Experiment StationTechnical Report Y-87-1, 100 p.U.S. Environmental Protection Agency (U.S. EPA), 2003,Wetland functions and values: Onl<strong>in</strong>e, http://www.epa.gov/watertra<strong>in</strong>/wetlands/, accessed January 3, 2005.U.S. Fish and Wildlife Service, 1994, U.S. Fish and WildlifeService manual 660FW 1, wetlands policy and actionplan: Onl<strong>in</strong>e, http://www.fws.gov/policy/660fw1.html,accessed November 3, 2005.U.S. Fish and Wildlife Service, 2010, National wetlands <strong>in</strong>ventory:Onl<strong>in</strong>e, http://www.fws.gov/wetlands/Data/DataDownload.html,accessed April 5, 2010.U.S. Geological Survey, 2009, National Water InformationSystem: Web Interface, USGS 10010000 Great<strong>Salt</strong> <strong>Lake</strong> at <strong>Salt</strong>air Boat Harbor, UT, http://waterdata.usgs.gov/ut/nwis/uv/?site_no=10010000&PARAmeter_cd=00065,00060,00010,72020, accessed March 26,2009.<strong>Utah</strong> Division of Water Quality, 1998, Aquifer classificationguidance document: <strong>Salt</strong> <strong>Lake</strong> City, unpublished <strong>Utah</strong>Division of Water Quality report, 9 p.<strong>Utah</strong> Division of Water Resources, 2001, <strong>Utah</strong> state waterplan, West Desert bas<strong>in</strong>: <strong>Salt</strong> <strong>Lake</strong> City, <strong>Utah</strong> Division ofWater Resources report, variously pag<strong>in</strong>ated.<strong>Utah</strong> Division of Water Resources, 2007, Drought <strong>in</strong> <strong>Utah</strong>–learn<strong>in</strong>g from the past–prepar<strong>in</strong>g for the future: <strong>Salt</strong> <strong>Lake</strong>City, unpublished <strong>Utah</strong> Division of Water Resources report,124 p.<strong>Utah</strong> Division of Water Rights, 2008a, F<strong>in</strong>al <strong>Salt</strong> <strong>Lake</strong> <strong>Valley</strong>ground-water management plan: Onl<strong>in</strong>e, http://nrwrt1.nr.state.ut.us/wr<strong>in</strong>fo/mmplan/ugw/slv/slvmgpln.pdf, accessedJune 12, 2008.<strong>Utah</strong> Division of Water Rights, 2008b, 1991 <strong>in</strong>terim plan: Onl<strong>in</strong>e,http://nrwrt1.nr.state.ut.us/wr<strong>in</strong>fo/mmplan/ugw/slv/slv_1991.pdf, accessed June 12, 2008.<strong>Utah</strong> Division of Wildlife Resources, 2006, Farm<strong>in</strong>gton BayWildlife Management Area: Onl<strong>in</strong>e, http://wildlife.utah.gov/habitat/farm<strong>in</strong>gton_bay.php, accessed March 21,2008.Waddell, K.M., Gerner, S.J., Thiros, S.A., Gidd<strong>in</strong>gs, E.M.,Basken, R.L., Cederberg, J.R., and Albano, C.M., 2004,Water quality <strong>in</strong> the Great <strong>Salt</strong> <strong>Lake</strong> bas<strong>in</strong>s, <strong>Utah</strong>, Idaho,and Wyom<strong>in</strong>g, 1998-2001: U.S. Geological Survey Circular1236, 36 p.Waddell, K.M., Seiler, R.L., Sant<strong>in</strong>i, M., and Solomon, D.K.,1987a, Ground-water conditions <strong>in</strong> <strong>Salt</strong> <strong>Lake</strong> <strong>Valley</strong>,<strong>Utah</strong>, 1969-83, and predicted effects of <strong>in</strong>creased withdrawalsfrom wells: <strong>Utah</strong> Department of Natural ResourcesTechnical Publication No. 87, 69 p.Waddell, K.M., Seiler, R.L., and Solomon, D.K., 1987b,Chemical quality of ground water <strong>in</strong> <strong>Salt</strong> <strong>Lake</strong> <strong>Valley</strong>,<strong>Utah</strong>, 1969-85: <strong>Utah</strong> Department of Natural ResourcesTechnical Publication No. 89, 44 p.Wallace J., and Lowe, M., 2009, Ground-water quality classificationfor the bas<strong>in</strong>-fill aquifer <strong>in</strong> <strong>Salt</strong> <strong>Lake</strong> <strong>Valley</strong>, <strong>Salt</strong><strong>Lake</strong> <strong>County</strong>, <strong>Utah</strong>: <strong>Utah</strong> Geological Survey Open-FileReport 560, 15 p., scale 1:75,000, CD-ROM.
26<strong>Utah</strong> Geological Survey
<strong>Wetlands</strong> <strong>in</strong> Northern <strong>Salt</strong> <strong>Lake</strong> <strong>Valley</strong>, <strong>Salt</strong> <strong>Lake</strong> <strong>County</strong>, <strong>Utah</strong>—an evaluation of the threats posed by ground-water developement and drought 27APPENDICES
<strong>Wetlands</strong> <strong>in</strong> Northern <strong>Salt</strong> <strong>Lake</strong> <strong>Valley</strong>, <strong>Salt</strong> <strong>Lake</strong> <strong>County</strong>, <strong>Utah</strong>—an evaluation of the threats posed by ground-water developement and drought 29APPENDIX AWETLANDS BACKGROUND, DEFINITIONS, AND FUNCTIONS
30<strong>Utah</strong> Geological SurveyWETLANDS BACKGROUND, DEFINITIONS, AND FUNCTIONSThe material <strong>in</strong> this appendix is from Burk and others (2005). Wetland scientists have had a tremendous amount of difficultydef<strong>in</strong><strong>in</strong>g a wetland because wetlands can be very different from place to place. Due to this variability, scientists have madenumerous attempts at deriv<strong>in</strong>g an all-encompass<strong>in</strong>g def<strong>in</strong>ition of a wetland. <strong>Wetlands</strong> are generally def<strong>in</strong>ed as transitional landsbetween terrestrial and aquatic ecosystems. Three criteria are used to def<strong>in</strong>e a wetland: hydrology, soil, and vegetation. To beclassified as a wetland, an area must have specific characteristics related to one or more of these criteria.The two <strong>in</strong>terest groups that require a def<strong>in</strong>ition for wetlands are wetland scientists and wetland managers and regulators. <strong>Wetlands</strong>cientists are <strong>in</strong>terested <strong>in</strong> a def<strong>in</strong>ition that facilitates classification, <strong>in</strong>ventory, and research of wetlands, whereas wetlandmanagers are <strong>in</strong>terested <strong>in</strong> the laws and regulations surround<strong>in</strong>g wetlands. The most widely accepted scientific def<strong>in</strong>ition,developed by the U.S. Fish and Wildlife Service as part of the National <strong>Wetlands</strong> Inventory, states: “<strong>Wetlands</strong> are lands transitionalbetween terrestrial and aquatic systems where the water table is usually at or near the surface or the land is covered byshallow water… <strong>Wetlands</strong> must have one or more of the follow<strong>in</strong>g three attributes: (1) at least periodically, the land supportspredom<strong>in</strong>antly hydrophytes; (2) the substrate is predom<strong>in</strong>antly undra<strong>in</strong>ed hydric soil; and (3) the substrate is nonsoil and issaturated with water or covered by shallow water at some time dur<strong>in</strong>g the grow<strong>in</strong>g season of each year” (Coward<strong>in</strong> and others,1979).The two entities that deal with the laws and regulations on wetlands are the U.S. Environmental Protection Agency (EPA) andthe U.S. Army Corps of Eng<strong>in</strong>eers, which def<strong>in</strong>e wetlands as “those areas that are <strong>in</strong>undated or saturated by surface or groundwater at a frequency and duration sufficient to support, and that under normal circumstances do support, a prevalence of vegetationtypically adapted for life <strong>in</strong> saturated soil conditions. <strong>Wetlands</strong> generally <strong>in</strong>clude swamps, marshes, bogs, and similarareas” (U.S. Army Corps of Eng<strong>in</strong>eers, 1987, p. 9). The U.S. Army Corps of Eng<strong>in</strong>eers oversees the regulatory aspect of wetlands,specifically <strong>in</strong> relation to the Clean Water Act, so they are the agency <strong>in</strong> charge of enforc<strong>in</strong>g the “no net loss” policy ofthe federal government.The presence of water at or near the surface <strong>in</strong> a wetland is obvious, but water need not be there all the time <strong>in</strong> a wetland. Manywetlands are “wet” only dur<strong>in</strong>g certa<strong>in</strong> periods of the year. The presence of water is nonetheless a critical part of a wetland, and<strong>in</strong>fluences the soil and vegetation <strong>in</strong> a wetland. The type of soil <strong>in</strong> a wetland is termed hydric. “A hydric soil is a soil that issaturated, flooded, or ponded long enough dur<strong>in</strong>g the grow<strong>in</strong>g season to develop anaerobic conditions that favor the growth andregeneration of hydrophytic vegetation” (Mitsch and Gossel<strong>in</strong>k, 2000, p. 756). The term hydrophytic vegetation or hydrophyterefers to “water lov<strong>in</strong>g” plants, which are able to survive with little or no oxygen, and can withstand fluctuat<strong>in</strong>g water levels.Two types of hydrophytes exist: aquatic and emergent. Aquatic plants, such as the water lily, actually live <strong>in</strong> the water. Emergentplants have roots that grow <strong>in</strong> soil that is saturated with water, while the rest of the plant may be exposed to the atmosphere.Emergent plants <strong>in</strong>clude cattails, reeds, and sedges. The soil and vegetation <strong>in</strong> a wetland are very dependent upon water fortheir development and growth, illustrat<strong>in</strong>g that water is the master variable when it comes to wetlands.One of the most important functions of wetlands is their ability to improve water quality. This occurs by filtration of water asit flows through a wetland. Water that enters a wetland may be laden with pollutants, which can settle out of the water columndur<strong>in</strong>g transport. Toxic substances can be buried and trapped <strong>in</strong> bottom sediments. Plants and microorganisms can absorband consume the toxic substances and return them to the environment <strong>in</strong> benign forms. Many wastewater treatment plants useconstructed or modified wetlands to treat water before return<strong>in</strong>g it to the environment.Another benefit of wetlands is their ability to control flood<strong>in</strong>g and act as storage reservoirs. When floodwater encounters awetland, the force and velocity of the water is dissipated, so downstream damage is typically reduced. Additionally, as wetlandscapture floodwater, the water is stored <strong>in</strong> the wetlands and released slowly dur<strong>in</strong>g the follow<strong>in</strong>g months. This stored water canrecharge ground-water aquifers, which is very important for drought-stricken areas.<strong>Wetlands</strong> are also important habitat areas. They have high biodiversity and productivity that is comparable to ra<strong>in</strong> forestsand coral reefs (U.S. EPA, 2003). <strong>Wetlands</strong> are important to many plant and animal species; about 45 percent of the specieslisted as threatened or endangered under the Endangered Species Act use wetland habitat (National Wildlife Federation, 1989).<strong>Wetlands</strong> offer habitat for plants, <strong>in</strong>sects, fish, amphibians, reptiles, mammals, and birds, creat<strong>in</strong>g a self-susta<strong>in</strong><strong>in</strong>g food web.Animals use wetlands as a source for food, as nest<strong>in</strong>g grounds, and as nurseries.
32<strong>Utah</strong> Geological SurveyTable B1. Coward<strong>in</strong> classification scheme for <strong>Salt</strong> <strong>Lake</strong> <strong>County</strong> wetlands.
<strong>Wetlands</strong> <strong>in</strong> Northern <strong>Salt</strong> <strong>Lake</strong> <strong>Valley</strong>, <strong>Salt</strong> <strong>Lake</strong> <strong>County</strong>, <strong>Utah</strong>—an evaluation of the threats posed by ground-water developement and drought 33Table B1. cont<strong>in</strong>ued
34<strong>Utah</strong> Geological Survey
<strong>Wetlands</strong> <strong>in</strong> Northern <strong>Salt</strong> <strong>Lake</strong> <strong>Valley</strong>, <strong>Salt</strong> <strong>Lake</strong> <strong>County</strong>, <strong>Utah</strong>—an evaluation of the threats posed by ground-water developement and drought 35APPENDIX CWATER-QUALITY DATA
Table C.1 Water-quality data.36Table C1. Water-quality data.Bariudissol(μg/LArsenic,dissolved(μg/L)Alum<strong>in</strong>um,dissolved(μg/L)pH,fieldSite ID* Location Sample Date pH, labLab, SpecificConductance(μmhos)Field, SpecificConductance(μS/cm)FieldTemperature,(°C)Solids, sum ofconstituents,dissolved(mg/L)NitrogenNO2 + NO3dissolved(mg/L)Ground-waterElevation (ftabove sealevel)WellDepth(feet)1 Rudy Gun Club 4 4210.7 5/20/2008 - - - - - - - - - -2 <strong>Salt</strong> <strong>Lake</strong> International Airport 5 4213.8 5/20/2008 12,000 8.66 9.27 296.0 66.4
<strong>Wetlands</strong> <strong>in</strong> Northern <strong>Salt</strong> <strong>Lake</strong> <strong>Valley</strong>, <strong>Salt</strong> <strong>Lake</strong> <strong>County</strong>, <strong>Utah</strong>—an evaluation of the threats posed by ground-water developement and drought 37Table C1. cont<strong>in</strong>uedAlum<strong>in</strong>um,dissolved(μg/L)Arsenic,dissolved(μg/L)Barium,dissolved(μg/L)Bicarbonate(mg/L)Boron(μg/L)Cadmium,dissolved(μg/L)Calcium,dissolved(mg/L)Carbondioxide(mg/L)Carbonate(mg/L)Chloride(mg/L)Chromium,dissolved(μg/L)- - - - - - - - - - -296.0 66.4
38<strong>Utah</strong> Geological SurveyFarm<strong>in</strong>gtonBay <strong>Wetlands</strong>420094203.1JordanRiverUTAH<strong>Salt</strong> <strong>Lake</strong><strong>County</strong>Cryst alCreek<strong>Salt</strong> <strong>Lake</strong> City Sewage Canal84207.4Study Area420574209.4421014210.7North Po<strong>in</strong>t Consolidated Canal24213.86