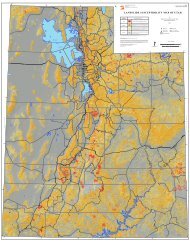
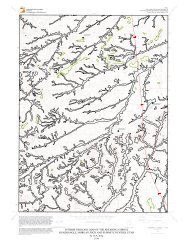
<strong>Wetlands</strong> <strong>in</strong> Northern <strong>Salt</strong> <strong>Lake</strong> <strong>Valley</strong>, <strong>Salt</strong> <strong>Lake</strong> <strong>County</strong>, <strong>Utah</strong>—an evaluation of the threats posed by ground-water developement and drought 5MethodsWe <strong>in</strong>stalled 12 shallow monitor<strong>in</strong>g wells <strong>in</strong> three wetlandareas near Great <strong>Salt</strong> <strong>Lake</strong> (figure 1 and appendix C). Twowells were sampled for water quality, and ground-water depthwas measured <strong>in</strong> n<strong>in</strong>e of the wells (three wells did not yieldwater). The wells were manually <strong>in</strong>stalled us<strong>in</strong>g a hand augerto bore a hole <strong>in</strong>to the ground to a depth of 3 to 7 feet (1–2 m),and then <strong>in</strong>sert<strong>in</strong>g one-<strong>in</strong>ch-diameter slotted PVC and backfill<strong>in</strong>gthe void between the borehole and PVC with the handaugercutt<strong>in</strong>gs. We mapped the well locations us<strong>in</strong>g a TrimbleTotal Station GPS system hav<strong>in</strong>g sub-centimeter vertical andhorizontal accuracy. Water levels <strong>in</strong> the wells were measuredmanually dur<strong>in</strong>g the spr<strong>in</strong>g and summer of 2008. The two water-qualitymonitor<strong>in</strong>g wells were sampled <strong>in</strong> May 2008, andthe samples were analyzed at the <strong>Utah</strong> Division of Epidemiologyand Laboratory Services for general chemistry, dissolvedmetals, nutrients, and total organic carbon. Computer model<strong>in</strong>gwas conducted dur<strong>in</strong>g 2007 and 2008.Previous StudiesRichardson (1906) conducted the first <strong>in</strong>vestigation of groundwaterconditions <strong>in</strong> <strong>Salt</strong> <strong>Lake</strong> <strong>Valley</strong> (previously known asJordan <strong>Valley</strong>); that study, which <strong>in</strong>cluded <strong>Utah</strong> <strong>Valley</strong>, producedmaps show<strong>in</strong>g depth to ground water and areas offlow<strong>in</strong>g wells. Taylor and Leggette (1949) conducted a morethorough <strong>in</strong>vestigation that <strong>in</strong>cluded many well records, anddiscussions of ground-water occurrence, recharge and discharge,and chemical quality. Lofgren (1952) discussed thestatus of ground-water development <strong>in</strong> <strong>Salt</strong> <strong>Lake</strong> <strong>Valley</strong> as of1951. Marsell (1964) discussed water-supply issues as part ofa comprehensive review of the geology of <strong>Salt</strong> <strong>Lake</strong> <strong>County</strong>.Mar<strong>in</strong>e and Price (1964) updated previous studies and subdividedthe valley <strong>in</strong>to ground-water districts for water-resourcemanagement purposes. Hely and others (1967, 1968, 1969)compiled hydrologic and climatalogic data that were used toproduce a summary of ground-water hydrology <strong>in</strong> <strong>Salt</strong> <strong>Lake</strong><strong>Valley</strong> (Mower, 1969a) and water resources <strong>in</strong> <strong>Salt</strong> <strong>Lake</strong><strong>County</strong> (Hely and others, 1971). Arnow and Mattick (1968)evaluated the thickness of bas<strong>in</strong>-fill deposits. Mower (1968)discussed ground-water discharge toward Great <strong>Salt</strong> <strong>Lake</strong> <strong>in</strong>bas<strong>in</strong>-fill deposits. Mower (1969b) discussed ground-water<strong>in</strong>flow through channel fill <strong>in</strong> seven Wasatch Range canyons<strong>in</strong> <strong>Salt</strong> <strong>Lake</strong> <strong>County</strong>. Arnow and others (1970) used waterwelllogs to del<strong>in</strong>eate the pre-Quaternary surface <strong>in</strong> <strong>Salt</strong> <strong>Lake</strong><strong>Valley</strong> to be used as a general guide for water-well drill<strong>in</strong>g.Mower (1970) discussed ground-water recharge to <strong>Salt</strong> <strong>Lake</strong><strong>Valley</strong> from <strong>Utah</strong> <strong>Valley</strong>. Seiler and Waddell (1984) conductedan assessment of the shallow unconf<strong>in</strong>ed aquifer <strong>in</strong> <strong>Salt</strong><strong>Lake</strong> <strong>Valley</strong>. Herbert and others (1985) conducted a seepagestudy of six canals <strong>in</strong> <strong>Salt</strong> <strong>Lake</strong> <strong>County</strong>. Waddell and others(1987b) evaluated the chemical quality of ground water <strong>in</strong>the bas<strong>in</strong>-fill aquifer for the 1969–85 time period. Waddelland others (1987a) evaluated ground-water conditions <strong>in</strong> <strong>Salt</strong><strong>Lake</strong> <strong>Valley</strong> with emphasis on predicted effects of <strong>in</strong>creasedwithdrawals from wells. Thiros (1992) compiled selected hydrologicdata for <strong>Salt</strong> <strong>Lake</strong> <strong>Valley</strong> with emphasis on data fromthe shallow unconf<strong>in</strong>ed aquifer and conf<strong>in</strong><strong>in</strong>g layers. Andersonand others (1994; see also Anderson and Susong, 1995)mapped ground-water recharge and discharge areas for thepr<strong>in</strong>cipal aquifers along the Wasatch Front, <strong>in</strong>clud<strong>in</strong>g the pr<strong>in</strong>cipalaquifer <strong>in</strong> <strong>Salt</strong> <strong>Lake</strong> <strong>Valley</strong>. Thiros (1995) <strong>in</strong>vestigatedthe chemical composition and movement of ground water, andthe hydrologic properties of bas<strong>in</strong>-fill material, to better understandthe flow system <strong>in</strong> <strong>Salt</strong> <strong>Lake</strong> <strong>Valley</strong>. Lambert (1995a)produced a three-dimensional, f<strong>in</strong>ite-difference, numericalground-water flow model for the bas<strong>in</strong>-fill aquifer, which he(Lambert, 1995b) subsequently used to produce capture zonesfor selected public supply wells and simulate (Lambert, 1996)the movement of sulfate <strong>in</strong> ground water. Waddell and others(2004) assessed water quality <strong>in</strong> the Great <strong>Salt</strong> <strong>Lake</strong> bas<strong>in</strong>s, <strong>in</strong>clud<strong>in</strong>g<strong>Salt</strong> <strong>Lake</strong> <strong>Valley</strong>. Burden and others (2005) describedchanges <strong>in</strong> ground-water conditions <strong>in</strong> <strong>Utah</strong>, <strong>in</strong>clud<strong>in</strong>g <strong>Salt</strong><strong>Lake</strong> <strong>Valley</strong>, from 1975 to 2005. Lowe and others (2005) andLowe and Wallace (2006) mapped ground-water sensitivityand vulnerability to pesticides for the <strong>Salt</strong> <strong>Lake</strong> <strong>Valley</strong> bas<strong>in</strong>fillaquifer. Wallace and Lowe (2009) mapped ground-waterquality classes for the <strong>Salt</strong> <strong>Lake</strong> <strong>Valley</strong> bas<strong>in</strong>-fill aquifer.SETTINGPhysiography<strong>Salt</strong> <strong>Lake</strong> <strong>Valley</strong> is a north-south-trend<strong>in</strong>g valley located <strong>in</strong>north-central <strong>Utah</strong> southeast of Great <strong>Salt</strong> <strong>Lake</strong>. <strong>Salt</strong> <strong>Lake</strong><strong>Valley</strong> is <strong>in</strong> the <strong>Salt</strong> <strong>Lake</strong> <strong>Valley</strong> segment of the Wasatch Front<strong>Valley</strong>s section of the Great Bas<strong>in</strong> physiographic prov<strong>in</strong>ce(Stokes, 1977). The valley is bounded on the east and northeastby the central portion of the Wasatch Range, on the northwestby Great <strong>Salt</strong> <strong>Lake</strong>, on the west by the Oquirrh Mounta<strong>in</strong>s,and on the south by the Traverse Mounta<strong>in</strong>s. Elevationsrange from about 4200 feet (1280 m) <strong>in</strong> the lowest part of thevalley near Great <strong>Salt</strong> <strong>Lake</strong> to more than 7000 feet (2130 m)<strong>in</strong> the Traverse Mounta<strong>in</strong>s, 9000 feet (2740 m) <strong>in</strong> the OquirrhMounta<strong>in</strong>s, and 11,000 feet (3350 m) <strong>in</strong> the Wasatch Range.<strong>Salt</strong> <strong>Lake</strong> <strong>Valley</strong> has also been referred to as Jordan <strong>Valley</strong> becauseof the Jordan River, which flows northward <strong>in</strong>to the valleythrough the Jordan Narrows, a water gap <strong>in</strong> the TraverseMounta<strong>in</strong>s, and ultimately <strong>in</strong>to Great <strong>Salt</strong> <strong>Lake</strong>. Six othermajor streams flow <strong>in</strong>to the valley from the Wasatch Rangeto the east and <strong>in</strong>to the Jordan River; these streams are ma<strong>in</strong>lyfed by snowmelt dur<strong>in</strong>g the spr<strong>in</strong>g and early summer. M<strong>in</strong>oramounts of water enter the valley from the Oquirrh Mounta<strong>in</strong>s.The mounta<strong>in</strong>s that surround <strong>Salt</strong> <strong>Lake</strong> <strong>Valley</strong> are composedof rocks that range <strong>in</strong> age from Precambrian to Tertiary. TheWasatch Range consists of Precambrian, Paleozoic, Mesozoic,and Cenozoic sedimentary and metasedimentary rocks thathave been <strong>in</strong>truded by Tertiary granitic and dioritic stocks.
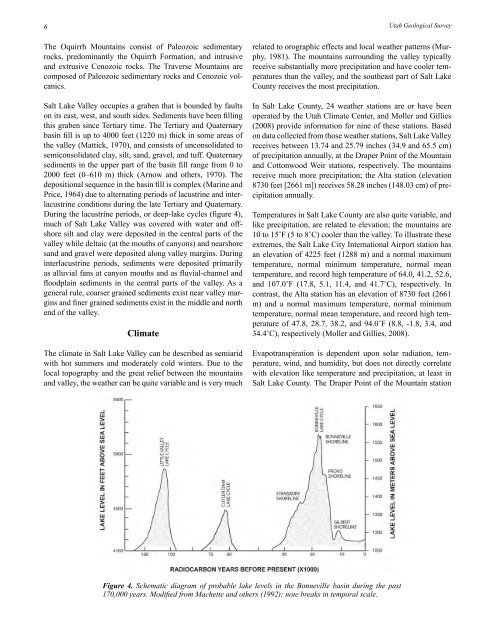
6The Oquirrh Mounta<strong>in</strong>s consist of Paleozoic sedimentaryrocks, predom<strong>in</strong>antly the Oquirrh Formation, and <strong>in</strong>trusiveand extrusive Cenozoic rocks. The Traverse Mounta<strong>in</strong>s arecomposed of Paleozoic sedimentary rocks and Cenozoic volcanics.<strong>Salt</strong> <strong>Lake</strong> <strong>Valley</strong> occupies a graben that is bounded by faultson its east, west, and south sides. Sediments have been fill<strong>in</strong>gthis graben s<strong>in</strong>ce Tertiary time. The Tertiary and Quaternarybas<strong>in</strong> fill is up to 4000 feet (1220 m) thick <strong>in</strong> some areas ofthe valley (Mattick, 1970), and consists of unconsolidated tosemiconsolidated clay, silt, sand, gravel, and tuff. Quaternarysediments <strong>in</strong> the upper part of the bas<strong>in</strong> fill range from 0 to2000 feet (0–610 m) thick (Arnow and others, 1970). Thedepositional sequence <strong>in</strong> the bas<strong>in</strong> fill is complex (Mar<strong>in</strong>e andPrice, 1964) due to alternat<strong>in</strong>g periods of lacustr<strong>in</strong>e and <strong>in</strong>terlacustr<strong>in</strong>econditions dur<strong>in</strong>g the late Tertiary and Quaternary.Dur<strong>in</strong>g the lacustr<strong>in</strong>e periods, or deep-lake cycles (figure 4),much of <strong>Salt</strong> <strong>Lake</strong> <strong>Valley</strong> was covered with water and offshoresilt and clay were deposited <strong>in</strong> the central parts of thevalley while deltaic (at the mouths of canyons) and nearshoresand and gravel were deposited along valley marg<strong>in</strong>s. Dur<strong>in</strong>g<strong>in</strong>terlacustr<strong>in</strong>e periods, sediments were deposited primarilyas alluvial fans at canyon mouths and as fluvial-channel andfloodpla<strong>in</strong> sediments <strong>in</strong> the central parts of the valley. As ageneral rule, coarser gra<strong>in</strong>ed sediments exist near valley marg<strong>in</strong>sand f<strong>in</strong>er gra<strong>in</strong>ed sediments exist <strong>in</strong> the middle and northend of the valley.ClimateThe climate <strong>in</strong> <strong>Salt</strong> <strong>Lake</strong> <strong>Valley</strong> can be described as semiaridwith hot summers and moderately cold w<strong>in</strong>ters. Due to thelocal topography and the great relief between the mounta<strong>in</strong>sand valley, the weather can be quite variable and is very much<strong>Utah</strong> Geological Surveyrelated to orographic effects and local weather patterns (Murphy,1981). The mounta<strong>in</strong>s surround<strong>in</strong>g the valley typicallyreceive substantially more precipitation and have cooler temperaturesthan the valley, and the southeast part of <strong>Salt</strong> <strong>Lake</strong><strong>County</strong> receives the most precipitation.In <strong>Salt</strong> <strong>Lake</strong> <strong>County</strong>, 24 weather stations are or have beenoperated by the <strong>Utah</strong> Climate Center, and Moller and Gillies(2008) provide <strong>in</strong>formation for n<strong>in</strong>e of these stations. Basedon data collected from those weather stations, <strong>Salt</strong> <strong>Lake</strong> <strong>Valley</strong>receives between 13.74 and 25.79 <strong>in</strong>ches (34.9 and 65.5 cm)of precipitation annually, at the Draper Po<strong>in</strong>t of the Mounta<strong>in</strong>and Cottonwood Weir stations, respectively. The mounta<strong>in</strong>sreceive much more precipitation; the Alta station (elevation8730 feet [2661 m]) receives 58.28 <strong>in</strong>ches (148.03 cm) of precipitationannually.Temperatures <strong>in</strong> <strong>Salt</strong> <strong>Lake</strong> <strong>County</strong> are also quite variable, andlike precipitation, are related to elevation; the mounta<strong>in</strong>s are10 to 15˚F (5 to 8˚C) cooler than the valley. To illustrate theseextremes, the <strong>Salt</strong> <strong>Lake</strong> City International Airport station hasan elevation of 4225 feet (1288 m) and a normal maximumtemperature, normal m<strong>in</strong>imum temperature, normal meantemperature, and record high temperature of 64.0, 41.2, 52.6,and 107.0˚F (17.8, 5.1, 11.4, and 41.7˚C), respectively. Incontrast, the Alta station has an elevation of 8730 feet (2661m) and a normal maximum temperature, normal m<strong>in</strong>imumtemperature, normal mean temperature, and record high temperatureof 47.8, 28.7, 38.2, and 94.0˚F (8.8, -1.8, 3.4, and34.4˚C), respectively (Moller and Gillies, 2008).Evapotranspiration is dependent upon solar radiation, temperature,w<strong>in</strong>d, and humidity, but does not directly correlatewith elevation like temperature and precipitation, at least <strong>in</strong><strong>Salt</strong> <strong>Lake</strong> <strong>County</strong>. The Draper Po<strong>in</strong>t of the Mounta<strong>in</strong> stationFigure 4. Schematic diagram of probable lake levels <strong>in</strong> the Bonneville bas<strong>in</strong> dur<strong>in</strong>g the past170,000 years. Modified from Machette and others (1992); note breaks <strong>in</strong> temporal scale.