Co-authorship network of scientometrics research collaboration - E-LIS
Co-authorship network of scientometrics research collaboration - E-LIS
Co-authorship network of scientometrics research collaboration - E-LIS
- No tags were found...

Create successful ePaper yourself
Turn your PDF publications into a flip-book with our unique Google optimized e-Paper software.
Erfanmanesh, M.; Rohani, V.A. & Abrizah, A.community from a social <strong>network</strong> perspective. Katz and Martin (1997) summarized someadvantages for utilizing co-<strong>authorship</strong> data to measure formal <strong>research</strong> <strong>collaboration</strong>:verifiability, stability over time, unobtrusiveness and ease <strong>of</strong> measurement. Moreover, theco-<strong>authorship</strong> <strong>of</strong> papers creates a <strong>network</strong> which can be visualized and studied in order tounderstand the characteristics <strong>of</strong> the whole <strong>network</strong> as well as individual properties <strong>of</strong><strong>network</strong> actors. In the <strong>research</strong> field <strong>of</strong> complex <strong>network</strong>s and bibliometrics, <strong>collaboration</strong><strong>network</strong> analysis represents an important area <strong>of</strong> study. <strong>Co</strong>-<strong>authorship</strong> <strong>network</strong>s are social<strong>network</strong>s constructed by connecting actors if they have co-authored together. Social<strong>network</strong> analysis has been used in a variety <strong>of</strong> ways to examine various aspects <strong>of</strong> co<strong>authorship</strong><strong>network</strong>s, for instance, the performance <strong>of</strong> individuals in a <strong>collaboration</strong><strong>network</strong> (Morrison Dobbie and McDonald 2003), the <strong>collaboration</strong> <strong>network</strong> <strong>of</strong> institutions(Wang et al. 2008; Katerndahl 2012) and co-<strong>authorship</strong> <strong>network</strong> <strong>of</strong> countries (Haiqi andHong 1997; De Stefano Vitale and Zaccarine 2010; Yu Shao and Duan 2012). These analysisalso have been conducted in a number <strong>of</strong> fields, such as tourism and hospitality(Benckendorff 2010; Racherla and Hu 2010; Ye Li and Law 2011), medicine (Gonzalez-Alcaide et al. 2012; Yu Shao and Duan 2012), health care (Godley Baron and Sharma 2011),energy (Monteiro et al. 2009; Sakata Sasaki and Inoue 2011), library and informationscience (Pluzhenskaia 2007; Yan Ding and Zhu 2010), computer science and informationsystems (Xu and Chau 2006; Cheong and <strong>Co</strong>rbitt 2009; Takeda 2010; Bazzan and Argenta2011), sociology (Moody 2004) and economics (Krichel and Bakkalbasi 2006).A few studies have investigated social <strong>network</strong> measures in the area <strong>of</strong> <strong>scientometrics</strong>.Hou, Kretschmer and Liu (2008) studied the structure <strong>of</strong> scientific <strong>collaboration</strong> <strong>network</strong> atmicro level by using data <strong>of</strong> all paper published in the journal Scientometrics during 1978 to2004. Guns, Liu and Mahbuba (2010) measured the <strong>research</strong> <strong>collaboration</strong> in the fields <strong>of</strong>informetrics, bibliometrics, webometrics and <strong>scientometrics</strong> during the period 1990-2009,and found a relatively low degree <strong>of</strong> international <strong>collaboration</strong>. Their study <strong>of</strong> individualperformance <strong>of</strong> authors showed that only a few <strong>of</strong> these <strong>research</strong>ers have the highestglobal Q-measures, suggesting that they were extensively involved in relationship withother authors. In another study, Yan, Ding and Zhu (2010) visualized library andinformation science (<strong>LIS</strong>) <strong>collaboration</strong> <strong>network</strong> in China using both macro and micro levelmeasures. Results <strong>of</strong> the study revealed a small-world <strong>network</strong> that follows the scale-freecharacter. The <strong>research</strong>ers also conducted correlation analysis between citation countsand centrality values (measures), and discovered that they are highly correlated. Chen,Fang and Borner (2011) studied the development <strong>of</strong> the journal Scientometrics from 2002to 2008 and mapped the distribution and <strong>collaboration</strong> <strong>network</strong> <strong>of</strong> countries as well as topinstitutions. They analyzed the co-author <strong>network</strong> to map the <strong>collaboration</strong> amongdifferent authors. They also mapped the co-citation <strong>network</strong> <strong>of</strong> papers to show the majortopics that affected the development <strong>of</strong> this journal.Although a few previous studies have attempted to analyze co-<strong>authorship</strong> <strong>network</strong> <strong>of</strong>scientometricians using social <strong>network</strong> analysis, these studies were limited in their samplesize, time span, targeted regions and the studied metrics. Therefore, intensive andcomprehensive studies are required to understand the characteristics and structure <strong>of</strong> co<strong>authorship</strong><strong>network</strong>s in <strong>scientometrics</strong> <strong>research</strong>. This study will use social <strong>network</strong> analysis(SNA) to depict scientific <strong>collaboration</strong> among scientometricians based on the 3125 paperspublished in the journal Scientometrics from January 1980 to February 2012.Page | 74
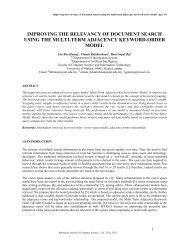
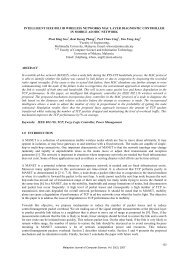
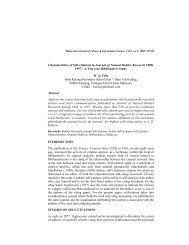
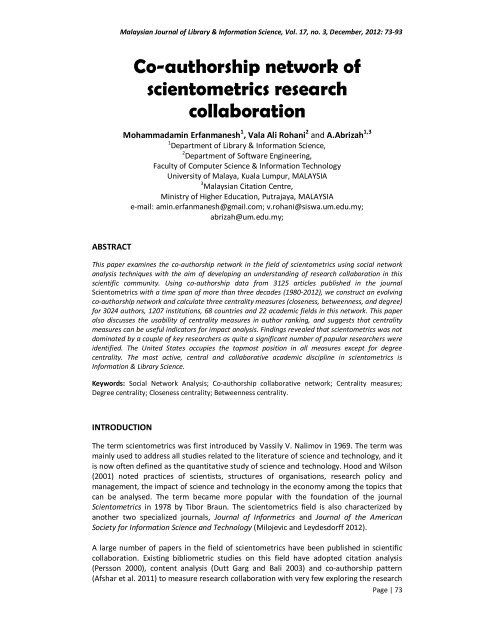
<strong>Co</strong>-<strong>authorship</strong> Network <strong>of</strong> Scientometrics Research <strong>Co</strong>llaborationOBJECTIVES AND METHODThe journal Scientometrics has been chosen as the data source to reveal the <strong>scientometrics</strong><strong>collaboration</strong> <strong>network</strong> for the same reason given by Chen, Fang and Borner (2011) i.e. thejournal Scientometrics is the flagship journal in the field <strong>of</strong> <strong>scientometrics</strong>. The study isstructured around the following specific <strong>research</strong> objectives:a) to visualize and study the <strong>scientometrics</strong> co-<strong>authorship</strong> <strong>network</strong>s <strong>of</strong> authors;b) to visualize and study the <strong>scientometrics</strong> co-<strong>authorship</strong> <strong>network</strong>s <strong>of</strong> institutions;c) to visualize and study the <strong>scientometrics</strong> co-<strong>authorship</strong> <strong>network</strong>s <strong>of</strong> countries; andd) to visualize and study the <strong>scientometrics</strong> co-<strong>authorship</strong> <strong>network</strong>s by academicfields.The study has been conducted in three consecutive phases: data elicitation, verificationand conversion, and social <strong>network</strong> analysis (SNA). First, bibliometric data were retrievedfrom the Thomson-Reuters’ Web <strong>of</strong> Science® (WoS) database. The data contained alldocument types published in the journal Scientometrics during the examined years.Records from this database were imported through EndNote programme. Some relateddata which could not be imported directly (such as discipline and country) were manuallyentered into an Informatics Data Analysis Portal (Figure 1) specifically developed for thisstudy. Author information that could not be ascertained from WoS was identified fromother sources such as Google Scholar and other World Wide Web resources. Variant names<strong>of</strong> authors as well as their institutions were also verified. During the studied period, therewere 3125 articles published in the journal Scientometrics by 3024 unique authors. Dataverification showed that a total <strong>of</strong> 110 authors published their papers under variantnames. Also, 123 inconsistent university names were edited to collate all papers.Figure 1: Authors Management Page in the Informatics Data Analysis PortalPage | 75
Erfanmanesh, M.; Rohani, V.A. & Abrizah, A.After data verification, a total <strong>of</strong> 3024 authors affiliated to 6589 institutional addresses <strong>of</strong>1189 parent organisations from 68 countries were identified. These datasets wereconverted into a recognized format <strong>of</strong> input files to be ready for SNA using UCINETapplication s<strong>of</strong>tware. A C# application was developed to convert the required datasets. Theco-<strong>authorship</strong> data among authors, countries, institutions and academic fields wereretrieved from the portal’s database for the development <strong>of</strong> the co-<strong>authorship</strong> graphs. TheSNA approach was carried out to describe co-<strong>authorship</strong> <strong>network</strong>s in the journalScientometrics on macro and micro-levels. Macro-level metrics concentrates on thetopology features <strong>of</strong> a <strong>network</strong> as a whole with the aim to capture the overall structure <strong>of</strong>a <strong>network</strong>; while micro-level metrics focuses on the evaluation <strong>of</strong> individual actors with theaim to capture the features <strong>of</strong> each actor in a <strong>network</strong> (Yan Ding and Zhu 2010).This study focuses on four macro-level features <strong>of</strong> the <strong>network</strong>: density, component, meandistance and clustering coefficient which are defined as follows:Density: Network density is defined as the number <strong>of</strong> links in a <strong>network</strong>, expressed as aproportion <strong>of</strong> the maximum possible links. It is calculated as the number <strong>of</strong> links ,L, dividedby the n(n-1) total possible links, with n being the total number <strong>of</strong> vertices in the <strong>network</strong>(Racherla and Hu 2010).<strong>Co</strong>mponent: A component is a set <strong>of</strong> vertices that can be reached by paths running alonglinks <strong>of</strong> the <strong>network</strong> (Cheong and <strong>Co</strong>rbit 2009).Mean distance: Mean distance is the mean length <strong>of</strong> the shortest path between twovertices in a <strong>network</strong> (Yan Ding and Zhu 2010).Clustering coefficient: Clustering coefficient is measures <strong>of</strong> the likelihood that twoassociates <strong>of</strong> a node are associate themselves (De Stefano Vitale and Zaccarin 2010). Theclustering coefficient <strong>of</strong> a <strong>network</strong>, C, is computed by the following formula:We also apply three centrality measures (degree centrality, closeness centrality andbetweenness centrality) to identify key vertices. The definitions and calculations used forthe three micro-level measures are as follows:Degree centrality: The degree centrality is defined as the number <strong>of</strong> an actor’s linksdivided by the maximum possible number. The normalized degree centrality d i <strong>of</strong> vertex i isgiven aswhere a ij indicates the existence or non-existence <strong>of</strong> a link between vertex i and vertex j,and n represents the number <strong>of</strong> vertices. If there is any link between vertex i and vertex j,a ij = 1. If there is no link, a ij = 0 (Chung and Hossain 2009). In this way, degree centrality is ahighly effective measure to determine the influence and importance <strong>of</strong> a vertex(Benckendorff 2010).Page | 76
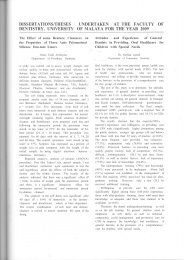
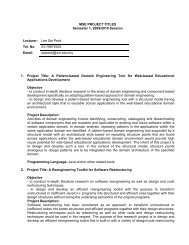
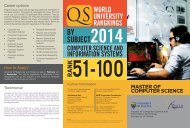
<strong>Co</strong>-<strong>authorship</strong> Network <strong>of</strong> Scientometrics Research <strong>Co</strong>llaborationCloseness centrality: Closeness centrality is the vertex’s average geodesic distance fromevery other vertex in the <strong>network</strong> (Boyd and Ellison 2007). More precisely, the normalizedcloseness centrality c i <strong>of</strong> vertex i is defined aswhere n is the number <strong>of</strong> vertices and e ij is the number <strong>of</strong> links in the shortest path fromvertex i to vertex j. Closeness is an inverse measure <strong>of</strong> centrality in that a large valueindicates a less central vertex, while a small value indicates a central vertex (Prell 2011).Betweenness centrality: Betweenness centrality is an indicator <strong>of</strong> an actor’s potentialcontrol <strong>of</strong> communication within the <strong>network</strong>. Betweenness centrality is defined as theratio <strong>of</strong> the number <strong>of</strong> shortest paths (between all pairs <strong>of</strong> vertices) that pass through agiven vertex divided by the total number <strong>of</strong> shortest paths. The normalized betweennesscentrality b i <strong>of</strong> vertex i is given asWhere n is the number <strong>of</strong> vertices, g jk is the number <strong>of</strong> shortest paths from vertex j tovertex k, and g jik is the number <strong>of</strong> shortest paths from vertex j to vertex k that pass throughvertex i (Prell 2011).RESULTS AND DISCUSSIONScientometrics <strong>Co</strong>-<strong>authorship</strong> Network <strong>of</strong> AuthorsFirst the co-<strong>authorship</strong> <strong>network</strong> <strong>of</strong> authors in <strong>scientometrics</strong> field at the macro and microlevelswas analysed. The co-<strong>authorship</strong> <strong>network</strong> <strong>of</strong> authors consists <strong>of</strong> vertices and links:vertices represent authors, while links connect vertices in the form <strong>of</strong> co-<strong>authorship</strong>s.There is a link between two vertices if they have co-authored at least one paper. The size<strong>of</strong> a vertex is proportional to the number <strong>of</strong> co-<strong>authorship</strong>s that a given author has in the<strong>network</strong>. Additionally, the size <strong>of</strong> the total <strong>network</strong> denotes simply by the number <strong>of</strong>unique actors or vertices (3024) with 6884 co-<strong>authorship</strong> links (Figure 2). The degree <strong>of</strong>connectedness <strong>of</strong> a <strong>network</strong> is given by the density measure, which is the proportion <strong>of</strong>actual linkages to possible linkages among actors (Godley Barron and Sharma 2011). Thedensity <strong>of</strong> the co-<strong>authorship</strong> <strong>network</strong> <strong>of</strong> authors in <strong>scientometrics</strong> field is 0.0005, whichindicates only 0.05% <strong>of</strong> all possible links being present. The social relationships in such lowdensity<strong>network</strong> tend to be large, open, diverse and externally focused relationships (Baker2000).Although low density indicates low overall cohesion <strong>of</strong> the <strong>network</strong>, it should also be notedthat the low density is inherent in large <strong>network</strong>s as it is inversely related to the <strong>network</strong>size. Similar to many other <strong>network</strong>s, the co-<strong>authorship</strong> <strong>network</strong> <strong>of</strong> authors in<strong>scientometrics</strong> field is composed <strong>of</strong> one large component (known as main, giant or corecomponent) and many small components. A component is a connected subset <strong>of</strong> a<strong>network</strong> in which there are direct or indirect links between all vertices (Krichel andBakkalbasi 2006). Newman (2004) found that the giant component occupied 82% to 92% <strong>of</strong>authors in different scientific disciplines. Additionally, Kretschmer (2004) suggested thatPage | 77
Erfanmanesh, M.; Rohani, V.A. & Abrizah, A.the largest component usually has a ratio <strong>of</strong> more than 40% <strong>of</strong> all authors. The co<strong>authorship</strong><strong>network</strong> <strong>of</strong> scientometricians consists <strong>of</strong> 1570 components, the largest <strong>of</strong> whichcontains 459 vertices, yielded a ratio <strong>of</strong> 15.17% <strong>of</strong> the whole <strong>network</strong>. This is significantlylarger than the second largest component, which contains only 18 vertices. The giantcomponent forms the core <strong>of</strong> productivity in the <strong>network</strong> because the most prolific authorsare usually located in this component; highly productive authors have an average, lowgeodesic distances and thus shorter paths to other authors compared with less productiveauthors. This component containing the authors clustered around the most active andcollaborative authors with the highest number <strong>of</strong> <strong>collaboration</strong>s such as Glanzel, Schubert,Rousseau, Braun and Debackere. Those vertices not belonging to the giant componenttypically form small isolated components. As can be seen in Figure 2, the main componentfills the center <strong>of</strong> the graph, while other smaller components fill the rest. In total, the co<strong>authorship</strong><strong>network</strong> <strong>of</strong> authors in <strong>scientometrics</strong> field comprised 1096 isolates, 226 dyads,84 triads, 36 quadruples and 127 components <strong>of</strong> between 5 to 18 vertices.Page | 78Figure 2: Scientometrics <strong>Co</strong>-<strong>authorship</strong> Network <strong>of</strong> AuthorsThe geodesic distance between two vertices is defined as the number <strong>of</strong> lines or steps onthe shortest path that connects them (Newman 2004). Short mean distance allow authorsto share information in the <strong>network</strong> more rapidly (Yan Ding and Zhu 2010). The UCINETcalculation results show that the mean geodesic distance between two vertices in the co<strong>authorship</strong><strong>network</strong> <strong>of</strong> authors in <strong>scientometrics</strong> field is 5.79, which means that in this<strong>network</strong>, only an average <strong>of</strong> 5.79 steps are necessary to get from one randomly chosenvertex to another. According to this finding, the famous notion <strong>of</strong> “six degree <strong>of</strong>separation” can be valid in this <strong>network</strong>. Travers and Milgram (1969) found that for a largewell-connected <strong>network</strong>, each vertex can reach any other vertex through a small number<strong>of</strong> links. They claimed that there are no more than six connections between any twopeople on this planet. The degree <strong>of</strong> separation has been studied widely in social media. Yuand Kak (2012) found that the average degree <strong>of</strong> separation in Facebook and Twitter is4.74 and 4.12, respectively. Another <strong>network</strong> topology attribute, the clustering coefficient,
<strong>Co</strong>-<strong>authorship</strong> Network <strong>of</strong> Scientometrics Research <strong>Co</strong>llaborationindicates the extent to which vertices in a <strong>network</strong> tend to cluster together (Newman2003). It describes the probability that two <strong>of</strong> a scientist’s collaborators have themselvesco-authored a paper. <strong>Co</strong>nsidering all vertices <strong>of</strong> the <strong>network</strong>, the total clusteringcoefficient is 0.799, which indicates that the <strong>network</strong> is highly clustered. As a result, twoauthors typically have a high probability <strong>of</strong> <strong>collaboration</strong> if both have collaborated with athird author. This finding may interpret that authors tend to introduce pairs <strong>of</strong> theircollaborators to one another, encouraging new <strong>collaboration</strong>s and increasing clustering inthe <strong>network</strong> (Newman, Watts and Strogatz 2002). The short mean distance coupled withhigh clustering coefficient indicates that the co-<strong>authorship</strong> <strong>network</strong> <strong>of</strong> authors in<strong>scientometrics</strong> field seems to exhibit “small world” <strong>network</strong> properties. A “small world” is a<strong>network</strong> in which any two vertices are only a few steps apart, regardless <strong>of</strong> <strong>network</strong> size. Inthis <strong>network</strong>, vertices are not necessarily all connected to each other, yet they are easilyreachable from one another via short path (Watts and Strogatz 1998).Micro-level metrics refers to centrality, which is one <strong>of</strong> the most important and frequentlyused measurements in social <strong>network</strong> analysis. Centrality measures indicate how centralthe actor is to the <strong>network</strong>, which <strong>of</strong>fer a useful perspective for assessing <strong>research</strong>er’sperformance according to their functions and roles in the <strong>network</strong> (Benckendorff 2010).Three common centrality metrics, namely degree centrality, closeness centrality andbetweenness centrality were adopted to analyze the co-<strong>authorship</strong> <strong>network</strong> <strong>of</strong> authors in<strong>scientometrics</strong> field. Table 1 presents the top 30 authors in terms <strong>of</strong> centrality measures(degree, betweenness and closeness), productivity (number <strong>of</strong> papers in the journalScientometrics) as well as <strong>collaboration</strong> (number <strong>of</strong> co-authors). Degree centrality <strong>of</strong> avertex is the total number <strong>of</strong> links that are adjacent to this vertex (Newman 2004). In thisstudy, it refers to the total number <strong>of</strong> co-<strong>authorship</strong>s that an author has. Authors withhigher degree centrality are more central to the structure <strong>of</strong> the <strong>network</strong> and tend to havegreater capacity to influence others. The average degree centrality <strong>of</strong> authors in<strong>scientometrics</strong> co-<strong>authorship</strong> <strong>network</strong> is 4.069, while the degree distribution variessignificantly. The results show a power-law distribution with a few authors showing a highdegree centrality and majority <strong>of</strong> authors having very low degree centrality. In a dataset <strong>of</strong>3024 authors, only 650 authors (21.49%) have a degree centrality <strong>of</strong> 5 or more and onlyone author reaches the highest degree centrality <strong>of</strong> 277. The most prolific authors in terms<strong>of</strong> degree centrality are: Glanzel (277), Schubert (142), Rousseau (128), Braun (125),Debackere (67), Van Raan (58), Moed (57), Thijs (56), Van Leeuwen (53), Liang and <strong>Co</strong>urtial(47) respectively (Table 1). They are the most active and visible scientometricians with thehighest extent <strong>of</strong> <strong>collaboration</strong>. These authors with the highest degree centrality arecrucial to the robustness <strong>of</strong> the <strong>network</strong> as well as the transmission <strong>of</strong> information.Closeness centrality can be defined as how close an author is on average to all others inthe <strong>network</strong> (Benckendorff 2010). This measure can be interpreted as an indicator <strong>of</strong> theinfluence <strong>of</strong> an actor because the higher its value, the easier for that actor to obtain andspread information through the <strong>network</strong> (Martinez-Romo et al. 2008). Table 1 shows thetop 30 authors ranked on the standardized closeness centrality measure. The top scorers interms <strong>of</strong> closeness centrality are: Glanzel (0.00046983) closely followed by Rousseau(0.00046981), Meyer and Debackere (0.00046026), Kretschmer, Leta, Liang, Thijs, Wu,Persson and Moed (0.00046025). These authors are closest or more central actors <strong>of</strong> the<strong>network</strong>, because the sum <strong>of</strong> their geodesic distances to other actors is among the least.We can see that the closeness centrality <strong>of</strong> authors is very small because in such large<strong>network</strong> with more than 3000 vertexes, usually an actor is only close to a limited number<strong>of</strong> other actors.Page | 79
Erfanmanesh, M.; Rohani, V.A. & Abrizah, A.Table 1: Top 30 Authors in Centrality, Productivity and <strong>Co</strong>llaborationDegree Centrality Betweenness Centrality Closeness Centrality Papers <strong>Co</strong>llaboratorsAuthor Freq. Author Freq. (×10 2 ) Author Freq. (×10 3 ) Author Freq. Authors Freq.Glanzel, W 277 Glanzel, W 4.7117 Glanzel, W 0.46983 Glanzel, W 114 Glanzel, W 45Schubert, A 142 Rousseau, R 2.6226 Rousseau, R 0.46981 Schubert, A 104 Rousseau, R 43Rousseau, R 128 Leydesdorff, L 1.7696 Meyer, M 0.46026 Braun, T 68 Debackere, K 29Braun, T 125 Meyer, M 1.6369 Debackere, K 0.46026 Rousseau, R 56 Ho, Y.S 26Debackere, K 67 Zitt, M 1.2148 Kretschmer, H 0.46025 Egghe, L 51 Moed, H.F 26VanRaan, A.F.J 58 Kretschmer, H 0.9683 Leta, J 0.46025 Leydesdorff, L 51 Anegon, F.D.M 26Moed, H.F 57 Leta, J 0.9267 Liang, L.M 0.46025 Moed, H.F 33 Klingsporn, B 24Thijs, B 56 Park, H.W 0.8772 Thijs, B 0.46025 Moravcsik, M.J 31 Schubert, A 23VanLeeuwen, T 53 Debackere, K 0.8150 Wu, Y.S 0.46025 Vinkler, P 30 <strong>Co</strong>urtial, J.P 23Liang, L.M 47 Gupta, B.M 0.7239 Persson, O 0.46025 Gupta, B.M 28 Gupta, B.M 22<strong>Co</strong>urtial, J.P 47 Moed, H.F 0.6782 Moed, H.F 0.46025 Kretschmer, H 24 VanRaan, A.F.J 21Anegon, F.D.M 46 Laville, F 0.6604 Zhang, L 0.46024 VanRaan, A.F.J 24 A.Mackensen, N 20Sturm, A 44 Okubo, Y 0.6432 Zhou, P 0.46024 <strong>Co</strong>urtial, J.P 23 Bocatius, B 20Weller, K 44 Katz, J.S 0.6415 Jiang, G.H 0.46024 Garg, K.C 23 Bestakowa, L 20Gupta, B.M 44 Hicks, D 0.6244 Gorraiz, J 0.46024 Lewison, G 23 Balicki, G 20Werner, K 44 Chen, C.M 0.6077 Scharnhorst, A 0.46024 Meyer, M 23 Brehmer, L 20VanLooy, B 40 Zhou, P 0.5688 Schubert, A 0.46024 Bonitz, M 22 Werner, K 20Meyer, M 40 Zhang, J 0.5558 Katz, J.S 0.45978 Small, H 22 Sturm, A 20Gomez, I 38 <strong>Co</strong>urtial, J.P 0. 5545 Hornbostel, S 0.45978 Thijs, B 21 Brune, V 20Egghe, L 38 Hornbostel, S 0.5212 Schoepflin, U 0.45978 Debackere, K 19 Borner, K 20Ho, Y.S 35 Ho, Y.S 0.5212 Anegon, F.D.M 0.45978 Thelwall, M. 19 Weller, K 20Sombatsompop, N 35 N.Berthelemot, N 0.4186 Hinze, S 0.45978 VanLeeuwen, T 19 VanLeeuwen, T 20Markpin, T 35 V.D.Besselaar, P 0.4019 Gumpenberger, C 0.45978 Persson, O 18 Liang, L.M 20Leydesdorff, L 33 Liang, L.M 0.3907 Janssens, F 0.45978 Zitt, M 18 Fritscher, R 20Thelwall, M 32 Anegon, F.D.M 0.3838 Braun, T 0.45978 Ho, Y.S 17 Osterhage ,A 20Bordons, M 32 VanLeeuwen, T 0.3809 Zimmerman, E 0.45978 Nederh<strong>of</strong>, T.J 17 Probost, M 20Zitt, M 31 Thelwall, M 0.3745 Grupp, H 0.45978 Wilson, C.S 17 Kuntze, J 20Huang, M.H 30 Schubert, A 0.3735 V.Quesada, B 0.45978 Abramo, G 16 Lee, J.R 20Abramo, G 30 Kwon, K.S 0.3634 De Moor, B 0.45978 Bar-Ilan, J 16 Risch, T 20Tijssen, R 30 Klingsporn, B 0.3634 Glenisson, P 0.45978 Bordons, M 16 Eigemeier, K 20Page | 80
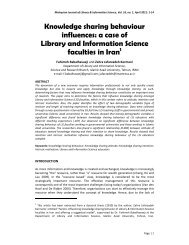
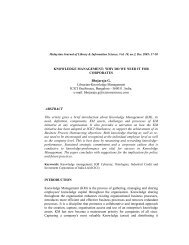
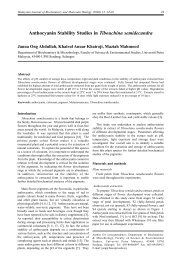
<strong>Co</strong>-<strong>authorship</strong> Network <strong>of</strong> Scientometrics Research <strong>Co</strong>llaborationAnother centrality measure that depicts the importance <strong>of</strong> a particular vertex isbetweenness centrality. The betweenness centrality is defined as the probability that aparticular vertex appears on the shortest path between any pair <strong>of</strong> vertices in the <strong>network</strong>(Yan Ding and Zhu 2010). It is a good measure <strong>of</strong> the brokerage role that various actorsplay in connecting others in the <strong>network</strong>. Additionally, vertices with high betweennesscentrality are deemed highly central because they control the flow <strong>of</strong> information in the<strong>network</strong> (Racherla and Hu 2010). In regard to standardized betweenness centrality scores,the most influential scientometricians in this co-<strong>authorship</strong> <strong>network</strong> are: Glanzel(0.047117), Rousseau (0.026226), Leydesdorf (0.017696), Meyer (0.016369), Zitt(0.012148), Kretschmer (0.009683), Leta (0.009267), Park (0.008772), Debackere(0.008150) and Gupta (0.007239) (See Table 1). These authors and others with highbetweenness centrality play the role <strong>of</strong> a broker to connect the vertices and clusters <strong>of</strong> the<strong>network</strong>. The <strong>network</strong> without these key brokers would display greater fragmentation intoseparate unconnected components. There are <strong>research</strong>ers who rank high on betweennesscentrality but relatively low on closeness centrality. They are <strong>research</strong>ers who act as abridge between sun-communities and the larger <strong>collaboration</strong> group.Table 1 also shows the most productive scientometricians. Glanzel (114) and Schubert(104) leads, and they are followed by: Braun (68), Rousseau (56), Egghe (51), Leydesdorff(51), Moed (33), Moravcsik (31), Vinkler (30) and Gupta (28), which totally constitute morethan 18% <strong>of</strong> the total papers in the journal Scientometrics. The total number <strong>of</strong> peopleswith whom an author collaborated directly during the period <strong>of</strong> study was also calculated.Table 1 also shows the top 30 scientometricians that have the highest number <strong>of</strong> coauthors.The most connected author in the <strong>network</strong> is Glanzel, who has 45 differentimmediate co-authors, following by Rousseau (43), Debackere (29), Ho (26), Moed (26),Anegon (26), Klingsporn (24), Schubert (23), <strong>Co</strong>urtial (23) and Gupta (22). Additionally, theaverage number <strong>of</strong> collaborators for each author is 1.61 (SD=2.38). The <strong>research</strong>ers withthe highest number <strong>of</strong> collaborators are likely to be more active and influential in theacademic community. Newman (2001) found that the probability <strong>of</strong> scientist to collaborateincreases with the number <strong>of</strong> common collaborators. Accordingly, those authors withmany collaborators are likely to be productive and influential. It is interesting to see that afew scientometricians are ranked high in all five measures, clearly indicating theirimportant structural role in the <strong>network</strong>. Reviewing Table 1, we can see that individualslike Glanzel, Rousseau, Debackere, Schubert, Moed, Gupta, Braun, Thijs, Liang, Leydesdorf,Meyer, Kretschmer and Leta occupy the topmost positions in various rankings, whichindicate their absolute status in <strong>scientometrics</strong> <strong>research</strong>. Amongst them, Dr. WolfgangGlanzel, who is currently affiliated with University <strong>of</strong> Leuven, appears in the first rank whenall five metrics are taken into consideration.Scientometrics <strong>Co</strong>-<strong>authorship</strong> Network <strong>of</strong> InstitutionsUsing the affiliations listed for each author, the paper analysed the co-<strong>authorship</strong> <strong>network</strong><strong>of</strong> institutions in <strong>scientometrics</strong> <strong>research</strong> <strong>collaboration</strong>. All authors from the sameinstitution are aggregated into a single <strong>network</strong> vertex, while links represent a co<strong>authorship</strong>relationship between two different institutions. The size <strong>of</strong> each vertex is anindication <strong>of</strong> the degree centrality <strong>of</strong> that vertex. Based on the institutional <strong>collaboration</strong><strong>network</strong> shown in Figure 3, ten institutions with the highest degree centrality areidentified. While 1207 institutions are presented by published articles in this <strong>network</strong>, 869(72%) <strong>of</strong> these institutions have 6594 cross-institutional <strong>collaboration</strong> links. A total <strong>of</strong> 338institutions are isolated, having no <strong>collaboration</strong> with the rest <strong>of</strong> the <strong>network</strong>, and 179institutions have only a single link to the whole <strong>network</strong> (pendants). With a low density <strong>of</strong>0.0018, the co-<strong>authorship</strong> <strong>network</strong> <strong>of</strong> institutions demonstrates low cohesion. The giantPage | 81
Erfanmanesh, M.; Rohani, V.A. & Abrizah, A.component <strong>of</strong> the <strong>network</strong> comprises 597 institutions which occupies 49.46% <strong>of</strong> theoverall size <strong>of</strong> the <strong>network</strong>. Institutions not belonging to the main component form 439isolated components, the largest one has only 12 vertices. The mean geodesic distance <strong>of</strong>the <strong>network</strong> is 5.28, suggesting that there are less than six degree <strong>of</strong> separation betweenmost institutions in the <strong>network</strong>. Additionally, the clustering coefficient <strong>of</strong> co-<strong>authorship</strong><strong>network</strong> <strong>of</strong> institutions is 0.623, which means that there is 62.3% chance that twoinstitutions both collaborating with a third institution would also collaborate together.Figure 3: Scientometrics <strong>Co</strong>-<strong>authorship</strong> Network <strong>of</strong> InstitutionsMicro level metrics which include degree centrality, closeness centrality and betweennesscentrality were also calculated for institutions co-<strong>authorship</strong> <strong>network</strong>. Table 2 shows thetop 20 institutions in centrality measures as well as productivity and <strong>collaboration</strong>. Withrespect to degree centrality, the top institutions are: University <strong>of</strong> Leuven (262), HungarianAcademy <strong>of</strong> Science (226), University <strong>of</strong> Antwerp (131), University <strong>of</strong> Granada (107),Katholieke Hogeschool Brugge-Oostende (107), Institute <strong>of</strong> Scientific and TechnicalInformation <strong>of</strong> China (95), Spanish National Research <strong>Co</strong>uncil (82), National Institute <strong>of</strong>Science, Technology and Development Studies (74), Institute for Information andDocumentation in Science and Technology (73) and University <strong>of</strong> Sussex (67). Theseinstitutions with the highest degree centrality are more central to the structure <strong>of</strong> the<strong>network</strong> and tend to have a greater capacity to influence others. The mean degreecentrality across all institutions, including isolates (with degree <strong>of</strong> zero) is 10.92, indicatingthe average number <strong>of</strong> links per institution. For the closeness centrality measure, againUniversity <strong>of</strong> Leuven (0.00163399) and Hungarian Academy <strong>of</strong> Science (0.00163363) takethe top two spots followed by University <strong>of</strong> Sussex (0.00163351), Katholieke HogeschoolBrugge-Oostende (0.00163348), Leiden University (0.00163341), National Institute <strong>of</strong>Science, Technology and Development Studies (0.00163338), University <strong>of</strong> Amsterdam(0.00163334), University <strong>of</strong> Antwerp (0.00163328), Institute <strong>of</strong> Scientific and TechnicalInformation (0.00163328) and Elsevier (0.00163327). Since closeness centrality measuresthe distance <strong>of</strong> an institution to all others in the <strong>network</strong>, the closer the institution is toothers, the more favoured the institution becomes.Page | 82
<strong>Co</strong>-<strong>authorship</strong> Network <strong>of</strong> Scientometrics Research <strong>Co</strong>llaborationTable 2: Top 20 Institutions in Centrality, Productivity and <strong>Co</strong>llaborationDegree Centrality Betweenness Centrality Closeness Centrality Papers <strong>Co</strong>llaboratorsUniversity Freq. University Freq. (×10 2 ) University Freq. (×10 3 ) University Freq. University Freq.Univ Leuven 262 Univ Leuven 7.97 Univ Leuven 1.63399 Hungarian Acad Sci 208 Univ Leuven 49Hungarian AcadSci 226 Univ Sussex 4.62 Hungarian Acad Sci 1.63363 Leiden Univ 116 Hungarian AcadSci 35Univ Antwerp 131 Hungarian AcadSci 3.45 Univ Sussex 1.63351 Univ Leuven 102 KHBO 31Univ Granada 107 Georgia Inst Tech 3.13 KHBO 1.63348 Natl Inst Sci & Tech Dev 99 Spanish Natl Res <strong>Co</strong>uncil 28StudiesKHBO 107 Univ Amsterdam 2.87 Leiden Univ 1.63341 Univ Antwerp 78 Univ Granada 25Inst Sci & Tech Info 95 KHBO 2.69 Natl Inst Sci & Tech Dev 1.63338 Univ Amsterdam 62 Univ Antwerp 24StudiesSpanish Natl Res <strong>Co</strong>uncil 82 Leiden Univ 2.33 Univ Amsterdam 1.63334 Inst Info & Docum in Sci 57 Univ Sussex 24& TechNatl InstSci, Techl & Dev 74 Univ Western Ontario 2.12 Univ Antwerp 1.63328 Spanish Natl Res <strong>Co</strong>uncil 50 Leiden Univ 24StudiesCtr Sci Informat & Docum 73 Univ Granada 2.02 Inst Sci & Tech Info 1.63328 Univ Sussex 49 Natl Inst Sci & Tech Dev 22StudiesUniv Sussex 67 Yeungnam Univ 1.98 Elsevier 1.63327 KHBO 49 Henan Normal Univ 21Leiden Univ 66 Natl Autonomous Univ 1.92 Henan Normal Univ 1.63323 Univ Granada 45 Univ Amsterdam 18Univ Fed Rio de Janeiro 65 Fraunh<strong>of</strong>er ISI 1.88 Fraunh<strong>of</strong>er ISI 1.63319 Acad Sci GDR 41 City Univ 16Natl Taiwan Univ 53 Natl InstSci & Tech Dev Studies 1.76 Univ Granada 1.63317 Russian Acad Sci 39 Georgia Inst Tech 16Henan Normal Univ 53 Univ Tokyo 1.76 Spanish Natl Res <strong>Co</strong>uncil 1.63313 Inst Sci Informat 34 Univ Tokyo 16Eotvos Lorand Univ 50 Univ Fed Rio de Janeiro 1.75 Acad Sci GDR 1.63310 Univ Oregon 34 Natl Autonomous Univ 15Wuhan Univ 50 Russian AcadSci 1.67 Bar-IlanUniv 1.63309 Limburgs Univ Cent 34 Univ Fed Rio de Janeiro 15Natl Ctr Sci Res 47 Univ Illinois 1.67 City Univ 1.63308 Georgia Inst Tech 27 Seoul Natl Univ 14Univ Nantes 43 Spanish Natl Res <strong>Co</strong>uncil 1.61 Dalian Univ <strong>of</strong> Tech 1.63308 Drexel Univ 27 Inst Sci & Tech Info 14Dalian Univ Tech 43 City Univ 1.58 Univ Fed Rio de Janeiro 1.63302 Eotvos Lorand Univ 26 Wuhan Univ 13Res Assoc Sci <strong>Co</strong>mmun &Informat42 Seoul NatlUniv 1.57 Univ Western Ontario 1.63278 Univ Hasselt 25 Dalian Univ <strong>of</strong> Tech 13Page | 83
Erfanmanesh, M.; Rohani, V.A. & Abrizah, A.Table 2 also shows the top 20 institutions with the highest betweenness centrality. Thebetweenness centrality scores indicate that University <strong>of</strong> Leuven (0.0797), University <strong>of</strong>Sussex (0.0462) and Hungarian Academy <strong>of</strong> Science (0.0345), Georgia Institute <strong>of</strong>Technology (0.0313), University <strong>of</strong> Amsterdam (0.0287), Katholieke Hogeschool Brugge-Oostende (0.0269), Leiden University (0.0233), University <strong>of</strong> Western Ontario (0.0212),University <strong>of</strong> Granada (0.0202) and Yeungnam University (0.0198) act as key brokers inconnecting various institutions in the <strong>network</strong>. These institutions have the most favouredpositions in the <strong>network</strong> by falling on the geodesic paths between other pairs <strong>of</strong>institutions. Additionally, Hungarian Academy <strong>of</strong> Science (208) is by far the leadinginstitution when the productivity criterion is used. Other most productive institutions are:Leiden University (116), University <strong>of</strong> Leuven (102), National Institute <strong>of</strong> Science,Technology and Development Studies (99), University <strong>of</strong> Antwerp (78), University <strong>of</strong>Amsterdam (62), Institute for Information and Documentation in Science and Technology(57), Spanish National Research <strong>Co</strong>uncil (50), University <strong>of</strong> Sussex (49) and KatholiekeHogeschool Brugge-Oostende (49).The number <strong>of</strong> immediate collaborators, an indicator representing connection and<strong>collaboration</strong> <strong>of</strong> institutions, is 2.16 (SD=3.47) on average, with the maximum value <strong>of</strong> 49for the University <strong>of</strong> Leuven. The second institution with the highest number <strong>of</strong> immediatecollaborator institutions is Hungarian Academy <strong>of</strong> Science (35) followed by KatholiekeHogeschool Brugge-Oostende (31), Spanish National Research <strong>Co</strong>uncil (28), University <strong>of</strong>Granada (25), University <strong>of</strong> Sussex, University <strong>of</strong> Antwerp and Leiden University (24),National Institute <strong>of</strong> Science, Technology and Development Studies (22) and Henan NormalUniversity (21). The results show that the most productive institutions have establishedcollaborative links with a great number <strong>of</strong> institutions. Studying the strength <strong>of</strong><strong>collaboration</strong> between institutions shows that University <strong>of</strong> Leuven and HungarianAcademy <strong>of</strong> Science have the highest number <strong>of</strong> co-authoring links with 160 co<strong>authorship</strong>s.Strong co-<strong>authorship</strong> between institutions is mostly due to a large number <strong>of</strong>co-authored papers between productive individuals in those institutions. Another possibleexplanation for such strong links between institutions is that some authors have publishedtheir papers under different affiliations, which can increase the potential <strong>of</strong> co-authoring <strong>of</strong>those institutions. For example, Glanzel published his papers under the affiliation <strong>of</strong> bothUniversity <strong>of</strong> Leuven and Hungarian Academy <strong>of</strong> Science which can be effective instrengthening co-authoring links between these two institutions. It is noted that thestrongest partnerships in the <strong>network</strong> exist between European universities, while there is aweak co-authoring between North American and European institutions. This finding issomewhat consistent with that <strong>of</strong> Katz (1994) who found that geographical proximityresults in more <strong>collaboration</strong>.It is also worth noting that the centrality, productivity and <strong>collaboration</strong> <strong>of</strong> a university arelargely related to the individuals who are affiliated with that university. In other word,institutional centrality within <strong>collaboration</strong> <strong>network</strong> emerges and develops as authorsaffiliated with that institution create co-authoring links. For example Wolfgang Glanzelplays a vital role in increasing the centrality <strong>of</strong> the University <strong>of</strong> Leuven as well asHungarian Academy <strong>of</strong> Science, just like the role <strong>of</strong> Ronald Rousseau at KatholiekeHogeschool Brugge-Oostende (KHBO), Andras Schubert at Hungarian Academy <strong>of</strong> Science,Mike Thelwall at University <strong>of</strong> Wolverhampton or Martin Meyer at University <strong>of</strong> Sussex.When all <strong>of</strong> the metrics are examined together, it is clear that there are importantinstitutions strategically positioned in the <strong>network</strong> due to their centrality, productivity aswell as <strong>collaboration</strong>. These institutions are University <strong>of</strong> Leuven, Hungarian Academy <strong>of</strong>Science, University <strong>of</strong> Antwerp, KHBO, University <strong>of</strong> Granada, University <strong>of</strong> Amsterdam,Page | 84
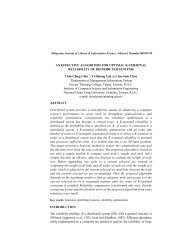
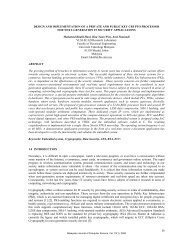
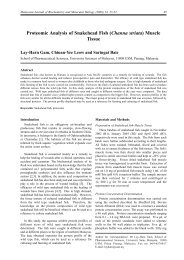
<strong>Co</strong>-<strong>authorship</strong> Network <strong>of</strong> Scientometrics Research <strong>Co</strong>llaborationSpanish National Research <strong>Co</strong>uncil, Leiden University and National Institute <strong>of</strong> Science,Technology and Development Studies. These institutions play critical roles in theproduction <strong>of</strong> <strong>scientometrics</strong> knowledge as well as central roles in the <strong>collaboration</strong><strong>network</strong>, with a large number <strong>of</strong> links to a wide range <strong>of</strong> institutions.Scientometrics <strong>Co</strong>-<strong>authorship</strong> Network <strong>of</strong> <strong>Co</strong>untriesThe international <strong>collaboration</strong> <strong>of</strong> countries can be further studied from the countryinformation included in the author affiliation for each paper published in the journalScientometrics. A <strong>collaboration</strong> <strong>network</strong> <strong>of</strong> countries is presented in Figure 4. The wholeco-<strong>authorship</strong> <strong>network</strong> contains 68 vertices and 2824 links. There is a link between twocountries if the authors affiliated with those countries have co-authored at least onepaper. There are 12 isolated vertices, which represent countries that have not collaboratedwith other countries to the extent <strong>of</strong> co-authoring a paper. The analysis <strong>of</strong> the structuralcharacteristics <strong>of</strong> the <strong>network</strong> shows that the number <strong>of</strong> actual links as a ratio <strong>of</strong> thenumber <strong>of</strong> possible links, or simply the density <strong>of</strong> the co-<strong>authorship</strong> <strong>network</strong> <strong>of</strong> countries is0.086, which is fairly low. The results <strong>of</strong> component analysis obtained a total <strong>of</strong> 13components consist <strong>of</strong> one giant component with 56 vertices (82.35% <strong>of</strong> all vertices) and12 isolated components. The average path length between connected vertices is 2.24,which means that a vertex in the giant component can reach another vertex in about only2.24 steps. Additionally, the overall clustering coefficient <strong>of</strong> 0.58 indicates that vertices <strong>of</strong>the <strong>network</strong> tend to form tightly connected, localized cliques with their immediateneighbors.Figure 4: Scientometrics <strong>Co</strong>-<strong>authorship</strong> Network <strong>of</strong> <strong>Co</strong>untriesTable 3 indicates the top 30 most important countries contributing to <strong>scientometrics</strong><strong>research</strong> based on centrality, productivity and <strong>collaboration</strong> indicators. The United Statesoccupies the topmost positions in closeness centrality, betweenness centrality, number <strong>of</strong>papers as well as number <strong>of</strong> immediate collaborators, which indicates its central role inPage | 85
Erfanmanesh, M.; Rohani, V.A. & Abrizah, A.<strong>collaboration</strong> <strong>network</strong> <strong>of</strong> countries in this field. This finding is interesting in view <strong>of</strong> the factthat none <strong>of</strong> the American institutions was among the top 20 most influential and centralinstitutions discussed earlier. This indicates that many American institutions were engagedin <strong>scientometrics</strong> <strong>research</strong> with fewer outputs <strong>of</strong> papers. American scientometricians havepublished 528 papers with the <strong>collaboration</strong> <strong>of</strong> several colleagues from 31 variouscountries. Ranked the first in closeness centrality, United States is the closest to all othercountries in the <strong>network</strong>, has the highest reachability. Moreover, with the highestbetweenness centrality, this country plays an important role in the <strong>network</strong> by controllingthe flow <strong>of</strong> information. United States and other countries with high betweennesscentrality are intermediate vertices for the communication <strong>of</strong> the rest. Another case, allisolates and pendants, countries with no co-<strong>authorship</strong> or with only one co-<strong>authorship</strong>,have betweenness centrality score <strong>of</strong> zero.With regards to degree centrality, Belgium occupies the top position with 383 co<strong>authorship</strong>swith foreign countries, followed by China (269) and United States (259).Although the United States has the highest number <strong>of</strong> papers, its <strong>collaboration</strong> activity wasweaker than Belgium and China. <strong>Co</strong>nsidering all measures together, United States,Belgium, Netherlands, Spain, UK, Germany, Hungary and China play the most pivotal andcentral role in the co-<strong>authorship</strong> <strong>network</strong> <strong>of</strong> countries in <strong>scientometrics</strong> field.Studying the collaborative links <strong>of</strong> countries shows that Belgium and China have thestrongest collaborative link in the <strong>network</strong> with 194 co-<strong>authorship</strong>s. The second and thirdstrongest collaborative links can be seen between Belgium and Hungary (166) and Chinaand Taiwan (104). While Hungary is Germany’s biggest partner with 78 shared papers,Belgium is Netherland’s strongest collaborator with 134 co-<strong>authorship</strong>s. Spain has thestrongest collaborative links with France (44), while France itself has the highest number <strong>of</strong>shared papers with Russia (52).The highest proportion <strong>of</strong> US international <strong>collaboration</strong> can be observed with China (84).Hungary, the forth country with regards to productivity, has 176 collaborative links withonly 13 immediate neighbors, the highest shared papers with Belgium. Australianscientometricians are connected to Chinese (26) and American (18) colleagues, but isolatedfrom Belgium, Hungary and Germany. An interesting finding is that United States has only8 co-<strong>authorship</strong>s with Belgium, but not with Hungary. <strong>Co</strong>nversely, Americanscientometricians collaborate more with those in China, UK and Canada.In general, European countries are the main source <strong>of</strong> <strong>scientometrics</strong> papers, followed byNorth America and Asia. Moreover, the co-<strong>authorship</strong> ties <strong>of</strong> European and NorthAmerican countries are totally weak, except that <strong>of</strong> UK and US (74 shared papers). China isthe only country which has strong collaborative ties with the most important andproductive countries from various continents. Finally, it is noteworthy that a large number<strong>of</strong> <strong>collaboration</strong>s may be explained by the strong cultural affinity between countries suchas Belgium, Netherlands and Hungary or China and Taiwan.Page | 86
<strong>Co</strong>-<strong>authorship</strong> Network <strong>of</strong> Scientometrics Research <strong>Co</strong>llaborationTable 3: Top 30 <strong>Co</strong>untries in Centrality, Productivity and <strong>Co</strong>llaborationDegree Centrality Betweenness Centrality Closeness Centrality Papers <strong>Co</strong>llaborators<strong>Co</strong>untry Freq. <strong>Co</strong>untry Freq. <strong>Co</strong>untry Freq. (×10 2 ) <strong>Co</strong>untry Freq. <strong>Co</strong>untry Freq.Belgium 383 U.S.A. 0.1441 U.S.A. 7.4860 U.S.A 528 U.S.A 31China 269 England 0.1341 England 7.4527 Netherlands 257 England 29U.S.A 259 Spain 0.0914 Spain 7.4115 Belgium 229 Spain 23Germany 191 Germany 0.0844 Netherlands 7.3951 Hungary 217 Belgium 22Netherlands 187 Belgium 0.0680 Belgium 7.3869 Spain 210 Netherlands 22Hungary 176 France 0.0520 Germany 7.3788 England 208 Germany 21England 169 Netherlands 0.0514 France 7.3464 Germany 200 France 16Spain 154 Australia 0.0327 Canada 7.3144 India 180 China 15France 133 Russia 0.0296 China 7.3144 China 170 Hungary 13Taiwan 87 Canada 0.0288 Hungary 7.2826 France 151 Sweden 13India 68 Brazil 0.0284 Australia 7.2826 Canada 86 Canada 13Australia 79 Afghanistan 0.0257 Sweden 7.2747 Russia 85 Australia 13Sweden 54 Austria 0.0244 India 7.2668 Taiwan 78 India 11Russia 51 China 0.0210 Russia 7.2510 Australia 68 Brazil 9Canada 49 India 0.0148 Brazil 7.2354 Italy 66 Russia 9Switzerland 48 Sweden 0.0113 Taiwan 7.2198 South Korea 66 Denmark 8Finland 43 Hungary 0.0063 Denmark 7.2043 Japan 60 Finland 7Brazil 34 S. Korea 0.0044 Israel 7.2043 Brazil 56 Mexico 7S. Korea 33 Japan 0.0036 Mexico 7.1965 Sweden 54 Taiwan 7Israel 29 Denmark 0.0023 Austria 7.1965 Finland 48 Austria 6Austria 28 Mexico 0.0001 Finland 7.1888 Israel 47 Italy 6Mexico 28 Greece 0.0001 Cuba 7.1888 Denmark 36 Norway 6Denmark 22 Finland 0.0001 Italy 7.1811 Austria 35 South Korea 6Cuba 17 Taiwan 0.0001 Switzerland 7.1811 Mexico 31 Israel 6Chile 17 Cuba 0.0001 South Korea 7.1734 South Africa 31 Japan 6<strong>Co</strong>lumbia 17 Switzerland 0.0001 Greece 7.1657 Switzerland 29 Greece 5Ireland 16 Others <strong>Co</strong>untires 0.0000 Norway 7.1581 Poland 26 Switzerland 5Japan 16 - - Japan 7.1504 Iran 22 Cuba 5Greece 15 - - Singapore 7.1504 Norway 22 Iran 4South Africa 12 - - South Africa 7.1502 Turkey 21 South Africa 4Page | 87
Erfanmanesh, M.; Rohani, V.A. & Abrizah, A.Scientometrics <strong>Co</strong>-<strong>authorship</strong> Network by Academic FieldsFinally, this paper studies the <strong>collaboration</strong> <strong>network</strong> <strong>of</strong> academic fields in <strong>scientometrics</strong><strong>research</strong>. A <strong>collaboration</strong> <strong>network</strong> <strong>of</strong> academic fields was constructed based on theaffiliation listed for each author. The department or faculty which an author is affiliated tois considered as his academic field. In many cases where the name <strong>of</strong> department orfaculty was not indicated in the paper, the World Wide Web resources were used todetermine the academic field <strong>of</strong> authors. However, the academic fields <strong>of</strong> 315 authors(10.4%) were excluded from the study as they could not be identified even after searchingthe World Wide Web. To show the <strong>collaboration</strong> <strong>network</strong> <strong>of</strong> fields and to preventdispersion, the academic fields were mapped into 22 broad fields depicted in EssentialScience Indicators (ESI). Figure 5 shows the co-<strong>authorship</strong> <strong>network</strong> <strong>of</strong> academic fields in<strong>scientometrics</strong> <strong>research</strong>. The <strong>network</strong> consists <strong>of</strong> 22 fields as vertices and 3508<strong>collaboration</strong> links. As presented in Table 4, considering all five measures, the most active,central and collaborative academic fields are Social Sciences, Economics and Business,Clinical Medicine, Physics, Chemistry and Psychiatry and Psychology. The most productivediscipline in social sciences is Information and Library Sciences (1212) followed by Policy <strong>of</strong>Science and Technology (456) and Sociology (114). Academic fields <strong>of</strong> scientometricianswith the least centrality, productivity and <strong>collaboration</strong> are Immunology, Pharmacology,Microbiology and Space Sciences.Figure 5: Scientometrics <strong>Co</strong>-<strong>authorship</strong> Network by Academic FieldsPage | 88
<strong>Co</strong>-<strong>authorship</strong> Network <strong>of</strong> Scientometrics Research <strong>Co</strong>llaborationTable 4: Centrality, Productivity and <strong>Co</strong>llaboration <strong>of</strong> Academic Fields in Scientometrics ResearchDegree Centrality Betweenness Centrality Closeness Centrality Papers <strong>Co</strong>llaboratorsMajor Freq. Major Freq. Major Freq. Major Freq. Major Freq.Social Sci 2112 Social Sci 0.2116 Social Sci 0.9565 Social Sci 1923 Social Sci 21Economics, Business 1152 Economics,Business 0.0605 Economics,Business 0.8461 Economics,Business 550 Economics,Business 18Clinical Medicine 530 Physics 0.0547 Physics 0.7586 Physics 174 Physics 15Mathematics 384 Clinical Medicine 0.0388 Clinical Medicine 0.7586 Clinical Medicine 163 Clinical Medicine 15Chemistry 364 Psychiatry, Psychology 0.0201 Psychiatry,Psychology 0.7096 Chemistry 140 Molecular Biology, Genetics 13Physics 316 Molecular0.0200 Chemistry 0.7096 Engineering 117 Chemistry 13Biology,GeneticsEngineering 290 Chemistry 0.0165 Molecular Biology, Genetics 0.7096 Mathematics 108 Psychiatry,Psychology 13<strong>Co</strong>mputer Sci 266 <strong>Co</strong>mputer Sci 0.0163 Engineering 0.6875 <strong>Co</strong>mputer Sci 103 <strong>Co</strong>mputer Sci 12Psychiatry, Psychology 228 Agricultural Sci 0.0125 Environment,Ecology 0.6875 Psychiatry,Psychology 102 Mathematics 12Agricultural Sciences 184 Engineering 0.0121 Mathematics 0.6875 Biology,Biochemistry 54 Environment,Ecology 12Plant,AnimalSci 174 Mathematics 0.0106 <strong>Co</strong>mputer Sci 0.6875 Agricultural Sci 40 Engineering 12Environment, Ecology 172 Plant,AnimalSci 0.0073 Biology,Biochemistry 0.6666 Environment,Ecology 35 Biology,Biochemistry 11Biology, Biochemistry 152 Multidisciplinary 0.0066 Agricultural Sci 0.6470 Materials Sci 35 Agricultural Sci 10Multidisciplinary 124 Environment,Ecology 0.0056 Materials Sci 0.6111 Geosciences 32 Neuroscience,Behavior 8Neuroscience, 106 Neuroscience, Behavior 0.0053 Multidisciplinary 0.5945 Plant,AnimalSci 30 Multidisciplinary 8BehaviorMaterials Sci 76 Materials Sci 0.0037 Plant,AnimalSci 0.5945 Molecular Biology, Genetics 28 Plant,AnimalSci 8Geosciences 56 Geosciences Geosciences 0.5945 Multidisciplinary 21 Materials Sci 8Molecular56 Biology,Biochemistry 0.0026 Neuroscience,Behavior 0.5945 Space Sci 21 Geosciences 7Biology,GeneticsPharmacology 48 Space Sci 0 Microbiology 0.5500 Neuroscience,Behavior 15 Microbiology 4Space Sci 26 Immunology 0 Pharmacology 0.5365 Pharmacology 12 Pharmacology 4Microbiology 14 Pharmacology 0 Immunology 0.5000 Microbiology 7 Space Sci 2Immunology 8 Microbiology 0 Space Sci 0.4680 Immunology 3 Immunology 1Page | 89
Erfanmanesh, M.; Rohani, V.A. & Abrizah, A.CONCLUSIONThis study has examined the <strong>scientometrics</strong> co-<strong>authorship</strong> <strong>network</strong>s <strong>of</strong> authors, institutions,countries and by academic fields using the data from the journal Scientometrics. This is a limitation<strong>of</strong> the study as it does not take into account papers on <strong>scientometrics</strong> published elsewhere such asJournal <strong>of</strong> Informetrics, Journal <strong>of</strong> the American Society for Information Science and Technology(JASIST) and Research Evaluation. The key findings <strong>of</strong> this study on the community <strong>of</strong>scientometricians are as follows:a) The percentage <strong>of</strong> co-authored papers represents 54.78% <strong>of</strong> the total number <strong>of</strong> paperspublished in the journal Scientometrics;b) The scientometrician’s <strong>collaboration</strong> <strong>network</strong> forms “small-world” topology in which twoauthors randomly selected are typically separated by a short path, and has demonstratedthe presence <strong>of</strong> clustering;c) The distribution <strong>of</strong> vertices degree centrality in the <strong>collaboration</strong> <strong>network</strong> <strong>of</strong>scientometricians follows the power-law distribution. In this <strong>network</strong>, we have a greatnumber <strong>of</strong> authors with small degrees and a small tail <strong>of</strong> authors with large degrees;d) The co-<strong>authorship</strong> <strong>network</strong> <strong>of</strong> authors in the field <strong>of</strong> <strong>scientometrics</strong> consists <strong>of</strong> 1570components, the largest <strong>of</strong> which contains 459 vertices, yielded a ratio <strong>of</strong> 15.17% <strong>of</strong> thewhole <strong>network</strong>;e) Thirteen scientometricians, Glanzel, Rousseau, Debackere, Schubert, Moed, Gupta, Braun,Thijs, Liang, Leydesdorf, Meyer, Kretschmer and Leta are strategically positioned in the<strong>network</strong> due to both their productivity and centrality.f) University <strong>of</strong> Leuven, Hungarian Academy <strong>of</strong> Science, University <strong>of</strong> Antwerp, KHBO,University <strong>of</strong> Granada, University <strong>of</strong> Amsterdam, Spanish National Research <strong>Co</strong>uncil, LeidenUniversity and National Institute <strong>of</strong> Science, Technology and Development Studies occupythe topmost positions in various rankings, which indicate their absolute status in<strong>scientometrics</strong> <strong>research</strong>.g) The United States, although has no representative in the top 20 most influential and centralinstitutions, occupies the topmost positions in all measures except for degree centrality.Belgium, Netherlands, Span, England, Germany, Hungary and China come after US based onproductivity, centrality and <strong>collaboration</strong>.h) The most active, central and collaborative academic fields in <strong>scientometrics</strong> <strong>research</strong> areSocial Sciences, Economics and Business, Clinical Medicine, Physics, Chemistry andPsychiatry and Psychology; with Information and Library Sciences as the most productivediscipline in social sciences producing <strong>scientometrics</strong> <strong>research</strong>.Although the study has included a time span <strong>of</strong> more than three decades (1980-2012) for the<strong>scientometrics</strong> co-<strong>authorship</strong> <strong>network</strong>, the temporal dimension, i.e. to see whether the practices <strong>of</strong>co-<strong>authorship</strong> <strong>of</strong> various institutions and countries relationships have changed over time, has notbeen explored in this study. However, the positive evolutions <strong>of</strong> the main component <strong>of</strong> the<strong>scientometrics</strong> <strong>collaboration</strong> <strong>network</strong> coupled with the presence <strong>of</strong> a number <strong>of</strong> key individuals areevidence <strong>of</strong> the healthy status <strong>of</strong> the <strong>scientometrics</strong> <strong>research</strong> community. Unlike a similar analysis <strong>of</strong>the information systems community (Xu and Chau 2006), the <strong>scientometrics</strong> scene was notdominated by a couple <strong>of</strong> key <strong>research</strong>ers as quite a significant number <strong>of</strong> popular <strong>research</strong>ers wereidentified. This is the pro<strong>of</strong> <strong>of</strong> community’s ability to attract new members over the years and toproduce new generations <strong>of</strong> popular <strong>research</strong>ers. The <strong>scientometrics</strong> <strong>research</strong> community wasfound to be a healthy small-world community that kept evolving in order to provide an environmentthat supports <strong>collaboration</strong> and sharing <strong>of</strong> ideas between <strong>research</strong>ers in quantitative study <strong>of</strong><strong>research</strong> communication.Page | 90
<strong>Co</strong>-<strong>authorship</strong> Network <strong>of</strong> Scientometrics Research <strong>Co</strong>llaborationACKNOWLEDGEMENTWe acknowledge funding received from the Ministry <strong>of</strong> Higher Education Malaysia (HIR-MOHE)UM.C/HIR/MOHE/FCSIT/11, which made it possible to undertake this <strong>research</strong>.REFERENCESAfshar, M., Abdulmajid, A.H., Hakimi, Z. and Majidfard, A. 2011. Survey <strong>of</strong> authors’ <strong>collaboration</strong> ratein Scientometrics journal articles during 2004 to 2008. International Journal <strong>of</strong> InformationScience and Management, Vol. 9, no. 1: 47-56.Baker, W.E. 2000. Achieving success through social capital. John Wiley & Sons Inc, New York.Bazzan, A.L.C. and Argenta, V.F. 2011. Network <strong>of</strong> <strong>collaboration</strong> among PC members <strong>of</strong> Braziliancomputer science conferences. Journal <strong>of</strong> the Brazilian <strong>Co</strong>mputer Society, Vol. 17, no.2: 133-139.Benckendorff, P. 2010. Exploring the limits <strong>of</strong> tourism <strong>research</strong> <strong>collaboration</strong>: A social <strong>network</strong>analysis <strong>of</strong> co-<strong>authorship</strong> patterns in Australia and New Zealand tourism <strong>research</strong>. Paperpresented at the Tourism and Hospitality: Challenge the limits conference, Tasmania, Australia.8-11 February 2010.Boyd, D.M. and Ellison, N.B. 2007. Social <strong>network</strong> sites: Definition, history, and scholarship. Journal<strong>of</strong> <strong>Co</strong>mputer-Mediated <strong>Co</strong>mmunication, Vol. 13, no. 1: 210-230.Cheong, F. and <strong>Co</strong>rbit, B. 2009. A social <strong>network</strong> analysis <strong>of</strong> the co-<strong>authorship</strong> <strong>network</strong> <strong>of</strong> theAustralian conferences <strong>of</strong> Information Systems from 1990 to 2006. Paper presented at the 17 thEuropean <strong>Co</strong>nference on Information Systems, Verona, Italy. 8-10 June 2009.Chung, K.S.K. and Hossain, L. 2009. Measuring performance <strong>of</strong> knowledge-intensive workgroupsthrough social <strong>network</strong>s. Project Management Journal, Vol. 40, no. 2: 34-58.De Stefano, D., Vitale, M.P. and Zaccarin, S. 2010. The scientific <strong>collaboration</strong> <strong>network</strong> <strong>of</strong> Italianacademic statisticians. Paper presented at the 45th Scientific Meeting <strong>of</strong> the Italian StatisticalSociety, Padua, Italy. 16-18 June 2010.Dutt, B., Garg, K.C. and Bali, A. 2003. Scientometrics <strong>of</strong> the international journal <strong>of</strong> Scientometrics.Scientometrics, Vol. 56, no. 1: 81-93.Godley, J., Barron, G. and Sharma, A.M. 2011. Using social <strong>network</strong> analysis to assess <strong>collaboration</strong> inhealth <strong>research</strong>. Journal <strong>of</strong> Healthcare, Science & the Humanities, Vol. 1, no. 2: 99-116.Gonzalez-Alcaide, G., Park, J., Huamani, C., Gascon, J. and Ramos, J.M. 2012. Scientific <strong>authorship</strong>and <strong>collaboration</strong> <strong>network</strong> analysis on Chagas disease: Papers indexed in Pubmed (1940-2009).Revista do Instituto de Medicina Tropical de São Paulo, Vol. 54, no. 4: 219-228.Guns, R., Liu, Y.X. and Mahbuba, D. 2010. Q-measures and betweenness centrality in a <strong>collaboration</strong><strong>network</strong>: a case study <strong>of</strong> the field <strong>of</strong> Informetrics, Scientometrics, Vol. 87, no. 1: 133-147.Haiqi, Z. and Hong, G. 1997. Scientific <strong>research</strong> <strong>collaboration</strong> in China. Scientometrics, Vol. 38, no .2:309-319.Hood, W.W. and Wilson, C.S. 2001. The literature <strong>of</strong> bibliometrics, <strong>scientometrics</strong> and informetrics.Scientometrics, Vol. 52, no. 2: 291-314.Hou, H., Kretschmer, H. and Liu, Z. 2008. The structure <strong>of</strong> scientific <strong>collaboration</strong> <strong>network</strong>s inScientometrics. Scientometrics, Vol. 75, no. 2: 189-202.Katerndahl, D. 2012. Evolution <strong>of</strong> the <strong>research</strong> <strong>collaboration</strong> <strong>network</strong> in a productive department.Journal <strong>of</strong> Evaluation in Clinical Practice, Vol. 18, no. 1: 195-201.Katz, J.S. 1994. Geographical proximity and scientific <strong>collaboration</strong>. Scientometrics, Vol. 31, no. 1: 31-43.Katz, J.S. and Martin, B.R. 1997. What is <strong>research</strong> <strong>collaboration</strong>?. Research policy, Vol. 26, no. 1: 1-18.Page | 91
Erfanmanesh, M.; Rohani, V.A. & Abrizah, A.Kretschmer, H. 2004. Author productivity and geodesic distance in bibliographic co-<strong>authorship</strong><strong>network</strong>s and visibility <strong>of</strong> the web.Scientometrics, Vol. 60, no. 3: 409-420.Krichel, T. and Bakkalbasi, N. 2006. A social <strong>network</strong> analysis <strong>of</strong> <strong>research</strong> <strong>collaboration</strong> in theeconomic community. Paper presented at the International <strong>Co</strong>nference on Webometrics,Informetrics & Scientometrics, Nancy, France. 10-12 May 2006.Martinez-Romo, J., Robles, G., Gonzalez-Barahona, M. and Ortuno-Perez, M. 2008.Using social<strong>network</strong> analysis techniques to study <strong>collaboration</strong> between a FLOSS community and acompany. In Russo, B. Et al. (eds.), IFIP International Federation for Information Processing,Volume 275: Open Source Development, <strong>Co</strong>mmunities and Quality; (Boston: Springer), 171-186.Milojevic, S. and Leydesdorff, L. 2012. Information metrics (iMetrics): a <strong>research</strong> specialty with asocio-cognitive identity. Scientometrics. Available at: http:// rd.springer. com/ article /10.1007/s11192-012-0861-z.Monteiro, V., Neto, M., Aurora, C. and <strong>Co</strong>rreia, A.M.R. 2009. <strong>Co</strong>-Authorship <strong>of</strong> scientists in theenergy field: an exploratory study <strong>of</strong> the ETDE World Energy Database (ETDEWEB) using social<strong>network</strong> analysis. Paper presented at the 5th European <strong>Co</strong>nference on Economics andManagement <strong>of</strong> Energy in Industry, Vilamoura, Portugal. 14-17 April 2009.Morisson, P.S., Dobbie, G. and McDonald, F.J. 2003. Research <strong>collaboration</strong> among universityscientists. Higher Education Research & Development, Vol. 22, no. 3: 275-296.Moody, J. 2004. The structure <strong>of</strong> a social science <strong>collaboration</strong> <strong>network</strong>: Disciplinary cohesion from1963 to 1999. American Sociological Review, Vol. 69, no. 2: 213-238.Newman, M.E.J. 2001. Clustering and preferential attachment in growing <strong>network</strong>s. Physical ReviewE, Vol. 64, no. 2: 1-13.Newman, M.E.J. 2003. The structure and function <strong>of</strong> complex <strong>network</strong>s. SIAM Review, no. 45: 167-256.Newman, M.E.J. 2004. <strong>Co</strong>-<strong>authorship</strong> <strong>network</strong>s and patterns <strong>of</strong> scientific <strong>collaboration</strong>. Proceedings<strong>of</strong> the National Academy <strong>of</strong> Science <strong>of</strong> the United States <strong>of</strong> America, Vol. 101, no. 1: 5200-5204.Newman, M.E.J., Watts, D.J. and Strogatz, S.H. 2002. Random graph models <strong>of</strong> social <strong>network</strong>s.Proceedings <strong>of</strong> the National Academy <strong>of</strong> Science <strong>of</strong> the United States <strong>of</strong> America, Vol. 99, no. 1:2566-2572.Persson, O. 2000. A bibliometric view <strong>of</strong> Scientometrics. Available at:http://www8.umu.se/inforsk/<strong>scientometrics</strong>/.Pluzhenskaia, M. 2007. Research <strong>collaboration</strong> <strong>of</strong> Library and Information Science (<strong>LIS</strong>) school’sfaculty members with <strong>LIS</strong> and non-<strong>LIS</strong> advanced degrees: multidisciplinary and interdisciplinarytrends. Paper presented at the 8 th <strong>Co</strong>nference on Interdisciplinarity & Transdisciplinarity in theOrganization <strong>of</strong> Scientific Knowledge, Leon, Spain. 18-20 April 2007.Prell, C. 2011. Social <strong>network</strong> analysis: History, theory and methodology, SAGE Publications Ltd.,London.Racherla, P. and Hu, C. 2010. A social <strong>network</strong> perspective <strong>of</strong> tourism <strong>research</strong> <strong>collaboration</strong>. Annals<strong>of</strong> Tourism Research, Vol. 37, no. 4: 1012-1034.Sakata, I., Sasaki, H. and Inoue, T. 2011. Structure <strong>of</strong> international <strong>research</strong> <strong>collaboration</strong> in wind andsolar energy. Paper presented at the International <strong>Co</strong>nference on Industrial Engineering &Engineering Management, Singapore. 6-9 December 2011.Takeda, H. 2010. A social <strong>network</strong> analysis <strong>of</strong> the IS field: A co-<strong>authorship</strong> <strong>network</strong> study.Proceedings <strong>of</strong> the Southern Association for Information Systems <strong>Co</strong>nference, Atlanta, USA. 27March 2010.Travers, J. and Milgram, S. 1969. An experimental study <strong>of</strong> the small world problem. Sociometry, Vol.32, no. 4: 425-443.Page | 92
<strong>Co</strong>-<strong>authorship</strong> Network <strong>of</strong> Scientometrics Research <strong>Co</strong>llaborationWang, X., Liu, Z., Chen, Y. and Zhy, X. 2008. Analysis <strong>of</strong> science <strong>collaboration</strong> <strong>network</strong> <strong>of</strong> topuniversities in the world. Paper presented at the 4 th International <strong>Co</strong>nference on Webometrics,Informetrics and Scientometrics, Berlin, Germany. 28 July-1 August 2008.Watts, D. and Strogatz, S.H. 1998. <strong>Co</strong>llective dynamics <strong>of</strong> small-world <strong>network</strong>s. Nature, No. 393:440-442.Yan, E., Ding, Y. and Zhu, Q. 2010. Mapping library and information science in china: a co<strong>authorship</strong><strong>network</strong> analysis. Scientometrics, Vol. 83, no. 1: 115-131.Ye, Q., Li, T. and Law, R. 2011. A co<strong>authorship</strong> <strong>network</strong> analysis <strong>of</strong> tourism and hospitality <strong>research</strong><strong>collaboration</strong>. Journal <strong>of</strong> Hospitality & Tourism Research. Available at:http://units.sla.org/division/dst/Annual%20<strong>Co</strong>nference /2009_Washington /Citation.Yu, S. and Kak, S. 2012. A survey <strong>of</strong> prediction using social media. ArXiv e-prints. Available at:http://arxiv.org/ftp/arxiv/papers/1203/1203.1647.pdfYu, Q., Shao, H. and Duan, Z. 2012. The <strong>research</strong> <strong>collaboration</strong> in Chinese cardiography andcardiovasology field. International Journal <strong>of</strong> Cardiography, 2012 Mar 26: 1-6.Xu, J. and Chau, M. 2006. The social identity <strong>of</strong> IS: Analyzing the <strong>collaboration</strong> <strong>network</strong> <strong>of</strong> the ICISconferences (1980-2005). Paper presented at the 27 th International <strong>Co</strong>nference on InformationSystems, Milwaukee, USA. 10-13 December 2006.Page | 93