'Building Better Returns' - The Australian Property Institute
'Building Better Returns' - The Australian Property Institute
'Building Better Returns' - The Australian Property Institute
- No tags were found...

Create successful ePaper yourself
Turn your PDF publications into a flip-book with our unique Google optimized e-Paper software.
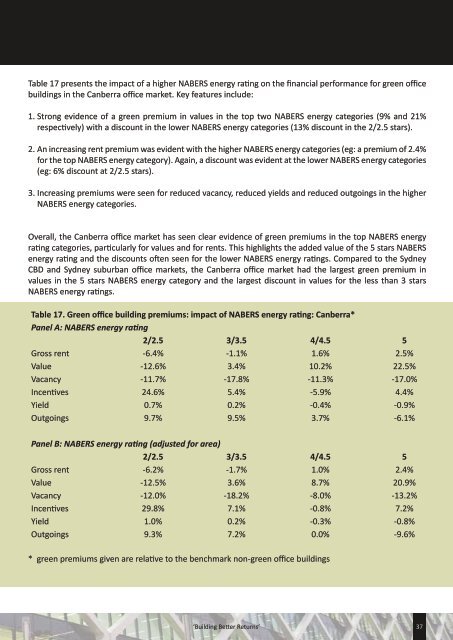
Table 17 presents the impact of a higher NABERS energy rating on the financial performance for green officebuildings in the Canberra office market. Key features include:1. Strong evidence of a green premium in values in the top two NABERS energy categories (9% and 21%respectively) with a discount in the lower NABERS energy categories (13% discount in the 2/2.5 stars).2. An increasing rent premium was evident with the higher NABERS energy categories (eg: a premium of 2.4%for the top NABERS energy category). Again, a discount was evident at the lower NABERS energy categories(eg: 6% discount at 2/2.5 stars).3. Increasing premiums were seen for reduced vacancy, reduced yields and reduced outgoings in the higherNABERS energy categories.Overall, the Canberra office market has seen clear evidence of green premiums in the top NABERS energyrating categories, particularly for values and for rents. This highlights the added value of the 5 stars NABERSenergy rating and the discounts often seen for the lower NABERS energy ratings. Compared to the SydneyCBD and Sydney suburban office markets, the Canberra office market had the largest green premium invalues in the 5 stars NABERS energy category and the largest discount in values for the less than 3 starsNABERS energy ratings.Table 17. Green office building premiums: impact of NABERS energy rating: Canberra*Panel A: NABERS energy rating2/2.5 3/3.5 4/4.5 5Gross rent -6.4% -1.1% 1.6% 2.5%Value -12.6% 3.4% 10.2% 22.5%Vacancy -11.7% -17.8% -11.3% -17.0%Incentives 24.6% 5.4% -5.9% 4.4%Yield 0.7% 0.2% -0.4% -0.9%Outgoings 9.7% 9.5% 3.7% -6.1%Panel B: NABERS energy rating (adjusted for area)2/2.5 3/3.5 4/4.5 5Gross rent -6.2% -1.7% 1.0% 2.4%Value -12.5% 3.6% 8.7% 20.9%Vacancy -12.0% -18.2% -8.0% -13.2%Incentives 29.8% 7.1% -0.8% 7.2%Yield 1.0% 0.2% -0.3% -0.8%Outgoings 9.3% 7.2% 0.0% -9.6%* green premiums given are relative to the benchmark non-green office buildings‘Building <strong>Better</strong> Returns’37