'Building Better Returns' - The Australian Property Institute
'Building Better Returns' - The Australian Property Institute
'Building Better Returns' - The Australian Property Institute
- No tags were found...

Create successful ePaper yourself
Turn your PDF publications into a flip-book with our unique Google optimized e-Paper software.
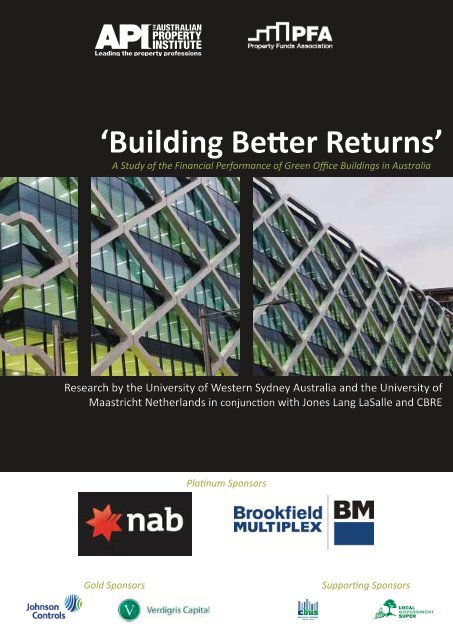
‘Building <strong>Better</strong> Returns’A Study of the Financial Performance of Green Office Buildings in AustraliaImage above and on cover is the 6 Star Green Star rated One Shelley Street, Sydney, built by Brookfield Multiplex.Research by the University of Western Sydney Australia and the University of Maastricht Netherlandsin conjunction with Jones Lang LaSalle and CBRE
API & PFA Comments<strong>Australian</strong> <strong>Property</strong> <strong>Institute</strong>National PresidentPhilip Western<strong>Property</strong> Funds AssociationPresidentRobert OldeI would firstly like to thank the Building <strong>Better</strong> Returns SteeringCommittee for their commitment and hard work on this project.Thanks must also go to the <strong>Australian</strong> <strong>Property</strong> <strong>Institute</strong>’s (API)NSW Division for the administration coordination involvedin completing this important research. <strong>The</strong> industry andgovernment collaboration accomplished for this report, as wellas international research cooperation has been an excellentachievement and we can commend the report to industry withconfidence.I would especially like to thank Jones Lang LaSalle and CBREfor their collaboration and sharing of information, whichdemonstrates the importance now placed on sustainabilityand climate change action, even in our often compact andcompetitive markets.<strong>The</strong> valuation sector works on legal precedents and must reflectmarket transactions which are comparable in nature to ascertaina nominated property’s value. A valuer very often does not haveall market evidence and full detail of all transactions available tothem. As such, they must assess valuation from the informationthey have at hand at the time of determining the valuation.Research projects such as the US’ “Doing Well By Doing Good”and this report on the <strong>Australian</strong> market are important catalyststo providing the detailed market analysis to inform stakeholders.<strong>The</strong> API will ensure that the outcomes of this exciting projectare communicated extensively across the valuation industryto provide valuers with a detailed analysis as evidence in theirvaluation process. Reports such as Building <strong>Better</strong> Returns whichgo into the detail of removing variable factors to determine theimpact of ‘green’ issues on rents and value determinates allowimproved education in the industry and better informed decisionmaking on investment and risk management for investors andfinanciers, directly in property and indirectly in energy and otherresource efficiency sectors.<strong>The</strong> impact of climate change on the property sector hascompanies moving to asset protection strategies in light ofclimate extremes which properties must physically withstand.This report demonstrates the demand for ‘green’ properties,in light of improved returns for investors and also continuinggovernment regulation and consumer concerns in the area ofclimate change.<strong>The</strong> API is proud to be associated with the Building <strong>Better</strong>Returns project and is confident of the positive and importantrole that this research will play in the property industry’s future.<strong>The</strong> <strong>Property</strong> Funds Association of Australia (PFA) is pleased to besupporting the Building <strong>Better</strong> Returns initiative in conjunctionwith the <strong>Australian</strong> <strong>Property</strong> <strong>Institute</strong>.Recently I attended an ATO Roundtable on the Tax Breaks forGreen Buildings as the President of the PFA representing thewholesale and retail property fund members. This Governmentinitiative to provide $1 Billion in tax breaks to buildings broughtinto sharp focus the importance of financial and taxationimplications which are involved in the decision making processof property owners and managers.Sustainable property is a sector which clearly requires greaterresearch, and I am delighted that on behalf of our wholesale andretail fund manager members we have been able to positivelycontribute in this regard. <strong>The</strong> current lack of informationavailable on the financial outcomes of sustainable propertyinvestment has been a major impediment to capital investmentin the sector and we hope this research report will go somewayto addressing this issue.As such, this report will be invaluable in the <strong>Australian</strong> propertymarket and has been eagerly anticipated by investors andfund managers alike. Being able to measure and quantify theinvestment return of sustainable buildings is vital for ourmembers when planning property investments and futurestrategies for existing buildings. <strong>The</strong> boundaries between greenand traditional stock are increasingly blurred and we hopethis report will bring into focus the financial implications fordifferentiating properties in the sustainable space.I would like to personally thank the PFA Sustainability Committeefor their efforts in conjunction with the API to provide ourrespective members with this additional resource and improvedclarity in this sector. Thanks must also go to the Building <strong>Better</strong>Returns Steering Committee who have put in a significantamount of work to see this project through to completion.Robert OldePresident PFA of AustraliaPhilip WesternAPI National President4 ‘Building <strong>Better</strong> Returns’
Building <strong>Better</strong> ReturnsSteering CommitteeIndependent ChairRoger WalkerWalker EcoStrategiesMaastricht UniversityDr Nils Kok<strong>Australian</strong> <strong>Property</strong> <strong>Institute</strong> (API)Richard BowmanErnst & Young<strong>Property</strong> Funds Association (PFA)Adam MurchieForza Capital<strong>Australian</strong> <strong>Property</strong> <strong>Institute</strong> (API)Dr David ReesJones Lang LaSalleDepartment of Climate Changeand Energy EfficiencyLloyd WoodfordGreen Building Councilof Australia (GBCA)Robin MellonNSW Office of Environmentand HeritageMatthew ClarkInvestor Group onClimate Change (IGCC)Marty LambRussell InvestmentsInvestor Group onClimate ChangeLouise DavidsonCBUSInvestor Group on ClimateChange (IGCC)Dr Richard Fuller‘Building <strong>Better</strong> Returns’5
Platinum SponsorsNational Australia Bank (NAB) is a financial services organisation withover 40,000 people that is responsible to more than 460,000 shareholders.We operate major financial services franchises in Australia, as well asbusinesses in New Zealand, Asia, the United Kingdom and the UnitedStates. As Australia’s leading business bank, based on lending market shareat 24.3% 1 , NAB provides a diverse range of commercial banking servicesto small businesses through to Australia’s largest businesses, includingmany of the ASX Top 200 listed companies. Business Banking also providesspecialist industry expertise in the Agribusiness, <strong>Property</strong>, Healthcare, Natural Resources, Education andGovernment sectors.NAB is at the forefront of market leading property transactions and, in 2011, NAB was voted No.1 Bank ofChoice for <strong>Property</strong> Finance 2 . NAB recently launched an innovative finance solution for environmental propertyupgrades to benefit <strong>Australian</strong> commercial property owners and their tenants. <strong>The</strong> NAB EnvironmentalUpgrade Funding is a fixed interest model administered by local councils that finances environmental retrofitsof commercial buildings, enhancing cost savings and energy performance. Developed by NAB, it supports theCity of Melbourne’s “1200 Buildings Programme” and will provide capital for the energy efficiency retrofit ofcommercial buildings over the next decade.1. APRA, June 20112. Peter Lee Associates 2011 Large Corporate and Institutional Relationship Banking Survey – Australia© 2011 National Australia Bank Limited ABN 12 004 044 937Brookfield Multiplex is a leading global contracting anddevelopment company that builds, engineers and maintainsproperty and infrastructure assets around the world.Steadfast, driven and bold, Brookfield Multiplex is anaccomplished international contracting and developmentbusiness. We are at our best creating large-scale and complexlandmark buildings, commercial structures and infrastructure projects. Forward-thinking and focused wedefine value more widely than short-term gains; it extends to environmental, social and economic solutionsover the entire life cycle of an asset.Our contracting heritage is in construction - forged in Australia almost fifty years ago - with ensuing growth inNew Zealand, the Middle East, Asia, Europe and Canada. We are expanding this legacy, applying our expertiseand strength to the Engineering & Infrastructure sectors.<strong>The</strong> Brookfield Multiplex contracting business currently has an AUD$8.1 billion global workbook across38 projects spanning a variety of sectors including residential, entertainment, health, retail, commercial,education, rail and water.Brookfield Multiplex known for its industry expertise and award-winning approach having won 411 awardsfor innovation and setting standards across all sectors. Over nearly five decades Brookfield Multiplex hascompleted more than 723 projects across the globe with a combined value of AUD$47.7 billion.6 ‘Building <strong>Better</strong> Returns’
Building <strong>Better</strong> Returns Data ProvidersJones Lang LaSalle is Australia’s largest professional services firm specialisingin real estate services. Across the changing world of real estate, the searchfor opportunity demands expertise and insight. We offer integrated servicesdelivered by expert teams in Australia and worldwide, to clients seekingincreased value by owning, occupying or investing in commercial, retail andindustrial real estate. Jones Lang LaSalle has over 50 years of experiencein Asia Pacific, with over 18,500 employees operating in 75 offices in 13countries across the region.Jones Lang LaSalle is proud of the recognition we receive. Our recent accolades include Best <strong>Property</strong> Consultancy inAustralia and Asia Pacific at <strong>The</strong> Asia Pacific <strong>Property</strong> Awards 2011 in association with Bloomberg Television, and beingrecognised as the highest ranking real estate services firm in the Leaders category for <strong>The</strong> 2010 Global Outsourcing100.Our Energy and Sustainability Services consultants draw from lessons learned worldwide. We help extend sustainabilitystrategy and programs beyond altruism to align with broader business objectives to our clients. Backed by marketleadingproprietary databases and analytical models, Jones Lang LaSalle’s leading Research and Consulting team hasa successful track record of providing clients with practical solutions to complex problems.Jones Lang LaSalle’s experienced team can help you with the full range of real estate services including <strong>Property</strong> andAsset Management, Valuations and Advisory, Sales and Investments, Industrial, Leasing, Project and DevelopmentServices, Corporate Solutions and Integrated Facilities Management.CBRE delivers holistic sustainability solutions across all stages of the propertylife cycle. From acquisition and development to leasing, through all phases ofproperty and project management, CBRE works with clients to reduce waste,improve business efficiencies and build greater value into their asset, theirportfolio and their brand.CBRE is committed to helping the property industry reduce its resource impacts and greenhouse gas emissions. Wehave specialists across our business lines that can provide detailed advice on a wide variety of sustainability issues asthey apply to your business and your property.We help clients achieve sizable reductions in energy and water use through operational, capital, and behaviouralinterventions to improve efficiency and long term profit margins. We assist clients to meet changing legal requirementsand take advantage of increasing funding and innovation opportunities. We seek to raise awareness of sustainabilityinitiatives and build a better understanding of the impacts for owners, investors and occupiers.At CBRE we deliver a practical, business focussed approach to sustainability allowing you to improve the quality of thebuilt environment, achieve efficiency improvements, operational savings and add value to your property and portfolio.‘Building <strong>Better</strong> Returns’9
“Understanding the impactsof sustainability-relatedinvestments on long-term assetvalues holds catalytic power toscale the building refurbishmentmarket not only in Australia, butthroughout the world.”Robin RiedReal Estate & Urban DevelopmentWorld Economic Forum10 ‘Building <strong>Better</strong> Returns’
‘Building <strong>Better</strong> Returns’A Study of the Financial Performance of Green Office Buildings in AustraliaGraeme Newell: University of Western SydneyJohn MacFarlane: University of Western SydneyNils Kok: Maastricht UniversitySeptember 2011Details of AuthorsGraeme Newell is Professor of <strong>Property</strong> Investment at the University of Western Sydney. Graeme is activelyinvolved in applied property research and is a Fellow of the <strong>Australian</strong> <strong>Property</strong> <strong>Institute</strong>. He has researchedissues relating to sustainable commercial property in Australia, Asia, US and Europe.Email: g.newell@uws.edu.auJohn MacFarlane is Associate Professor at the University of Western Sydney. He has strong links to theproperty industry and is a Fellow of the <strong>Australian</strong> <strong>Property</strong> <strong>Institute</strong>. John has strong empirical analysisskills for the analysis of property data.Email: j.macfarlane@uws.edu.auNils Kok is Assistant Professor in Finance and Real Estate at Maastricht University, Netherlands. He has beenactively involved in the area of energy efficiency and sustainability in the property sector, focusing on theeconomic implications of resource consumption in buildings. Nils was co-author in the landmark report“Doing Well By Doing Good”, which was the first major US study on the financial performance of greenoffice buildings.Email: n.kok@maastrichtuniversity.nl‘Building <strong>Better</strong> Returns’11
Table of ContentsExecutive Summary 131. Importance of Sustainability and Green Office Buildings 142. Significance of Green Office Buildings in Australia 163. Current Research on Green Office Buildings 204. Project Description 225. Financial Performance of Green Office Buildings in Australia 255.1 NABERS: overall office market analysis 255.2 NABERS: specific office market analysis 325.3 Green Star: overall office market analysis 395.4 Summary of analysis of green office buildings 416. <strong>Property</strong> Industry Implications and Challenges 42Key References 44Key Websites 46Acknowledgments 4712 ‘Building <strong>Better</strong> Returns’
Executive SummarySustainability has taken on increased importance in the property industry in recent years at all levels of stakeholders,including governments, tenants, investors, developers, owners and the community. This has seen green officebuildings become a key feature of the commercial property landscape.While the broader benefits of sustainability are well known, the key challenge from a property industry andproperty investor perspective is the justification of the economic rationale and business case for green buildings,that is do green office buildings add value? Recent US research has identified rental, sale price and occupancypremiums for green office buildings.Using the National <strong>Australian</strong> Built Environment Rating Scheme (NABERS) energy and Green Star environmentalrating schemes, this project seeks to empirically investigate the financial performance of green office buildingsin Australia. This is the first rigorous empirical analysis done in this important area for <strong>Australian</strong> office property.<strong>The</strong> research sees a significant portfolio of green office buildings in Sydney and Canberra benchmarked against aportfolio of non-green office buildings, and the property financial performance premiums attached to green officebuildings empirically assessed, including rent, value, outgoings, yield and occupancy rate premiums. <strong>The</strong> addedvalueof green office buildings is clearly highlighted, with major insights regarding their financial performance.Key findings in this report include:1. A green premium in value for office buildings was evident for the NABERS energy rating. This saw the 5 starNABERS energy rating delivering a 9% green premium in value and the 3-4.5 star NABERS energy ratingsdelivering a 2-3% green premium in value.2. A clear link between enhanced green premiums in value with the higher rated NABERS energy rating categories.3. Green premiums in value differed in specific office markets, being most evident in the Sydney suburban officemarket (8% green premium) and the Canberra office market (21% green premium) in the 5 star NABERS energyrating category. This compares with the lesser impact in the Sydney CBD office market (4% green premium).4. Evidence of major discounts in value in the lower NABERS energy rating categories (less than 3 stars) for theSydney CBD (10% discount in value) and Canberra (13% discount in value).5. In the 5 star NABERS energy rating, the Canberra office market showed the largest green premium in value(21%), as well as the largest discount in value (13%) in the lowest NABERS energy ratings.6. <strong>The</strong> Green Star rating showed a green premium in value of 12%.7. Lesser impact was seen in the green premiums in rents for the NABERS energy ratings, with a 5% green premiumin rents evident for the Green Star rating.8. Major discounts in rents were evident in the lower NABERS energy ratings for the Sydney CBD (9% discount inrents) and Canberra (6% discount in rents).9. In the 5 star NABERS energy rating, the Sydney CBD office market showed the largest green premium in rents(3%), as well as the largest discount in rents (9%) in the lowest NABERS energy rating.10. Green premiums were also evident in reduced vacancy, reduced outgoings, reduced incentives and reducedyields, particularly at the higher rated NABERS energy categories.11. <strong>The</strong>se office market green premiums in values and rents for Green Star and the top 5 star NABERS energyrating are generally comparable to that seen in recent US green office building studies (eg: Eichholtz et al,2010b).Fuller details are given in the body of this report.Overall, the results clearly highlight the added value of green office buildings in Australia, particularly at thehigher levels of the NABERS energy ratings and Green Star.<strong>The</strong> property industry implications and future challenges for green office buildings in Australia are also identified.‘Building <strong>Better</strong> Returns’13
1. Importance of Sustainabilityand Green Office BuildingsSustainability has taken on increased importance in recent years at all levels of stakeholders, includinggovernments, tenants, investors, developers, owners and the community. This has seen increased awarenessinternationally that sustainability is a high priority. In particular, the property industry has a major impact onthe environment, with buildings contributing up to 23% of CO2 emissions, 40% of energy requirements, 16%of water usage, 30% of solid landfill waste, 40% of raw materials and 71% of electricity consumption (CIE,2007).Legislation regarding sustainability has also been introduced at the international, national and local levels,including the Kyoto Protocol, UN Principles of Responsible Investment and the EU Directive on EnergyPerformance of Buildings. In Australia, the introduction of the Federal Government’s Building Energy EfficiencyDisclosure Bill 2010 has seen the mandatory disclosure of greenhouse performance for commercial buildingsupon lease or sale impacting on both new and existing properties from November 2010, with Building EnergyEfficiency Certificates required from November 2011. Similarly, government policy will require minimumenergy ratings for government tenants from 2011. This is also seen in the broader context of the proposedcarbon price to be introduced by the Federal Government as part of the Clean Energy Future package.This focus on sustainability has seen key groups established to champion the sustainability agenda. At aninternational level this includes the UN Environment Program Finance Initiative, World Green BuildingCouncil, Carbon Disclosure Project and the Institutional Investors Group on Climate Change, with these groupsoften having a strong property mandate. At an <strong>Australian</strong> level, this includes the Green Building Council ofAustralia and the Investor Group on Climate Change; as well as active support from the professional propertyorganisations, including the <strong>Australian</strong> <strong>Property</strong> <strong>Institute</strong> (API), <strong>Property</strong> Funds Association of Australia (PFA)and <strong>Property</strong> Council of Australia (PCA). Superannuation funds in Australia have also actively supported thesustainability agenda by prioritising sustainable commercial property.Importantly, the property industry in Australia has actively contributed to this sustainability agenda in thecontext of their corporate social responsibility strategies. This has seen a large number of property investorseffectively integrate sustainability into their business platform at all levels of their commercial activities,this including both the larger property players as well as the smaller property players. <strong>The</strong> original focuson risk reduction and future proofing, driven by the sustainability legislation, has also been expanded toa fuller articulation of the business case in the context of corporate social responsibility. This has resultedin the language of sustainability becoming a fundamental part of the language of the property industry,including responsible property investing and socially responsible property investing. Importantly, many<strong>Australian</strong> property companies and A-REITs are amongst the leading property players globally in championingthe sustainability agenda for property. <strong>The</strong> establishment of the green building rating schemes in Australia,Green Star and NABERS, are also key ingredients for advancing the sustainability agenda in the propertyindustry in Australia.With CBD office buildings being the key focus and engine room of economic and financial activity in Australia,the <strong>Australian</strong> office sector accounts for over 23.8 million square metres of office space, across the variousCBDs (over 16 million square metres) and non-CBDs (over 7.5 million square metres) in July 2011 (PCA, 2011).Many of the new office buildings have been green office buildings, with the major property investors activelyinvolved in this area. While the broader benefits of sustainability for commercial property are well known(see Table 1), the key challenge from a property industry and property investor perspective is the justificationof the economic rationale and business case for green office buildings. That is, do green office buildings addvalue? Recent US research has analysed a major portfolio of US green office buildings, identifying rental, saleprice and occupancy premiums for green office buildings, with this key issue yet to be rigorously assessed inan <strong>Australian</strong> green office building context.14 ‘Building <strong>Better</strong> Returns’
Table 1. Benefits of sustainable commercial propertyEnergy and water cost savingsCompany brand differentiationCapital cost savingsEnhanced valueImproved marketabilityFaster lease-up periodHigher tenant retentionImproved reputation/profileEnhanced work environmentEligible to SRI/ESG fund mandatesReduced liability/riskFuture proofingEligible for government tenantsCompliance with office grading schemesRelevance to non-government tenantsPersonal commitment to ESD and CSRCompliance with government regulations<strong>Property</strong> brand differentiationSource: Authors’ compilationAs such, this project seeks to examine the financial performance of green office buildings in Australia.Subsequent sections of this report examine the significance of green office buildings in Australia, as well asempirically assessing the added value of green office buildings for their financial performance benchmarkedagainst a non-green office building portfolio. <strong>The</strong> ongoing implications and challenges for the <strong>Australian</strong>property industry are also highlighted.“Resource constraints and sustainability drivers mean the asset valuationgame is changing. Reports such as Building <strong>Better</strong> Returns will informmore robust valuations in future and are critically important if institutionalinvestors are to navigate a changing investment environment.”Nathan FabianChief ExecutiveInvestor Group on Climate Change‘Building <strong>Better</strong> Returns’15
2. Significance of Green OfficeBuildings in Australia<strong>The</strong> sustainability agenda in the property industry and green office buildings in Australia have been significantdevelopments in recent years. This has been driven at all levels; the individual property level, corporatelevel and external environment level (eg: legislation, standards, government incentives, environmental costs,consumer demands).In particular, at the Federal Government level the Building Energy Efficiency Disclosure Act 2010 has seen theintroduction of the mandatory disclosure of NABERS ratings and Building Energy Efficiency Certificates for theselling and leasing of office space of 2000 square metres or more. This has been further supported by theGreen Building Fund for green retrofitting of existing office buildings and the proposed Tax Breaks for GreenBuildings scheme. At the local level, this agenda has also been supported by various initiatives including theSustainable Melbourne Fund and the “1200 Buildings” program in Victoria.<strong>The</strong> establishment of green building rating schemes in Australia have also been key ingredients in thesuccess of the green building agenda in recent years. This has seen the Green Star and NABERS ratingschemes as key initiatives to evaluate the environmental design and environmental performance of officebuildings. NABERS and Green Star encompass a range of office building criteria, cover the various propertytypes and are comparable to the international green building benchmarks in the US and UK, for exampleLEED (Leadership in Energy and Environmental Design), Energy Star) and the BREEAM (Building ResearchEstablishment Environmental Assessment Method), respectively. Importantly, both the NABERS and GreenStar rating schemes have been actively supported by the property industry in Australia and have transformedAustralia’s property and construction markets.Green Star is a comprehensive, national, voluntary environmental rating scheme that evaluates theenvironmental design and construction of buildings. Table 2 highlights the key features of the Green Starrating scheme, with Table 3 highlighting selected major office buildings throughout Australia that haveachieved the 6-star Green Star rating.NABERS is a performance-based rating scheme for existing buildings, using measured annual operationalimpacts on the environment, including greenhouse gas emissions and water consumption. General detailsof the NABERS rating scheme are given in Table 4. Major office buildings that have received the top levelNABERS energy ratings are also given in Table 5.<strong>The</strong> establishment of the quarterly IPD/PCA Green <strong>Property</strong> Investment Index in 2011 has also expanded theperformance analysis perspective of the benefits of green office buildings in Australia.Importantly, the property industry in Australia has actively supported the green building agenda at all levels.This has seen <strong>Australian</strong> property companies and REITs figure prominently in the various global corporatesocial responsibility (CSR) performance measures, including the FTSE4Good Index, Dow Jones WorldSustainability Index and Global 100. <strong>The</strong>se <strong>Australian</strong> property players are also rated highly in independentassessments in specific aspects of CSR, for example the Environmental Real Estate Index (Kok et al, 2010) andCarbon Disclosure Leadership Index, as well as being regular recipients of various major property industryCSR awards and government CSR awards. Overall, this reflects strong local and global leadership by theproperty industry in Australia in championing the green office building agenda.16 ‘Building <strong>Better</strong> Returns’
Table 2. Green Star rating scheme: profile: 2011Established 2003 by Green Building Council of AustraliaCategories assessed• management• indoor environment quality• energy• transport• water• materials• land use and ecology• emissions• innovationCertified ratings6 star: World leadership (score: 75-100)5 star: <strong>Australian</strong> excellence (score: 60-74)4 star: Best practice (score: 45-59)Rating tools• Office as built (V2)• Office interiors (V1)• Retail• Education• Multi-unit residential• Office design (V2)• Office (V3)• Industrial• Healthcare• Public buildingsNumber of certified projects: 357, with 96 projects certified in the last 12 monthsNumber of certified office projects: 314Over 5 million square metres of Green Star-certified space across Australia and over 8 million square metres ofGreen Star-registered space across AustraliaNumber of registered projects: 407Certified project ratings (# = 321)• 6 star: 49• 5 star: 152• 4 star: 120Certified projects (# = 357): by state• NSW: 24%• Victoria: 28%• Queensland: 23%• South Australia: 11%• ACT: 7%• Western Australia: 6%• Northern Territory: 1%• Tasmania: 1%Certified projects (# = 306): by rating tool (major)• Office design: 195• Office as built: 7• Office interior: 62• Education: 24Source: GBCA website‘Building <strong>Better</strong> Returns’17
Table 3. 6-star Green Star ratings: selected office buildingsSydney:1 Shelley Street1 Bligh Street39 Hunter Street100 Market StreetDarling Quarter, 1-25 Harbour Street<strong>The</strong> Ark, 16-40 Mount StreetWorkplace6, 44 Pirrama RoadMelbourne:200 Victoria StreetANZ, 833 Collins StreetCouncil House 2, 218-242 Little Collins StreetSzencorp Building, 40 Albert Street<strong>The</strong> Gauge, 825 Bourke StreetPixel, Building 9, <strong>The</strong> BreweryBrisbane:123 Albert Street33 Breakfast Creek Road512 Wickham StreetKing George Central, 145 Ann StreetGreen Square North Tower, 515 St Paul’s TerraceSantos Place, 32 Turbot StreetPerth:2 Victoria StreetCanberra:9/31 City West Offices AEI Office, Trevor Pearcey House, 34 Thynne StreetAdelaide:SA Water House, 250 Victoria SquareSource: GBCA website18 ‘Building <strong>Better</strong> Returns’
Table 4. NABERS rating scheme: profile: 2011Established in 1999 and managed nationally by the NSW Office of Environment and HeritageGoal of the NABERS rating scheme is to encourage innovation and market best practice to achieve positiveenvironmental outcomes, including lower greenhouse gas emissions, reduced water consumption, less waste andhealthier working environmentsRating scheme5 star: excellent4 star: very good3 star: goodRatingsEnergyWaterWasteSource: NABERS website2.5 star: median2 star: below everage1 star: poorIndoor environmentCommuter transportNABERS rating scheme was extended to 6 stars in August 2011, adding 6 star market leading. 6 star is calculated as50% of the emissions or resource use of 5 star performance for Energy and Water ratings. 5.5 star is calculated as 75%of the emissions or resource use of 5 star performance.Rating typeTenancy Base building Whole buildingRating sectorsOfficeHotelRetailResidentialNumber of office buildings rated: 962Table 5. 5.5-6 star NABERS energy rated offices : Office Base Building*NSW:76 Berry Street, North Sydney60 Burelli Street, WollongongLegion House, 161 Castlereagh Street, SydneyQuad 4, 8 Parkview Drive, HomebushVictoria:Centrelink Office, 69 Heygarth Street, Echuca2 Nexus Court, MulgraveQueensland:Police Barracks Building 1, 61 Petrie Terrace, BrisbaneWestern Australia:Nexus Corporate, 37 Dunlop Road, Mulgrave158 Hume Street, Toowoomba100 St Georges Terrace, PerthNorthern Territory:Darwin Plaza, 41 <strong>The</strong> Mall, DarwinJacana House, 39 Woods Street, DarwinAn additional 50 office buildings across NSW, Victoria, Queensland, Western Australia, South Australia, ACT, Tasmaniaand Northern Territory have also achieved a 5 star NABERS energy rating* This table is the current NABERS list using the August 2011 data which includes the update to a 6 star NABERS energyrating system. All analyses completed in this report used the previous 5 star NABERS energy rating categoriesSource: NABERS website‘Building <strong>Better</strong> Returns’19
3. Current Research on GreenOffice BuildingsMuch of the earlier property research on sustainability was descriptive and focused on issues such as thevaluation implications, green leases, energy performance certificates, energy savings and benefits, and thecost premium of LEED-certification. Critically, the original focus by property players on risk reduction andfuture proofing, driven by sustainability legislation, has now been expanded to a fuller assessment of thereturn advantage of green office buildings. While the return advantage was initially based on anecdotalevidence and case studies, this has changed considerably since 2008, with the rigorous empirical assessmentof this business case for green office buildings using extensive commercial property portfolios. <strong>The</strong> report byEichholtz et al (2010a) was a key ingredient in systematically justifying the economic rationale and businesscase for green office buildings by rigorously analysing a major portfolio of US green office buildings from theCoStar database, regarding rent, sale price and occupancy premiums.This key research was subsequently supported by other US green building research that empirically assesseda range of office property performance measures, including rent, sale price, vacancy and productivity, todemonstrate the business case and premium for green office buildings (eg: Dermisi, 2009; Eichholtz et al,2010b; Fuerst, 2009; Fuerst and McAllister, 2009, 2011; Miller et al, 2008, 2009; Wiley et al, 2010). Thisempirical research focused on US green office buildings and compared portfolios of green office properties(eg: LEED, Energy Star) with non-green office property portfolios. Control variables were used where possibleto account for differences in the office properties - this typically included age, size, building quality, numberof stories, amenities and location. This was to ensure a “pure” green effect in identifying price and rentalpremiums for green office buildings.Table 6 provides a summary of the results of this previous US green office building research to give a sense ofthe scale of the premiums seen for green office buildings for the various property performance parametersin these studies. While analyses were done at different times and using different models, the consensus viewfrom this US green building research is the presence of rental, sale price and occupancy premiums for greenoffice buildings.<strong>The</strong> following sections will assess this green premium issue for office buildings in Australia for a range ofproperty financial performance measures.20 ‘Building <strong>Better</strong> Returns’
Table 6. Summary of previous US green office building resultsReport Rental premium Sale price premiumOccupancy ratepremiumMiller et al (2008) 9% No premium 2-4%Eichholtz et al (2010a)Energy Star: 3.3%LEED: No premiumEnergy Star: 19%LEED: No premiumNAEichholtz et al (2010b)Energy Star: 2.1%LEED: 5.8%Energy Star: 13%LEED: 11.1%NAPivo and Fisher (2010) 2.7% 8.5% NAWiley et al (2010)Energy Star: 7-9%LEED: 15-17%NAEnergy Star: 10-11%LEED: 16-18%Fuerst and McAllister(2011)4-5% 25-26%Energy Star: 1-3%LEED: No premium‘Building <strong>Better</strong> Returns’21
4. Project DescriptionOffice building portfolio 2Using a portfolio of Green Star and NABERS rated office buildings in Sydney and Canberra, these greenoffice buildings were benchmarked against a portfolio of non-green office buildings in similar markets, andthe property performance premium attached to green office buildings empirically assessed. <strong>The</strong> financialperformance measures included were rent, value, outgoings, yields, incentives and occupancy rate premiums.<strong>The</strong> property-specific data was provided by Jones Lang LaSalle and CBRE. <strong>The</strong> green building features forthese office buildings were provided by the NSW Office of Environment and Heritage (NABERS) and theGreen Building Council of Australia (Green Star).This saw a portfolio of 206 NABERS rated office buildings and 160 non-NABERS rated office buildings inSydney and Canberra assessed as at the March Quarter 2011. Green office buildings were those classifiedwith a NABERS energy rating of 3 stars or higher and those that have achieved a Green Star rating (4, 5,6 stars). Overall, this sees 40% of office buildings in Sydney/Canberra assessed, representing 51% of theSydney/Canberra total office market floor area. This floor area market coverage included Sydney CBD (59%coverage), Sydney suburban (45% coverage) and Canberra (43% coverage). Over 97% of the office propertiesanalysed had an area exceeding 2000 square metres. Similarly, this analysis sees 54% of NABERS rated officeproperties included in this analysis, including Sydney CBD (68% coverage), Sydney suburban (49% coverage)and Canberra (38% coverage).For Green Star, an analysis using 23 4-6 Green Star rated office buildings for the office design and officeas built categories was used, with this Green Star portfolio limited by the amount of rental informationavailable. This Green Star portfolio comprised the Sydney CBD (22%), Sydney suburban (39%) and Canberra(39%), with Green Star ratings of 4 star (43%), 5 star (48%) and 6 star (9%).This coverage of both NABERS rated and Green Star rated office buildings is considered sufficient to enable areliable analysis to be conducted to assess the extent of the green premium in these office markets.A key ingredient in this research is to ensure that the green premium is not just a reflection of the greenoffice buildings being newer buildings. As such, differences in specific office building characteristics wereincluded in the analyses to control for these office building differences. This included differences in size,quality and location. By accounting for these factors in this analysis, pure green premiums in these officeproperty performance characteristics can be explicitly identified for green office buildings.Table 7 provides details of a comparison of the current NABERS rated office building portfolio and the non-NABERS rated office building portfolio used in this study. Of the 206 NABERS rated office buildings, SydneyCBD accounted for 90, Sydney suburban accounted for 91 and Canberra accounted for 25 NABERS ratedoffice buildings. Representation was also evident across the office building quality levels of premium/A, Band C grades.1. Some office buildings are NABERS rated, but specify that their NABERS rating not be publically disclosed; they were treated asnon-NABERS rated office buildings if included in this study as they can not be explicitly identified as NABERS rated office buildings.22 ‘Building <strong>Better</strong> Returns’
Table 7. Profile of green and non-green office building portfolios*ProfileNumber of green officebuildings (NABERS)Number of non-greenoffice buildings (non-NABERS)Total number of officebuildingsRegionSydney CBD 90 58 148A 55 10 65B 27 26 53C 8 22 30Sydney suburban** 91 69 160A 50 27 77B 26 19 45C 15 23 38Canberra 25 33 58A 17 15 32B 7 9 16C 1 9 10GradeA 122 52 174B 60 54 114C 24 54 78TOTAL 206 160 366* Premium and A grade are grouped for purposes of analysis** Sydney suburban comprises North Sydney, Parramatta, Chatswood, St. Leonards, South Sydney,Norwest, Macquarie Park, Rhodes and Homebush BayMethod of analysisHedonic regression analysis is the methodology used in this study. It is the standard method for examiningprice determinants in property, by controlling for other factors that are reflected in differences in specificoffice buildings. <strong>The</strong>se office building factors included size, building quality and location. It also explicitlyincorporated whether the office building had a Green Star and/or NABERS energy rating. This regressionprocedure was typically done by including quantitative variables (eg: size) and qualitative dummy variables(eg: Green Star rating: 1=yes, 0=no) in the hedonic regression model as independent variables to assess theproperty performance (eg: rent, value) as the dependent variable. <strong>Property</strong> performance variables assessedfor the presence of a green premium were gross rent, value, vacancy, incentives, yields and outgoings. Overall,this hedonic regression process enabled the explicit identification of a pure green office building premium,after controlling for these other office building factors. It is also consistent overall with the methodology usedin the various previous US green office building studies.Table 8 provides details regarding these various office building characteristics and the specific office propertycharacteristics assessed, and how they are incorporated into the various models to assess the extent of thegreen office building premium. 22 Sydney suburban comprises North Sydney, Parramatta, Chatswood, St. Leonards, South Sydney, Norwest, Macquarie Park, Rhodes andHomebush Bay. <strong>The</strong>y were aggregated into Sydney suburban to ensure sufficient properties were available for a rigorous analysis.‘Building <strong>Better</strong> Returns’23
Table 8. Office building characteristics in regression modelsGross rent: $ per square metre; log value analysedValue:$ per square metre; log value analysed; using a constructed proxy which incorporatesgross rent, vacancy, incentives, outgoings and yieldsVacancy: %Incentives: number of months on 10-year lease; log value analysedYield: %Area:square metres; net lettable office spaceGrade:Premium/A, B, CLocation: Sydney CBD, Canberra, North Sydney, Parramatta, Chatswood, St. Leonards, SouthSydney, Norwest, Macquarie Park, Rhodes, Homebush BayNABERS energy: 0 to 5 stars; classified as no rating or respective NABERS energy ratingGreen Star: yes, noThis process gives the following general hedonic regression model (eg: for rent premium) for this study:Log Rent = b 0+ b 1X 1+ … + b nX n+ c 1NABERS + c 2AREAwhere: Rent=rent per square metre (log transformation used for data stability issues)X 1, X 2,…, X n= office building characteristics (eg: grade, location); a location by gradecross-classification was used for a fuller and more precise identification of the green premiumsNABERS= NABERS energy ratingb 1, b 2,…, b n, c 1, c 2= estimated regression coefficients.In addition to the NABERS energy rating, an equivalent model for the Green Star ratings was also applied. Thissees separate analyses done for the NABERS energy ratings and Green Star ratings.<strong>The</strong> resulting regression coefficients for the Green Star rating and NABERS energy rating give the percentagepremiums attached to these rating schemes in a green office building compared to the benchmark officebuildings without green building rating schemes.Overall, this statistical analysis process has enabled the rigorous empirical assessment of green office buildingpremiums and has assessed the financial performance of green office buildings in Australia to demonstrateand quantify their added-value financial performance. Importantly, the signs of these regression coefficientsobtained were generally in accord with practical expectations, further adding to the robustness of the analysisin this study.24 ‘Building <strong>Better</strong> Returns’
5. Financial Performance of GreenOffice Buildings in Australia5.1 NABERS energy rating: overall office market analysisThis section examines the significance of the added value of green office buildings for various propertyfinancial performance characteristics using the NABERS energy ratings. Table 9 presents the correlationsbetween the various characteristics, particularly highlighting the role of area and the need to explicitly controlfor area differences for a comprehensive and incisive analysis.Table 9. Correlations between office building characteristicsPanel A: All office buildings (366 office buildings)Area Rent Incentives Outgoings Vacancy Value NABERSArea 1.00Rent 0.66 1.00Incentives -0.00 0.29 1.00Outgoings 0.48 0.84 0.45 1.00Vacancy -0.18 -0.08 0.04 -0.05 1.00Value 0.70 0.93 0.02 0.65 -0.21 1.00NABERS 0.26 0.13 -0.09 -0.03 -0.39 0.24 1.00Panel B: NABERS rated office buildings (206 office buildings)Area Rent Incentives Outgoings Vacancy Value NABERSArea 1.00Rent 0.69 1.00Incentives 0.02 0.26 1.00Outgoings 0.58 0.88 0.40 1.00Vacancy -0.16 0.01 0.27 0.09 1.00Value 0.72 0.94 -0.00 0.73 -0.13 1.00NABERS 0.26 0.13 -0.09 -0.03 -0.39 0.24 1.00Panel C: Non-NABERS rated office buildings (160 office buildings)Area Rent Incentives Outgoings Vacancy ValueArea 1.00Rent 0.41 1.00Incentives -0.15 0.30 1.00Outgoings 0.11 0.73 0.51 1.00Vacancy -0.17 -0.12 -0.09 -0.13 1.00Value 0.47 0.87 -0.05 0.40 -0.30 1.00To assess the added value of green office buildings, the office building portfolios were classified as no NABERSenergy rating (benchmark non-green office building portfolio), NABERS energy rating of 2.5 stars or less andNABERS energy rating of 3 stars or more. Similarly, to assess the impact of a higher NABERS energy rating,the NABERS ratings were separately analysed for ratings of 2-2.5 stars, 3-3.5 stars, 4-4.5 stars and 5 stars. Allgreen office building premiums are expressed as a percentage relative to the benchmark non-green officebuildings.‘Building <strong>Better</strong> Returns’25
To determine the added value of green office buildings, Table 10 presents the green office building premiumsfor the NABERS energy ratings across the Sydney/Canberra office markets for the six property performancecharacteristics. Panel B provides the fuller analysis as it determines these green premiums after controllingfor the size (net lettable area) of the office buildings. Key features include:1. A premium of approximately 2% in value is seen for the higher NABERS rated office buildings (3 stars orhigher), with a discount of approximately 4% seen for the lower NABERS rated office buildings (2.5 starsor less).2. Lesser impact is evident in rental premiums for green office buildings; less than 1%.3. Higher NABERS rated office buildings see green premiums for reduced vacancy (4%), reduced outgoingsand reduced yields; this is not seen in the lower NABERS rated office buildings which typically see a discountfor these property performance factors.Overall, these results are positive for a consensus view regarding premiums shown for green office buildings,with the impact of green premiums being most evident in the higher NABERS energy rating categories of3 stars or more. <strong>The</strong>se results also highlight the presence of a discount for those office buildings with lowNABERS energy ratings.Table 10. Green office building premiums: NABERS*Panel A: NABERS energy ratingNABERS rating(2.5 stars or less)NABERS rating(3 stars or more)Gross rent 2.0% 2.1%Value -2.5% 5.5%Vacancy 2.5% -4.9%Incentives 5.1% 1.3%Yield 0.1% -0.1%Outgoings 5.0% 0.9%Panel B: NABERS rating (adjusting for area)NABERS rating(2.5 stars or less)NABERS rating(3 stars or more)Gross rent 1.4% 0.3%Value -3.8% 1.9%Vacancy 2.8% -3.9%Incentives 5.7% 2.8%Yield 0.1% -0.1%Outgoings 4.1% -1.3%* green premiums given are relative to the benchmark non-green office buildings26 ‘Building <strong>Better</strong> Returns’
To more fully assess the added value impact of higher NABERS energy ratings on the financial performance ofgreen office buildings, it is necessary to segment the analysis into the various NABERS energy rating levels. Assuch, Table 11 presents the impact of a higher NABERS energy rating on financial performance. Key featuresinclude:1. <strong>The</strong> green premium impacts in value are most evident in the higher NABERS energy ratings, particularly inthe 5 star NABERS energy rating category. This sees a 9% premium in value for the 5 star NABERS energyrating, compared to premiums of 1-3% in the lesser NABERS energy rating categories. NABERS energyratings of 3-4.5 showed similar green premiums of 2-3% in value, with the major green premium in value(9%) seen in the NABERS 5 star energy rating category. See Figure 1.2. Green premiums in the top NABERS energy rating categories also apply for reduced vacancies (Figure 2),reduced incentives (Figure 3), reduced outgoings (Figure 4) and reduced yields (Figure 5). In most cases, thegreen premium was clearly most evident in the 5 star NABERS energy rating category. While the NABERSenergy 5 star yield premium may be small (-0.15%), this converts to a substantive change in value.3. Lesser impact is seen for the rent premiums, being less than 1% in all NABERS energy categories;see Figure 6.Table 11. Green office building premiums: impact of NABERS energy rating*Panel A: NABERS energy rating2/2.5 3/3.5 4/4.5 5Gross rent 1.3% 1.3% 1.7% 2.4%Value 2.2% 4.4% 6.4% 12.8%Vacancy -4.4% -5.1% -7.8% -6.8%Incentives 5.3% 1.6% 0.6% -1.5%Yield 0.00% -0.08% -0.13% -0.22%Outgoings 5.5% 3.2% -0.3% -4.3%Panel B: NABERS rating (adjusting for area)2/2.5 3/3.5 4/4.5 5Gross rent 0.9% 0.2% -0.3% 0.6%Value 1.1% 2.5% 2.6% 8.7%Vacancy -4.1% -4.7% -6.7% -5.7%Incentives 5.8% 2.4% 2.1% 0.2%Yield 0.00% -0.04% -0.05% -0.15%Outgoings 5.3% 1.7% -2.7% -6.5%* green premiums given are relative to the benchmark non-green office buildings‘Building <strong>Better</strong> Returns’27
10.0% Figure 1: Value Premium (%) by NABERS Ra:ng 9.0% 8.0% Value Premium (%) 7.0% 6.0% 5.0% 4.0% 3.0% 2.0% 1.0% 0.0% 2/2.5 3/3.5 4/4.5 5 NABERS Ra:ng Figure 1 shows the increasing green premiums in value with increasing NABERS energy rating.0.0% Figure 2: Vacancy Premium (%) by NABERS Ra
7.0% Figure 3: Incen,ve Discount (%) by NABERS Ra,ng 6.0% Incen,ve Discount (%) 5.0% 4.0% 3.0% 2.0% 1.0% 0.0% 2/2.5 3/3.5 4/4.5 5 NABERS Ra,ng Figure 3 shows the reduced incentives with increased NABERS energy rating.Figure 4: Outgoings Premium/Discount (%) by NABERS Ra@ng 6.0% Outgoings Premium/Discount (%) 4.0% 2.0% 0.0% -‐2.0% -‐4.0% -‐6.0% -‐8.0% 2/2.5 3/3.5 4/4.5 5 NABERS Ra@ng Figure 4 shows the reduced outgoings with increased NABERS energy rating.‘Building <strong>Better</strong> Returns’29
0.00% Figure 5: Yield Premium (%) by NABERS Ra;ng -‐0.02% -‐0.04% Yield Premium (%) -‐0.06% -‐0.08% -‐0.10% -‐0.12% -‐0.14% -‐0.16% 2/2.5 3/3.5 4/4.5 5 NABERS Ra;ngs Figure 5 shows the reduced yields with increasing NABERS energy rating.1.0% Figure 6: Gross Rent Premium/Discount (%) by NABERS Ra?ng Gross Rent Premium/Discount (%) 0.8% 0.6% 0.4% 0.2% 0.0% -‐0.2% -‐0.4% 2/2.5 3/3.5 4/4.5 5 NABERS Ra?ng Figure 6 shows the impact of increased NABERS energy rating on gross rents.30 ‘Building <strong>Better</strong> Returns’
10.0% Figure 7: Premiums/Discounts (%) by Category for NABERS Ra>ng Groups 8.0% Premium/Discount (%) 6.0% 4.0% 2.0% 0.0% -‐2.0% -‐4.0% -‐6.0% -‐8.0% 2/2.5 3/3.5 4/4.5 5 NABERS Ra>ng Gross rent Incen4ves Outgoings Vacancy Yield Value Figure 7 shows the premiums or discounts attached to the various NABERS energy ratings.Overall, this analysis has highlighted the presence of green premiums for NABERS energy-rated office buildings.This impact is most evident in the higher NABERS energy rating categories, particularly with increased values,more so than for increased rent premiums. <strong>The</strong> significant green premiums were particularly highlighted inthe NABERS 5 star energy rating, with the low NABERS energy ratings often seeing the presence of a discountto the overall office market. <strong>The</strong> impact is generally smaller than that seen in equivalent US studies (seeTable 6), except at the higher level of NABERS energy rating where the green premiums are comparableto those seen in recent US green office building studies (eg: Eichholtz et al, 2010b). Importantly, based onthis NABERS energy rating analysis, the consensus view is that of green premiums across a number of keyproperty financial performance factors, particularly at the higher NABERS energy ratings. It also highlightsthe important issue of discounts for office buildings with low NABERS energy ratings.‘Building <strong>Better</strong> Returns’31
5.2 NABERS energy rating: specific office market analysisAs well as the overall analysis, it is important to also assess the green office building premiums in specificoffice markets. This was conducted for the Sydney CBD, Sydney suburban and Canberra office markets.Table 12 presents the analysis of green office building premiums for the Sydney CBD office market.Key features include:1. Less evidence of green premiums is seen in the Sydney CBD office market. This largely reflects the fullerincorporation of NABERS, green buildings and the sustainability legislation in the Sydney CBD compared tobenchmarking against a lesser sized comparable non-green office building portfolio ( see Table 7).2. A marginal green premium is seen in values for the higher NABERS energy categories.3. <strong>The</strong> main green premium is seen in reduced outgoings (3.4%) for the higher NABERS energy categories.4. <strong>The</strong> lower rated NABERS categories see a major discount in value (8.4%).Table 12. Green office building premiums: Sydney CBD*Panel A: NABERS energy ratingNABERS rating(2.5 stars or less)NABERS rating(3 stars or more)Gross rent -3.9% -0.2%Value -8.6% 4.6%Vacancy 1.4% -1.2%Incentives 3.0% 2.2%Yield 0.1% 0.0%Outgoings -1.1% -3.2%Panel B: NABERS energy rating (adjusting for area)NABERS rating(2.5 stars or less)NABERS rating(3 stars or more)Gross rent -3.9% -1.9%Value -8.4% 0.3%Vacancy 1.4% -0.2%Incentives 3.1% 3.1%Yield 0.1% 0.0%Outgoings 0.3% -3.4%* green premiums given are relative to the benchmark non-green office buildings32 ‘Building <strong>Better</strong> Returns’
Table 13 presents the impact of a higher NABERS energy rating on the financial performance for green office buildingsin the Sydney CBD office market. Key features include:1. Evidence of green premiums in value for higher NABERS energy categories, for example over a 4% premium in valuesin the 5 star NABERS energy category, with discounts in the lower NABERS energy categories (eg: 10% discount invalues in the lowest category of 2-2.5 stars).2. A rental premium is seen in the 5 star NABERS energy category (3%); with a major rental discount in the lowestNABERS energy category (9%). <strong>The</strong> extent of these rental premiums and discounts for the Sydney CBD office marketwere more significant than those seen for the Sydney suburban and Canberra office markets.3. An overall consistent trend of improved green premiums with increased NABERS energy ratings, particularly forvalues and rents. This particularly highlights the more significant green premiums seen in the 5 star NABERS energycategory across the various property financial performance characteristics.Table 13. Green office building premiums: impact of NABERS energy rating: Sydney CBD*Panel A: NABERS energy rating2/2.5 3/3.5 4/4.5 5Gross rent -9.2% -5.4% 1.0% 4.9%Value -10.4% 0.9% 6.2% 12.3%Vacancy -1.0% -2.8% -2.6% 4.8%Incentives 6.2% 3.2% 2.7% -0.5%Yield 0.0% 0.0% -0.1% -0.2%Outgoings -5.2% -4.9% -3.1% -4.5%Panel B: NABERS energy rating (adjusting for area)2/2.5 3/3.5 4/4.5 5Gross rent -8.5% -5.7% -0.5% 2.7%Value -9.8% -1.9% 2.0% 4.2%Vacancy -1.2% -2.2% -1.3% 7.3%Incentives 6.0% 3.5% 3.5% 1.1%Yield 0.0% 0.0% 0.0% -0.1%Outgoings -2.7% -4.5% -3.5% -5.3%* green premiums given are relative to the benchmark non-green office buildings‘Building <strong>Better</strong> Returns’33
Table 14 presents the analysis of green office building premiums for the Sydney suburban office market. Keyfeatures include:1. A clearer separation of green premiums between the higher and lower NABERS energy categories.2. A 3% premium in values for the higher rated NABERS energy category, compared to a 5% discount in valuesin the lower NABERS energy category.3. A 3.2% green premium in rents is seen in the higher NABERS energy category.4. Similarly, green premiums are seen for reduced vacancy and reduced yields in the higher NABERS energycategory.Table 14. Green office building premiums: Sydney suburban*Panel A: NABERS energy ratingNABERS rating(2.5 stars or less)NABERS rating(3 stars or more)Gross rent 2.5% 3.5%Value -4.3% 4.0%Vacancy 4.8% -4.8%Incentives 3.2% 0.8%Yield 0.1% -0.1%Outgoings 2.4% 2.0%Panel B: NABERS energy rating (adjusting for area)NABERS rating(2.5 stars or less)NABERS rating(3 stars or more)Gross rent 2.3% 3.2%Value -4.7% 3.0%Vacancy 5.2% -3.9%Incentives 3.5% 1.5%Yield 0.1% -0.1%Outgoings 2.2% 1.5%* green premiums given are relative to the benchmark non-green office buildings34 ‘Building <strong>Better</strong> Returns’
Table 15 presents the impact of a higher NABERS energy rating on the financial performance for green officebuildings in the Sydney suburban office market. Key features include:1. Clear evidence of an increased green premium in values for the higher NABERS energy categories, forexample a 8% green premium for the 5 star NABERS energy category. This was also evident in other NABERScategories to a lesser but still important degree, for example a 6% green premium in the 4/4.5 star NABERSenergy category.2. Major premiums for the higher NABERS energy categories for reduced vacancy, reduced yields and reducedoutgoings.3. Evidence of rent premiums in all of the NABERS energy categories, but being less evident at the 5 star level.Table 15. Green office building premiums: impact of NABERS energy rating: Sydney suburban*Panel A: NABERS energy rating2/2.5 3/3.5 4/4.5 5Gross rent 3.6% 4.4% 3.7% 0.6%Value 3.8% 4.7% 6.8% 8.7%Vacancy -6.0% -3.2% -11.3% -9.9%Incentives 0.2% -1.5% 1.6% -2.3%Yield 0.0% -0.1% 0.1% -0.2%Outgoings 3.8% 5.5% 1.5% -3.3%Panel B: NABERS energy rating (adjusting for area)2/2.5 3/3.5 4/4.5 5Gross rent 3.4% 4.2% 3.3% 0.2%Value 3.7% 4.2% 5.9% 7.7%Vacancy -5.8% -2.7% -10.5% -9.1%Incentives 0.5% -1.1% 2.2% -1.7%Yield 0.0% -0.1% -0.1% -0.2%Outgoings 3.5% 5.2% 0.9% -3.9%* green premiums given are relative to the benchmark non-green office buildings‘Building <strong>Better</strong> Returns’35
Table 16 presents the analysis of green office building premiums for the Canberra office market. Key featuresinclude:1. Clear evidence of an increased green premium in values for the higher NABERS energy category, that is a9% premium, compared to a 6% discount in values for the lower NABERS energy ratings.2. Less evidence of a rent premium, with evidence of a rent discount in the lower NABERS energy ratings.3. Green premiums were seen for reduced vacancy (12%) and reduced yields for the higher NABERS energycategory.Table 16. Green office building premiums: Canberra*Panel A: NABERS energy ratingNABERS rating(2.5 stars or less)NABERS rating(3 stars or more)Gross rent -3.5% 0.8%Value -6.6% 9.8%Vacancy -15.9% -14.0%Incentives 16.3% -1.2%Yield 0.5% -0.2%Outgoings 8.1% 5.6%Panel B: NABERS energy rating (adjusting for area)NABERS rating(2.5 stars or less)NABERS rating(3 stars or more)Gross rent -3.1% 0.2%Value -5.7% 8.7%Vacancy -17.8% -11.5%Incentives 17.2% 2.6%Yield 0.5% -0.1%Outgoings 7.9% 2.4%* green premiums given are relative to the benchmark non-green office buildings36 ‘Building <strong>Better</strong> Returns’
Table 17 presents the impact of a higher NABERS energy rating on the financial performance for green officebuildings in the Canberra office market. Key features include:1. Strong evidence of a green premium in values in the top two NABERS energy categories (9% and 21%respectively) with a discount in the lower NABERS energy categories (13% discount in the 2/2.5 stars).2. An increasing rent premium was evident with the higher NABERS energy categories (eg: a premium of 2.4%for the top NABERS energy category). Again, a discount was evident at the lower NABERS energy categories(eg: 6% discount at 2/2.5 stars).3. Increasing premiums were seen for reduced vacancy, reduced yields and reduced outgoings in the higherNABERS energy categories.Overall, the Canberra office market has seen clear evidence of green premiums in the top NABERS energyrating categories, particularly for values and for rents. This highlights the added value of the 5 stars NABERSenergy rating and the discounts often seen for the lower NABERS energy ratings. Compared to the SydneyCBD and Sydney suburban office markets, the Canberra office market had the largest green premium invalues in the 5 stars NABERS energy category and the largest discount in values for the less than 3 starsNABERS energy ratings.Table 17. Green office building premiums: impact of NABERS energy rating: Canberra*Panel A: NABERS energy rating2/2.5 3/3.5 4/4.5 5Gross rent -6.4% -1.1% 1.6% 2.5%Value -12.6% 3.4% 10.2% 22.5%Vacancy -11.7% -17.8% -11.3% -17.0%Incentives 24.6% 5.4% -5.9% 4.4%Yield 0.7% 0.2% -0.4% -0.9%Outgoings 9.7% 9.5% 3.7% -6.1%Panel B: NABERS energy rating (adjusted for area)2/2.5 3/3.5 4/4.5 5Gross rent -6.2% -1.7% 1.0% 2.4%Value -12.5% 3.6% 8.7% 20.9%Vacancy -12.0% -18.2% -8.0% -13.2%Incentives 29.8% 7.1% -0.8% 7.2%Yield 1.0% 0.2% -0.3% -0.8%Outgoings 9.3% 7.2% 0.0% -9.6%* green premiums given are relative to the benchmark non-green office buildings‘Building <strong>Better</strong> Returns’37
While differences have emerged regarding the extent of the green premiums in these three office markets,the consensus view in these three office markets is the clear extra added value green premium in the 5 starNABERS energy rating category, increasing green premiums with increasing NABERS energy ratings and thepresence of discounts in some of the lower NABERS energy ratings. <strong>The</strong>se top end green premiums and lowerend discounts in values were most evident in the Canberra office market. Similarly, these top end greenpremiums and lower end discounts in rents were most evident in the Sydney CBD office market.“For the past decade, much of the <strong>Australian</strong> property market has moved towardsa sustainable model of doing business, increasingly focussing on the measuredperformance of their portfolios. Evidence is emerging that demonstrates just howeffective this has been, reflected in the recent extension of the NABERS rating scaleto six stars. Ten years ago, a five star rating was considered beyond best practiceand yet leaders in the property market have continued to improve and push intolevels of efficiency previously not considered possible.<strong>The</strong> property market places high importance on transparent and credible information.Research such as this makes a critical contribution to our understanding of the valueindustry places on building performance and the importance of NABERS ratings asthe benchmark in the process. This research shows the market benefits obtained bybusinesses that have already shifted towards sustainability and provides directionto those who are yet to begin the journey.”Bernard CarlonDivisional Director Sustainability ProgramsNSW Office of Environment and Heritage38 ‘Building <strong>Better</strong> Returns’
5.3 Green Star rating: overall office market analysisTable 18 presents the analysis of the green office building premiums using the Green Star rating office buildingportfolio. Key features include:1. A 5% green premium in rents for Green Star rated office buildings.2. A 12% green premium in values for Green Star rated office buildings.3. Green premiums are also seen for reduced vacancy, reduced yields and reduced outgoings.Figure 8 presents a summary of these various Green Star premiums.14.00% Figure 8: Green Star Premiums/Discounts (%) by Category 12.00% Premium/Discount (%) 10.00% 8.00% 6.00% 4.00% 2.00% 0.00% -‐2.00% Gross rent Incen4ves Outgoings Vacancy Yield Value Category Overall, this analysis clearly highlights the added value of the Green Star rating scheme for office buildings,seeing a 5% green premium in rents and a 12% green premium in values. <strong>The</strong>se Green Star green premiumsfor values and rents are comparable to those seen in recent US green office building studies (eg: Eichholtz etal, 2010b). Specific Green Star analyses for the Sydney CBD, Sydney suburban and Canberra office marketswere not possible due to the small number of Green Star properties available in each of these office markets.‘Building <strong>Better</strong> Returns’39
Table 18. Green office building premiums: Green Star ratingGreen StarGreen Star(adjusting for area)Gross rent 6.0% 5.0%Value 13.6% 11.7%Vacancy -1.3% -0.6%Incentives -1.1% 0.5%Yield -0.3% -0.2%Outgoings -0.2% -1.3%“<strong>The</strong> global green building market is evolving at a rapid rate. More than half of theworld’s construction firms predict they’ll be fully committed to green building by2013 – up 37 per cent in a decade. In Australia, the body of evidence confirmingthe financial, social and environmental benefits of greening our built environmentcontinues to grow. <strong>The</strong> direct economic benefits of green building include reductionsin energy and water costs and higher returns on investment. When combinedwith indirect benefits such as increased productivity and reputational equity, staffacquisition and retention and decreased absenteeism, green buildings clearly delivera ‘triple bottom line’ benefit. Rating tools such as Green Star and NABERS havebeen instrumental in driving the shift to sustainability. With the right policies andsupporting programs, green buildings in Australia have the potential to reduce thenation’s carbon footprint while creating jobs and improving the productivity, healthand wellbeing of all <strong>Australian</strong>s.”Romilly MadewChief ExecutiveGreen Building Council of Australia40 ‘Building <strong>Better</strong> Returns’
5.4 Summary of analysis of green office buildingsIn summary, the key findings from these green office building analyses are:1. A green premium in values for office buildings was evident for the NABERS energy rating. This saw the5 star NABERS energy rating delivering a 9% green premium in value and the 3-4.5 star NABERS energyratings delivering a 2-3% green premium in value.2. A clear link between enhanced green premiums in values with the higher rated NABERS energy ratingcategories.3. Green premiums in values differed in specific office markets; being most evident in the Sydney suburbanoffice market (8% green premium) and the Canberra office market (21% green premium) in the 5 starNABERS energy rating category. This compares with the lesser impact in values in the Sydney CBD officemarket (4% green premium).4. Evidence of major discounts in values in the lower NABERS energy rating categories (less than 3 stars) forthe Sydney CBD (10% discount in value) and Canberra (13% discount in value).5. In the 5 star NABERS energy rating, the Canberra office market showed the largest green premium invalue (21%), as well as the largest discount in value (13%) in the lowest NABERS energy ratings.6. <strong>The</strong> Green Star rating showed a green premium in values of 12%.7. Lesser impact was seen in the green premiums in rents for the NABERS energy ratings, with a 5% greenpremium in rents evident for the Green Star rating.8. Major discounts in rents were evident in the lower NABERS energy ratings for the Sydney CBD (9%discount in rents) and Canberra (6% discount in rents).9. In the 5 star NABERS energy rating, the Sydney CBD office market showed the largest green premium inrents (3%), as well as the largest discount in rents (9%) in the lowest NABERS energy rating category.10. Green premiums were also evident in reduced vacancy, reduced outgoings, reduced incentives andreduced yields; particularly at the higher rated NABERS energy categories.11. <strong>The</strong>se office market green premiums in values and rents for Green Star and the top 5 star NABERSenergy rating are generally comparable to that seen in recent US green building studies (eg: Eichholtz etal, 2010b).Overall, the results clearly show the added value premium of the 5 star NABERS energy rating and theGreen Star rating, as well as the discounts often seen for the lower NABERS energy ratings.‘Building <strong>Better</strong> Returns’41
6. <strong>Property</strong> Industry Implicationsand ChallengesThis report has clearly highlighted the added value of green office buildings in Australia, and the differencesin property financial performance green premiums across the NABERS energy rating and Green Star ratingcategories. This was particularly evident in the substantial green premium in values in the higher NABERS andGreen Star categories, as well as across most of the other property performance parameters assessed, withdifferences in green premiums seen between the Sydney CBD, Sydney suburban and Canberra office markets.<strong>The</strong> extra added value of the top NABERS energy rating (5 star) and the Green Star rating was clearly evidentin most green premium analyses, as was the presence of discounts in the lower NABERS energy ratings.Given the continued significance and importance of sustainability in the property industry, future challengesfor the property industry in this key area include:• <strong>The</strong> need to see green office building priorities more fully extended to existing office buildings via retrofitstrategies - this will see a more comprehensive green office buildings agenda across both new officebuildings and existing office buildings.• <strong>The</strong> need to assess other key <strong>Australian</strong> office markets (eg: Melbourne) and introduce cost data for a fullerbusiness case assessment of the amount of investment needed to produce these green premiums.• <strong>The</strong> need for valuers to fully understand sustainability issues when valuing green office buildings. Thisparticularly presents an opportunity for the API to provide strong industry guidance to valuers in this areavia practice standards and guidance notes for the valuation of green office buildings.• <strong>The</strong> need for improved sustainability data in property databases - this is a key ingredient for the rigorousidentification of green premiums for office buildings.• <strong>The</strong> need for ongoing analysis of green office buildings on a regular basis to assess the ongoing impact. Thisis essential to ensure up-to-date analyses are done; particularly as more green office buildings come on-linevia NABERS and Green Star ratings.• <strong>The</strong> need for ongoing active promotion of green office buildings by the API, PFA, <strong>Property</strong> Council of Australia(PCA), Royal Institution of Chartered Surveyors (RICS) and Urban Development <strong>Institute</strong> of Australia (UDIA)- this should be a key ingredient in their professional mandates to ensure the property industry and theirmembers are up-to-date with this increasingly important area. For example, expanded sustainabilitywebsites and relevant links are essential; both at a local and international level.• <strong>The</strong> need to assess whether these green premiums will soon reflect office market norms, subsequentlyresulting in discounts for non-green office buildings. This will soon see green office buildings as thebenchmark market rather than non-green office buildings. This feature has already become evident insome of the analyses in this report.42 ‘Building <strong>Better</strong> Returns’
Final commentGreen office buildings are a key element in the office property landscapes in Australia, supported strongly byall stakeholders in the sustainability agenda.This research has been the first key step in trying to explicitly articulate and assess the premium attached togreen office buildings in Australia in a rigorous manner, using internationally-accepted methodologies. <strong>The</strong>results are very positive and also identify significant opportunities for further research into this increasinglyimportant area.<strong>The</strong> research team would like to commend the API and PFA for driving and leading this important propertyresearch agenda of sustainability. Also, for the strong support from Jones Lang LaSalle and CBRE in providingthe property-specific information and the Office of Environment and Heritage and the Green Building Councilof Australia for the green office building rating information.Overall, this project has been an excellent example of a high level of positive cooperation between allstakeholders, pooling their high quality corporate resources to enable the full and rigorous assessment ofthe financial performance of green office buildings in Australia.“With the business case for green commercial buildings now deeplyrooted in a growing body of evidence, it should be crystal clear to propertyinvestors that there are significant performance gains to be made fromcompetitively pricing green assets, and by the same token, a uniqueopportunity to be in the driving seat of the current shift to a low-carbonand resource-efficient economy.”Paul Clements-HuntHead of United Nations Environment Programme Finance Initiative‘Building <strong>Better</strong> Returns’43
Key References<strong>The</strong> following references provide a fuller context to the currently available reports concerning sustainabilityand green office buildings.Centre for International Economics (2007), <strong>The</strong> Building Sector and Greenhouse: Key Facts: CIE.Citigroup (2010), ASX-listed Office Trusts: Does Green Pay? Citigroup.Citigroup (2011), ASX-listed Office Trusts: Energy Ratings. Citigroup.Dermisi, S. (2009), Effect of LEED ratings and levels on office property assessed and market values. Journalof Sustainable Real Estate , 1(1): 23-47.Eichholtz, P., Kok, N. and Quigley, J. (2010a), Doing well by doing good: green office buildings. AmericanEconomic Review, 100: 2494-2511.Eichholtz, P., Kok, N. and Quigley, J. (2010b), Sustainability and the Dynamics of Green Buildings: NewEvidence on the Financial Performance of Green Office Buildings in the USA. RICS Research.Falkenbach, H., Lindholm, A. and Schleich, H. (2010), Environmental sustainability: drivers for the real estateinvestor. Journal of Real Estate Literature, 18: 203-223.Fuerst, F. (2009), Building momentum: an analysis of investment trends in LEED and Energy Star-certifiedproperties. Journal of Retail and Leisure <strong>Property</strong>, 8(4): 285-297.Fuerst, F. and McAllister, P. (2009), An investigation of the effect of eco-labelling on office occupancy rates.Journal of Sustainable Real Estate, 1(1): 49-64.Fuerst, F. and McAllister, P. (2011), Green noise or green value: measuring the effects of environmentalcertification on office value. Real Estate Economics, 39: 45-69.Green Building Council of Australia (2006), <strong>The</strong> Dollars and Sense of Green Buildings. Green BuildingCouncil of Australia.Jones Lang LaSalle (2004), Commercial <strong>Property</strong> Going Green. Jones Lang LaSalle.Jones Lang LaSalle (2006), Assessing the Value of Sustainability. Jones Lang LaSalle.Jones Lang LaSalle (2007a), Sustainability: Building the Knowledge Gap. Jones Lang LaSalle.Jones Lang LaSalle (2007b), People, Planet, Profitability. Jones Lang LaSalle.Kok, N., Eichholtz, P., Bauer, R. and Peneda, P. (2010), Environmental Performance : A Global Perspective onCommercial Real Estate. European Centre for Corporate Engagement.Miller, N., Spivey, J. and Florence, A. (2008), Does green pay off? Journal of Real Estate PortfolioManagement, 14(4): 385-399.Miller, N., Pogue, D. Gough, Q. and Davis, S. (2009), Green buildings and productivity. Journal of SustainableReal Estate, 1: 65-89.44 ‘Building <strong>Better</strong> Returns’
Newell, G. (2008a), <strong>The</strong> strategic significance of environmental sustainability by <strong>Australian</strong> LPTs. Journal of<strong>Property</strong> Investment and Finance, 26:522-540.Newell, G. (2008b), Sustainability best practice by European property companies. <strong>Property</strong> ResearchQuarterly, 7(3):12-17.Newell, G. (2009a), <strong>The</strong> significance of sustainability best practice in retail property. Journal of Retail andLeisure <strong>Property</strong>, 8(4): 259-271.Newell, G. (2009b), Sustainability Best Practice: <strong>The</strong> Challenges for Asian <strong>Property</strong> Companies. APREA.Newell, G. (2009c), Developing a socially responsible property investment index for UK property companies.Journal of <strong>Property</strong> Investment and Finance, 27: 511-521.Newell, G., Peng, H.W. and Yam, S. (2011), Assessing the linkages between corporate social responsibilityand A-REIT performance. Pacific Rim <strong>Property</strong> Research Journal, 17: 371-388.Pivo, G. and Fisher, J. (2010), Income, value and returns in socially responsible office properties. Journal ofReal Estate Research, 32: 243-269.<strong>Property</strong> Council of Australia (2007), <strong>The</strong> Sustainability Tools Pathway. PCA.<strong>Property</strong> Council of Australia (2011), <strong>Australian</strong> Office Market Report: July 2011. PCA.UNEP Finance Initiative (2008), Responsible <strong>Property</strong> Investing: What the Leaders Are Doing. UNEPFI.UNEP Finance Initiative (2008), Building Responsible <strong>Property</strong> Portfolios. UNEPFI.UNEP Finance Initiative (2009), Responsible <strong>Property</strong> Investment: Similar Aims, Different Manifestations.UNEPFI.UNEP Finance Initiative (2011), Implementing Responsible <strong>Property</strong> Investment Strategies. UNEPFI.Wiley, J., Benefield, J. and Johnson, K. (2010), Green design and the market for commercial office space.Journal of Real Estate Finance and Economics, 41 : 228-243.‘Building <strong>Better</strong> Returns’45
Key Websites<strong>The</strong> following websites have key information and reports regarding sustainability and green office buildingsin Australia:National <strong>Australian</strong> Built Environment Rating Scheme (NABERS): www.nabers.com.auGreen Building Council of Australia (GBCA): www.gbca.org.au<strong>Australian</strong> <strong>Property</strong> <strong>Institute</strong> (API): www.nsw.api.org.au<strong>Property</strong> Funds Association of Australia (PFA): www.propertyfunds.org.auJones Lang LaSalle: www.joneslanglasalle.com.auCBRE: www.cbre.com.auInvestment <strong>Property</strong> Databank (IPD): www.ipd.com<strong>Property</strong> Council of Australia (PCA): www.propertyoz.com.au46 ‘Building <strong>Better</strong> Returns’
DISCLAIMER: <strong>The</strong> information analysis provided within this publication is specific to the “Building <strong>Better</strong> Returns” research report (“theReport”). <strong>The</strong> information in this Report should not be taken as a guarantee of future market events or trends. Neither the SteeringCommittee, the API, PFA nor any other associated entity warrant that the information contained in this Report is accurate and all partiesdisclaim all liability for any losses, damages, costs or expenses suffered by any person as a result of any reliance on this Report.API and PFA members may quote the Report results subject to the inclusion of this disclaimer and making reference to the Report asthe reference source. With the exception of API and PFA members, this Report is not to be reproduced, published or included in anydocument, whether in all or in part, without the express approval of the API (NSW Division) as to the form and context in which it willappear.Also note this publication does not necessarily reflect the views of the <strong>Australian</strong> Federal or State Governments, or indicate a commitmentto a particular course of action<strong>Australian</strong> <strong>Property</strong> <strong>Institute</strong> Inc.Level 3, 60 York Street, Sydney NSW 2000(02) 9299 1811 (02) 9299 1490 www.nsw.api.org.au nsw@api.org.au<strong>Property</strong> Funds AssociationPO Box 216 FLINDERS LAND VIC 8009(03) 9671 3620 (03) 80803247 www.propertyfunds.org.ausara@propertyfunds.org.au