

Maharashtra - DISE
Maharashtra - DISE
Maharashtra - DISE
- No tags were found...

Create successful ePaper yourself
Turn your PDF publications into a flip-book with our unique Google optimized e-Paper software.
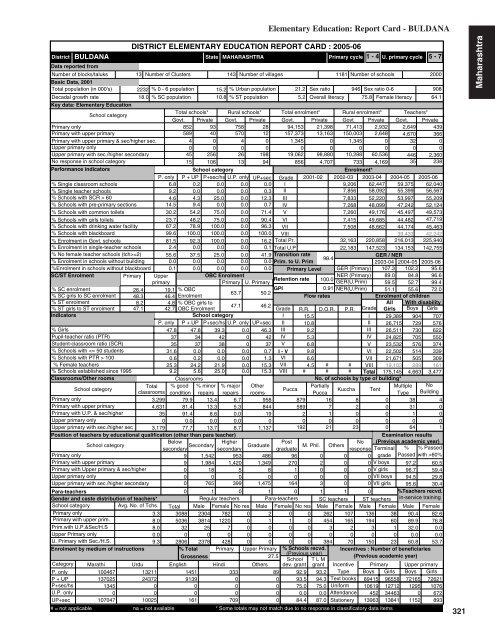
BULDANADistrictData reported fromNumber of blocks/taluksBasic Data, 2001Total population (in 000's)Decadal growth rateDISTRICT ELEMENTARY EDUCATION REPORT CARD : 2005-06StateMAHARASHTRA13 Number of Clusters 143 Number of villages1181 Number of schools20002232 % 0 - 6 population 15.2 % Urban population 21.2 Sex ratio 946 Sex ratio 0-690818.0 % SC population 10.8 % ST population5.2 Overall literacy 75.8 Female literacy 64.1Primary cycle 1 - 4 U. primary cycle 5 - 7Key data: Elementary EducationSchool categoryTotal schools* Rural schools* Total enrolment* Rural enrolment* Teachers*Govt. Private Govt. Private Govt. Private Govt Private Govt. PrivatePrimary only852 93 758 28 94,153 21,398 71,413 2,932 2,649 439Primary with upper primary589 40 570 12 157,373 13,163 150,003 2,648 4,670 366Primary with upper primary & sec/higher sec.4 0 4 0 1,345 0 1,345 0 32 0Upper primary only0 0 0 0 0 0 0 0 0 0Upper primary with sec./higher secondary45 256 26 198 19,062 98,880 10,288 60,536 446 2,360No response in school category15 106 13 94 856 4,707 733 4,169 35 238Performance indicatorsSchool categoryEnrolment*P. only P + UP P+sec/hs U.P. only UP+sec Grade 2001-02 2002-03 2003-04 2004-05 2005-06% Single classroom schools6.8 0.2 0.0 0.0 0.0 I9,206 62,447 59,375 62,040% Single teacher schools9.2 0.0 0.0 0.0 0.3 II7,856 58,092 55,399 56,567% Schools with SCR > 604.6 4.3 25.0 0.0 12.3 III7,833 52,220 53,997 55,209% Schools with pre-primary sections 14.5 9.4 0.0 0.0 0.7 IV7,268 48,099 47,242 52,124% Schools with common toilets 30.2 54.2 75.0 0.0 71.4 V7,260 49,176 45,497 49,573% Schools with girls toilets 23.7 48.2 75.0 0.0 90.4 VI7,415 49,685 44,482 47,719% Schools with drinking water facility 67.2 78.9 100.0 0.0 96.3 VII7,508 48,662 44,174 45,463% Schools with blackboard99.6 100.0 100.0 0.0 100.0 VIII39,433 42,242% Enrolment in Govt. schools 81.5 92.3 100.0 0.0 16.2 Total Pr.32,163 220,858 216,013 225,940% Enrolment in single-teacher schools2.4 0.0 0.0 0.0 0.1 Total U.P22,183 147,523 134,153 142,755% No female teacher schools (tch>=2) 55.6 37.5 25.0 0.0 41.9 Transition rateGER / NER98.4% Enrolment in schools without building 0.0 0.0 0.0 0.0 0.0 Prim. to U. Prim2003-04 2004-05 2005-06%Enrolment in schools without blackboard 0.1 0.0 0.0 0.0 0.0 Primary Level GER (Primary) 107.3 102.2 95.6SC/ST EnrolmentPrimary UpperOBC EnrolmentNER (Primary) 89.0 84.8 96.6Retention rate 100.0primaryPrimary U. PrimaryGER(U.Prim) 59.5 52.7 99.4% SC enrolment26.4 19.1 % OBCGPI0.91 NER(U.Prim) 51.1 55.6 72.063.7 50.2% SC girls to SC enrolment 48.3 46.4 EnrolmentFlow ratesEnrolment of children% ST enrolment8.2 4.8 % OBC girls toAll With disability47.1 46.2% ST girls to ST enrolment 47.1 42.7 OBC EnrolmentGrade R.R. D.O.R. P.R. Grade Girls Boys GirlsIndicatorsSchool categoryI 15.5I 29,389 904 707P. only P + UP P+sec/hs U.P. only UP+sec II 10.8II 26,715 729 576% Girls47.8 47.8 39.3 0.0 46.3 III 9.2III 26,511 730 622Pupil-teacher ratio (PTR)37 34 42 0 42 IV 5.3IV 24,825 705 550Student-classroom ratio (SCR)35 37 38 0 37 V 6.8V 23,532 576 374% Schools with 1000.6 0.2 0.0 0.0 1.3 VI 6.6VII 21,671 505 309% Female teachers25.3 24.2 21.9 0.0 15.3 VII 4.5 # # VIII 19,103 289 161% Schools established since 19959.2 5.6 25.0 0.0 15.3 VIII # # # Total175,145 4,663 3,477Classrooms/Other roomsClassroomsNo. of schools by type of building*School categoryTotal % good % minor % major OtherPartiallyMultiple NoPuccaKuccha Tentclassrooms condition repairs repairs roomsPuccaType BuildingPrimary only3,299 79.9 13.4 6.7 958 879 16 8 0 38 4Primary with upper primary4,631 81.4 13.3 5.3 844 589 7 2 0 31 0Primary with U.P. & sec/higher35 91.4 8.6 0.0 192 1 0 0 1 0Upper primary only0 0.0 0.0 0.000 0 0 0 0 0Upper primary with sec./higher sec 3,179 77.7 13.7 8.7 1,137 192 21 23 0 64 1Position of teachers by educational qualification (other than para teacher)Examination resultsSchool category BelowHigherPost(Previous academic year)M. Phil.secondarysecondarygraduateNoresponse Terminal % % Passed9 1,542 953 486 96 0 0 0 grade Passed with >60%V boysPrimary onlyPrimary with upper primaryPrimary with Upper primary & sec/higherUpper primary onlyUpper primary with sec./higher secondaryPara-teachersGender and caste distribution of teachers*School categoryAvg. No. of Tchs.Primary only3.3 3088 2304Primary with upper prim.8.0 5036 3814 1220 0 1Prim.with U.P.&Sec/H.S8.0 32 25 7 0 0Upper Primary only0.0 0 0 0 0 0U. Primary with Sec./H.S.9.3 2806 2378 428 0 0Enrolment by medium of instructions% Total Primary Upper PrimaryGrossness27.5Category Marathi Urdu English Hindi OthersP. only10046713211145133389P + UP13702524372913900P+sec/hs13450000U.P. only00000UP+sec107047100251617090Elementary Education: Report Card - BULDANA9 1,984 1,420 1,349 270 2 0 00 18 5 8 1 0 0 0 V girls0 0 0 0 0 0 0 0 VII boys0 765 399 1,475 164 3 0 0 VII girls0 1 0 1 0 1 1 0Regular teachers Para-teachers SC teachers ST teachersTotal Male Female No res Male Female No res Male Female Male Female782 0 2 0 0 262 107 136 38100000454301652019430Male Female90.4 82.689.9 76.832.0 0.00.0 0.00 0 384 70 150 23 60.8 53.7% Schools recvd. Incentives : Number of beneficiaries(Previous year)(Previous academic year)School T L Mdev. grant grant Incentive Primary Upper primary92.9 93.2 Type Boys Girls Boys Girls93.5 94.3 Text books 89415 96558 72165 7262175.0 75.0 Uniform 10619 12712 1295 10760.0 0.0 Attendance 452 34463 0 67284.4 87.0 Stationery 13963 13841 1152 893# = not applicable na = not available * Some totals may not match due to no response in classificatory data items601097.2 60.596.7 59.494.5 29.895.6 30.4%Teachers recvd.in-service training321<strong>Maharashtra</strong>


