no tillage worldwide.pdf - European Conservation Agriculture ...
no tillage worldwide.pdf - European Conservation Agriculture ...
no tillage worldwide.pdf - European Conservation Agriculture ...
- No tags were found...

You also want an ePaper? Increase the reach of your titles
YUMPU automatically turns print PDFs into web optimized ePapers that Google loves.
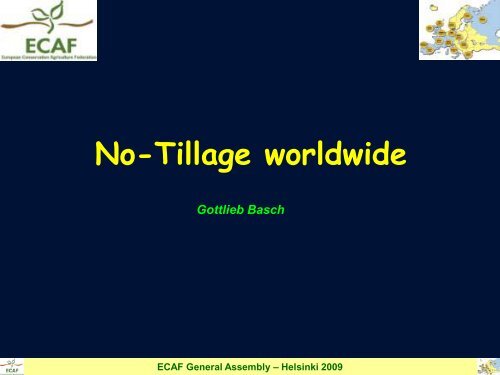
No-Tillage <strong>worldwide</strong>Gottlieb BaschECAF General Assembly – Helsinki 2009
No-Tillage overseasECAF General Assembly – Helsinki 2009
Extent of <strong>no</strong>-till adoption in the USA25.3 Million ha
Extent of <strong>no</strong>-till adoption in BrazilBRASIL - EXPANSÃO DA ÁREA CULTIVADA EM PLANTIO DIRETOSAFRA VERÃO/SAFRINHA/INVERNOMilhões de hectares18171615141312111098765432101990 - 1 Million ha72/73 73/74 74/75 75/76 76/77 77/78 78/79 79/80 80/81 81/82 82/83 83/84 84/85 85/86 86/87 87/88 88/89 89/90 90/91 91/92 92/93 93/94 94/95 95/96 96/97 97/98 98/99 99/00 00/01BRAS IL 0,00 0,00 0,01 0,03 0,06 0,06 0,05 0,13 0,21 0,23 0,26 0,38 0,50 0,58 0,65 0,73 0,80 0,90 1,00 1,35 2,03 3,00 3,80 5,50 8,85 11,33 13,37 14,97 17,36fonte: EMATER RS, EPAGRI-SC, EMATER-PR, CATI-SP, FUNDAÇÃO MS, APDC(CERRADO)(FEBRAPDP,2002)
Adoption of <strong>no</strong>-<strong>tillage</strong> in W. Australia (%)9 million ha under <strong>no</strong>-<strong>tillage</strong> in Australia908070Estimated farmer adoption of <strong>no</strong>-till in WA82% adoptionAdoption (%)605040302010091 92 93 94 95 96 97 98 99 00 01 02 03 04(Bill Crabtree, 2004)
Extent of <strong>no</strong>-till adoption in Paraguay20001000 haParaguay1.7 Mil. ha15001992 - 2005100050001992 93 94 95 96 97 98 99 00 01 02 03 04 05Source: Programa de Manejo, Recuperación y Conservación de Suelos, DEAG - MAG(Derpsch, 2005)
Area under <strong>no</strong>-<strong>tillage</strong> (million ha)World total = 95 Million haCanada 12USA 25Rest of the world 3.7EuropeAsiaAfricaBrazil 23Paraguay 1.7Argentina 18Australia 9(Derpsch, 2005)
Percentage of <strong>no</strong>-till Adoption in the World47.0%South AmericaUSA & Canada39.6%Rest of the WorldAustralia9.4%3.9%(Derpsch, 2004)
Percentage of <strong>no</strong>-till adoption in relation to totalcultivated area23.0%60.0%(Derpsch, 2004)USA77.0%NTConventional60.0%Argentina40.0%Brazil40.0%65.0%Paraguay35.0%ECAF General Assembly – Helsinki 2009
While only 10% - 12% of the area under <strong>no</strong>-<strong>tillage</strong> inUSA is permanently <strong>no</strong>t being tilled,more than 90% of the area under <strong>no</strong>-<strong>tillage</strong> in SouthAmerica is permanently <strong>no</strong>t being tilledBoliviaBrazilParaguayArgentina(Derpsch, 2004)
Effects on productivityECAF General Assembly – Helsinki 2009
Grain production and area planted in Brazil(COOPLANTIO/CONAB, 2005)
Grain production and area planted in ArgentinaARGENTINAArea Cultivada y Produccion Total807060Total ProductionTotal Cropped AreaMIIL HA.-TN.504030Poly. (Total Production)2010088 89 90 91 92 93 94 95 96 97 98 99 0 1YEARS(Peiretti, 2002)
Impact of long term <strong>no</strong>-<strong>tillage</strong> in BrazilKg/ha# ### ## # ## !#!! ! !! ! ! !Corn!#!#!#!#! #! #!30% less fertilizer#!#!# # #! ! !$$$$ $ $$$ $ $ $$$ $ $ $ $ $ $ "" " $"" " " " " " " " " " " " " " " "Soya$ "50% less fertilizerYear(Dijkstra, 1998)
Recent evolution of NT uptakeECAF General Assembly – Helsinki 2009
Recent changes in uptake of NT(main countries)Country Year Area (1000 ha) Year Area (1000 ha) % increaseUSA 2000 21.100 2007 26.500 26Canada 2000 8.800 2006 13.480 53Brazil 2000 14.300 2006 25.500 78Argentina 2000 9.250 2006 19.720 113Paraguay 2000 950 2008 2.400 153Bolivia 2000 240 2007 706 194Uruguay 2001 119 2007 672 465Australia 1999 1.000 2007 12.000 1100ECAF General Assembly – Helsinki 2009
THE BIG ONESEvolution of NT areas over the last 12 years302520151050USABrazilArgentina1994 1996 1998 2000 2002 2004 2006ECAF General Assembly – Helsinki 2009
No-<strong>tillage</strong> areasTop 20Country Area NT (2006/07/08) Country Area NT (2006/07/08)USA 26.593.000 South Africa 368.000Brazil 25.502.000 Venezuela 300.000Argentina 19.719.000 France 200.000Canada 13.481.000 Finland 200.000Australia 12.000.000 Chile 180.000Paraguay 2.400.000 New Zealand 162.000China 1.330.000 Colombia 100.000Kazakhstan 1.200.000 Ukraine 100.000Bolivia 706.000 Russia ???Uruguay 672.000 Others 1.000.000Spain 650.000 Total 106.863.000(Derpsch & Friedrich, 2009)ECAF General Assembly – Helsinki 2009
120Adoption of <strong>Conservation</strong> <strong>Agriculture</strong> - Worldwide100959810110588Area - Million Hectares8060402529333846535560647180208101318019891990199119921993199419951996199719981999200020012002200320042005200620072008Source: Derpsch(2009)ECAF General Assembly – Helsinki 2009
What about Europe(the developing continent?)ECAF General Assembly – Helsinki 2009
Situation of CA in EuropeCountryMinimum <strong>tillage</strong>(1000 ha)No-till(1000 ha)Cover cropsin perennialwoody crops(1000 ha)Totalsurface CA(1000 ha)% NT/arableland% CA/arablelandBelgium 140 n.d. n.d. 140 17.2Denmark 230 n.d. n.d. 230 10.1Finland 550 200 n.d. 750 9.1 34.1France 3750 150 n.d. 3900 0.8 21.1Germany 2300 200 n.d. 2500 1.7 21.2Greece 230 100 n.d. 430 3.7 15.8Ireland 10 n.d. n.d. 10 0.9Italy 480 80 n.d. 560 1.0 6.8Hungary 490 10 n.d. 500 0.2 10.8Portugal 300 80 30 410 4.0 20.6Russia 15000 500 n.d. 15500 0.4 12.6Slovak Republic 320 130 7 457 9.1 31.9Spain 1500 700 850 3050 5.1 22.2Switzerland 80 12 10 102 2.9 24.9United Kingdom 2500 180 n.d. 2680 3.1 46.6Total 27880 2342 31220 1.2 15.7ECAF General Assembly – Helsinki 2009(data ECAF 2006/07)
What is necessary?ECAF General Assembly – Helsinki 2009
Have in mindwhat CAP is looking for?‣ Protection of soil, water, air,biodiversity, etc.‣ Reasonable farm income‣ Landscape management‣ Globalization of agricultural marketsECAF General Assembly – Helsinki 2009
What is CAP looking for?‣ Competitiveness of <strong>European</strong> agriculture‣ Reduction of subsidies‣ High quality products at acceptable prices‣ Bio-energy cropsECAF General Assembly – Helsinki 2009
Maybe something like this?ECAF General Assembly – Helsinki 2009
SoilSoil conservation &SustainabilitymanagementECAF General Assembly – Helsinki 2009
Crop Yields, Profitability & CompetitivenessBiodiversity & Beautiful landscape<strong>Conservation</strong><strong>Agriculture</strong>Soil Fertility & Carbon sequestrationLess surface ru<strong>no</strong>ff& FloodsLess soil erosion & Soil Compaction