Position vs. Time and Velocity vs. Time Graphs - Modeling Physics
Position vs. Time and Velocity vs. Time Graphs - Modeling Physics
Position vs. Time and Velocity vs. Time Graphs - Modeling Physics
- No tags were found...

You also want an ePaper? Increase the reach of your titles
YUMPU automatically turns print PDFs into web optimized ePapers that Google loves.
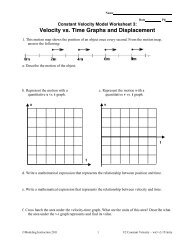
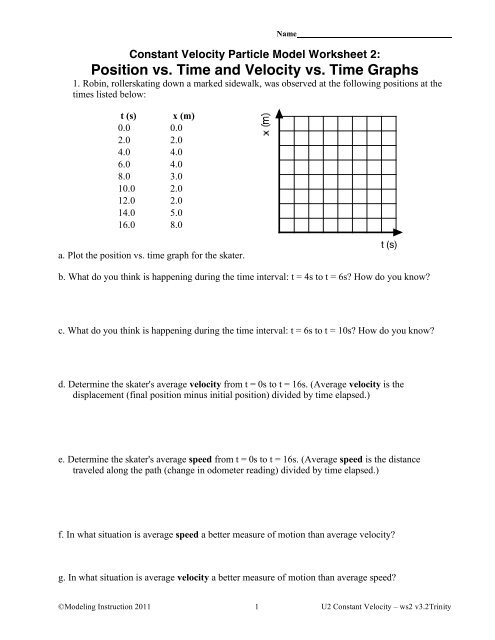
NameConstant <strong>Velocity</strong> Particle Model Worksheet 2:<strong>Position</strong> <strong>vs</strong>. <strong>Time</strong> <strong>and</strong> <strong>Velocity</strong> <strong>vs</strong>. <strong>Time</strong> <strong>Graphs</strong>1. Robin, rollerskating down a marked sidewalk, was observed at the following positions at thetimes listed below:t (s) x (m)0.0 0.02.0 2.04.0 4.06.0 4.08.0 3.010.0 2.012.0 2.014.0 5.016.0 8.0a. Plot the position <strong>vs</strong>. time graph for the skater.t (s)b. What do you think is happening during the time interval: t = 4s to t = 6s? How do you know?c. What do you think is happening during the time interval: t = 6s to t = 10s? How do you know?d. Determine the skater's average velocity from t = 0s to t = 16s. (Average velocity is thedisplacement (final position minus initial position) divided by time elapsed.)e. Determine the skater's average speed from t = 0s to t = 16s. (Average speed is the distancetraveled along the path (change in odometer reading) divided by time elapsed.)f. In what situation is average speed a better measure of motion than average velocity?g. In what situation is average velocity a better measure of motion than average speed?©<strong>Modeling</strong> Instruction 2011 1 U2 Constant <strong>Velocity</strong> – ws2 v3.2Trinity