Bulk Vessel - Clarksons Shipping Intelligence Network
Bulk Vessel - Clarksons Shipping Intelligence Network
Bulk Vessel - Clarksons Shipping Intelligence Network
- No tags were found...

You also want an ePaper? Increase the reach of your titles
YUMPU automatically turns print PDFs into web optimized ePapers that Google loves.
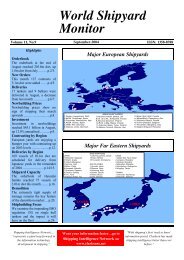
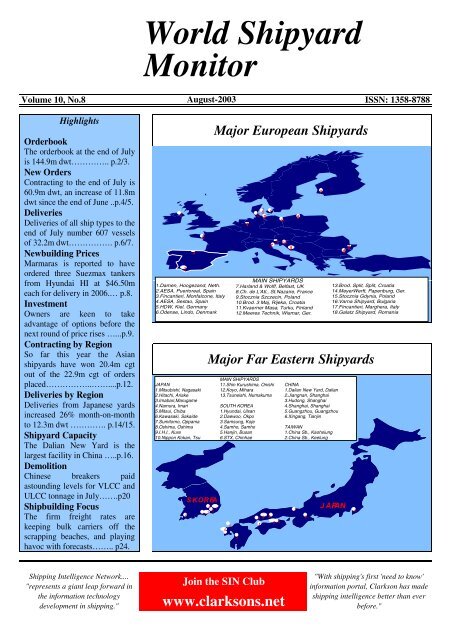
World ShipyardMonitorVolume 10, No.8 August-2003ISSN: 1358-8788HighlightsOrderbookThe orderbook at the end of Julyis 144.9m dwt………….. p.2/3.New OrdersContracting to the end of July is60.9m dwt, an increase of 11.8mdwt since the end of June ..p.4/5.DeliveriesDeliveries of all ship types to theend of July number 607 vesselsof 32.2m dwt……………. p.6/7.Newbuilding PricesMarmaras is reported to haveordered three Suezmax tankersfrom Hyundai HI at $46.50meach for delivery in 2006.… p.8.InvestmentOwners are keen to takeadvantage of options before thenext round of price rises …...p.9.Contracting by RegionSo far this year the Asianshipyards have won 20.4m cgtout of the 22.9m cgt of ordersplaced……………..……....p.12.Deliveries by RegionDeliveries from Japanese yardsincreased 26% month-on-monthto 12.3m dwt …………. p.14/15.Shipyard CapacityThe Dalian New Yard is thelargest facility in China …..p.16.DemolitionChinese breakers paidastounding levels for VLCC andULCC tonnage in July…….p20Shipbuilding FocusThe firm freight rates arekeeping bulk carriers off thescrapping beaches, and playinghavoc with forecasts…….. p24.721.Damen, Hoogezand, Neth.2.AESA, Puertoreal, Spain3.Fincantieri, Monfalcone, Italy4.AESA, Sestao, Spain5.HDW, Kiel, Germany6.Odense, Lindo, Denmark4JAPAN1.Mitsubishi, Nagasaki2.Hitachi, Ariake3.Imabari,Marugame4.Namura, Imari5.Mitsui, Chiba6.Kawasaki, Sakaide7.Sumitomo, Oppama8.Oshima, Oshima9.I.H.I., Kure10.Nippon Kokan, Tsu48S.KOREAMajor European Shipyards146 15 1293 101713MAIN SHIPYARDS7.Harland & Wolff, Belfast, UK8.Ch. de L'Atl., St.Nazaire, France9.Stocznia Szczecin, Poland10.Brod. 3 Maj, Rijeka, Croatia11.Kvaerner Masa, Turku, Finland12.Meeres Technik, Wismar, Ger.1816Major Far Eastern Shipyards6153 2MAIN SHIPYARDS11.Shin Kurushima, Onishi12.Koyo, Mihara13.Tsuneishi, NumakumaSOUTH KOREA1.Hyundai, Ulsan2.Daewoo, Okpo3.Samsung, Koje4.Samho, Samho5.Hanjin, Busan6.STX, Chinhae48129 12 133 61715CHINA1.Dalian New Yard, Dalian2.Jiangnan, Shanghai3.Hudong, Shanghai4.Shanghai, Shanghai5.Guangzhou, Guangzhou6.Xingang, Tianjin101TAIWAN1.China Sb., Kaohsiung2.China Sb., Keelung13.Brod. Split, Split, Croatia14.MeyerWerft, Papenburg, Ger.15.Stocznia Gdynia, Poland16.Varna Shipyard, Bulgaria17.Fincantieri, Marghera, Italy18.Galatz Shipyard, RomaniaJAPAN5<strong>Shipping</strong> <strong>Intelligence</strong> <strong>Network</strong>...."represents a giant leap forward inthe information technologydevelopment in shipping."Join the SIN Clubwww.clarksons.net"With shipping's first 'need to know'information portal, Clarkson has madeshipping intelligence better than everbefore."
SpecialisedChemicalProductsPanamaxAframaxSuezmaxVLCCHandysizeHandymaxPanamaxCapesizeCombosFCC3KteuOrderbook As % Of Fleet (DWT)5.3%6.5%20.8%20.9%27.5%22.0%46.4%35.0%26.6%25.4%28.1%20.2%17.0%15.2%4.9%4.8%End Jul 0315.5%End 200214.1%14.2%9.5%16.0%12.9%1.0%2.0%9.2%8.2%44.5%26.6%0% 10% 20% 30% 40% 50% 60%<strong>Bulk</strong> <strong>Vessel</strong>OrderbookNo. endOrderbook by <strong>Vessel</strong> Typem.CGT, end:Orderbook, Delivery in:2002 Jul* 2002 Jul* 1999 2000 2001 2002 Jul* 2003 2004 2005+VLCC > 200,000 62 70 3.0 3.3 22.4 27.1 26.1 19.0 21.3 4.0 9.1 8.2Suezmax 120-200,000 54 77 1.7 2.4 5.5 9.3 9.9 8.5 12.1 2.7 3.3 6.1Aframax 80-120,000 130 143 3.0 3.3 3.4 7.0 13.0 14.0 15.4 3.4 5.1 7.0Panamax 60-80,000 71 96 1.5 2.1 1.4 0.8 2.5 5.1 6.9 0.9 2.8 3.3Products 10-60,000 210 264 4.0 5.0 2.3 4.0 7.4 8.8 11.2 2.0 4.2 5.0Chemical 10-60,000 124 130 1.8 1.9 2.1 2.2 2.7 3.3 3.4 1.0 1.2 1.2Specialised 10-60,000 5 4 0.1 0.1 0.3 0.3 0.2 0.2 0.2 0.1 0.1 0.0Tankers > 10,000 656 784 15.3 18.2 37.5 50.7 61.8 58.9 70.5 13.9 25.8 30.8Tankers < 10,000 115 117 0.7 0.7 0.3 0.3 0.5 0.7 0.7 0.3 0.3 0.1Capesize > 80,000 72 102 1.9 2.5 12.2 10.5 8.8 12.0 15.4 1.6 5.8 8.0Panamax 60-80,000 94 142 1.9 2.8 12.5 12.1 5.8 7.1 10.7 1.0 4.5 5.2Handymax 40-60,000 149 168 2.4 2.7 6.4 9.6 7.0 7.6 8.7 1.6 3.5 3.6Handysize 10-40,000 126 125 1.4 1.4 2.4 3.0 2.7 3.5 3.5 0.9 1.8 0.9<strong>Bulk</strong>ers > 10,000 441 537 7.5 9.4 33.4 35.3 24.3 30.3 38.3 5.1 15.5 17.7Combos > 10,000 2 1 0.1 0.0 0.0 0.0 0.2 0.2 0.1 0.1 0.0 0.0Total <strong>Bulk</strong> <strong>Vessel</strong>s 1214 1439 23.5 28.4 71.2 86.2 86.8 90.1 109.7 19.4 41.6 48.7Special <strong>Vessel</strong>OrderbookOrderbook, Delivery in:2002 Jul* 2002 Jul* 1999 2000 2001 2002 Jul* 2003 2004 2005+LNG Carriers 56 56 4.6 4.6 1.3 1.9 3.4 4.0 4.0 0.7 1.5 1.7LPG Carriers 41 39 0.8 0.7 0.9 0.9 1.1 1.1 1.0 0.4 0.3 0.4Reefers 8 7 0.1 0.1 0.2 0.1 0.1 0.1 0.1 0.1 0.0 0.0Containers > 3,000 teu 164 268 6.5 11.6 8.7 13.5 12.7 10.7 19.3 1.9 6.2 11.1Containers < 3,000 teu 177 207 2.4 2.8 3.1 5.1 4.7 3.6 4.2 1.2 1.8 1.2Other Dry > 5,000 dwt 208 247 4.1 5.0 3.2 2.9 2.7 2.9 3.2 1.1 1.3 0.8Offshore & Other 263 250 2.0 1.8 1.7 1.6 2.5 3.3 3.3 1.3 1.3 0.6Cruise <strong>Vessel</strong>s 30 21 3.0 2.4 0.3 0.3 0.3 0.2 0.2 0.0 0.1 0.0Ro-Ro Ferries 50 53 1.3 1.4 0.2 0.3 0.2 0.2 0.2 0.1 0.1 0.0Total Special <strong>Vessel</strong>s 997 1,148 24.9 30.5 19.7 26.6 27.6 26.0 35.2 6.7 12.5 16.0TotalOrderbookSource: Clarkson Research StudiesNo. endm.CGT, end:Orderbook, Delivery in:2002 Jul* 2002 Jul* 1999 2000 2001 2002 Jul* 2003 2004 2005+All <strong>Vessel</strong>s Types 2,211 2,587 48.4 58.8 90.9 112.9 114.5 116.1 144.9 26.1 54.1 64.6Clarkson Research Studies Page 2m. DWT, end:m. DWT, end:No. end m.CGT, end: m. DWT, end:Summary• The orderbook at the end of July is 144.9m dwt.The orderbook is now larger than any of the end yearorderbooks of the previous five years.• Several of the orderbooks, including Panamaxtankers, Panamax bulk carriers and >3,000 teucontainerships, now extend into 2007. The weight of thePanamax tanker orderbook is so great that the 2005orderbook (3.0m dwt) is now larger than the end yearfigures for the years 1999-2001.• The general growth in the orderbook covers mostsectors. The only sectors not taking part in the generalgrowth are reefers, cruise, LNG, and combis.• The dry bulk carrier orderbook grew by 1.3m dwtin July, but several Panamax vessels moved from 2005delivery to 2006, decreasing deliveries in 2005 by 0.2mdwt to 4.5m dwt.• The Containership orderbook is now 23.5m dwt,an increase of 3.6m dwt in one month. At 19.3m dwt the>3,000 dwt Containership orderbook has grown by 80%since the start of the year.N.B. Details of special cargo ships orderbook, in terms of special units of measurement e.g. cbm, teu, ,000 cuft. etc. may be found in the blue centre pages. - denotes figureunavailable.Aug-03
Orderbook by <strong>Vessel</strong> TypeMonthly Forward Orderbook by Shiptype (m. dwt)18.00m. dwt16.0014.00TankersCombosContainer<strong>Bulk</strong>ersGas12.0010.008.006.004.002.000.002-20034-20036-20038-200310-200312-20032-20044-20046-20048-200410-200412-20042-20054-20056-2005Source: Clarkson Research Studies8-200510-200512-20052-20064-20066-20068-2006<strong>Bulk</strong> <strong>Vessel</strong>OrderbookOrderbook, Delivery in:1995 1996 1997 1998 1999 2000 2001 2002 Jul* 2003 2004 2005+VLCC > 200,000 4.0 4.1 10.2 12.6 12 14.2 13.7 9.9 11.0 2.1 4.7 4.2Suezmax 120-200,000 1.6 2.3 3.8 3.6 2.9 4.9 5.2 4.4 6.3 1.4 1.7 3.2Aframax 80-120,000 1.6 2.6 4.4 4.2 1.9 3.9 7.1 7.6 8.4 1.8 2.8 3.8Panamax 60-80,000 0.1 0.0 0.4 1.0 0.8 0.5 1.4 2.8 3.8 0.5 1.5 1.8Products 10-60,000 1.7 1.7 2.3 1.9 1.5 2.6 4.7 5.5 6.9 1.2 2.6 3.0Chemical 10-60,000 1.1 1.4 1.8 1.6 1.3 1.4 1.7 2.0 2.1 0.6 0.7 0.8Specialised 10-60,000 0.2 0.1 0.1 0.2 0.2 0.2 0.1 0.1 0.1 0.1 0.1 0.0Tankers > 10,000 10.2 12.3 23.2 25.0 20.4 27.6 33.9 32.5 38.6 7.6 14.1 16.9Tankers < 10,000 0.2 0.3 0.4 0.3 0.2 0.2 0.3 0.5 0.4 0.2 0.2 0.1Capesize > 80,000 7.2 4.8 4.2 5.0 6.3 5.4 4.5 6.1 7.8 0.8 2.9 4.1Panamax 60-80,000 4.1 4.7 4.4 4.1 6.6 6.5 3.1 3.7 5.6 0.5 2.4 2.7Handymax 40-60,000 4.6 4.4 3.5 2.0 3.7 5.7 4.2 4.5 5.2 1.0 2.1 2.1Handysize 10-40,000 2.6 2.5 2.1 1.5 1.5 1.9 1.7 2.2 2.2 0.5 1.1 0.6<strong>Bulk</strong>ers > 10,000 18.5 16.3 14.3 12.6 18.1 19.5 13.5 16.5 20.8 2.9 8.5 9.5Combos > 10,000 0.4 0.3 0.3 0.3 0.0 0.0 0.1 0.1 0.1 0.1 0.0 0.0Total <strong>Bulk</strong> <strong>Vessel</strong>s 29.3 29.2 38.1 38.3 38.8 47.3 47.8 49.6 60.0 10.8 22.8 26.4Special <strong>Vessel</strong>OrderbookMillion GTOrderbook, Delivery in:1996 1996 1997 1998 1999 2000 2001 2002 Jul* 2003 2004 2005+LNG Carriers 1.9 1.8 2.3 2.0 1.8 2.5 4.5 5.4 5.4 1.0 2.0 2.4LPG Carriers 0.6 0.4 0.6 0.9 0.7 0.8 1.0 0.9 0.8 0.3 0.2 0.3Reefers 0.2 0.3 0.5 0.4 0.2 0.1 0.1 0.1 0.1 0.1 0.0 0.0Containers > 3,000 teu 6.5 6.4 4.2 4.4 8.0 12.2 11.5 9.9 17.7 1.8 5.7 10.2Containers < 3,000 teu 4.3 5.5 4.2 2.6 2.5 4.0 3.7 2.9 3.3 0.9 1.4 1.0Other Dry > 5,000 dwt 2.6 3.9 5.8 6.0 4.8 4.2 3.7 4.3 5.2 1.5 2.0 1.8Offshore & Others 0.5 0.8 1.2 1.8 1.3 1.3 1.8 2.3 2.3 1.3 0.5 0.5Cruise <strong>Vessel</strong>s 1.6 1.7 1.8 2.4 3.3 4.0 3.4 2.4 1.9 0.6 1.0 0.4Ro-Ro Ferries 0.6 0.6 0.5 0.6 1.3 1.5 0.9 0.7 0.7 0.2 0.4 0.1Total Special <strong>Vessel</strong>s 18.9 21.4 21.1 21.1 23.8 30.6 30.7 28.9 37.5 7.6 13.1 16.7TotalOrderbookMillion GTMillion GTOrderbook, Delivery in:1995 1996 1997 1998 1999 2000 2001 2002 Jul* 2003 2004 2005+All <strong>Vessel</strong>s Types 48.3 50.6 59.2 59.4 62.6 77.8 78.5 78.5 97.5 18.0 36.3 43.1N.B. Details of special cargo ships orderbook, in terms of special units of measurement e.g. cbm, teu, ,000 cuft. etc. may be found in the blue centre pages. - denotes figureunavailable.Clarkson Research Studies Page 3Aug-03
3.53.02.52.01.51.00.50.0m. cgtQuarterly Contracting by m. cgtTankers <strong>Bulk</strong>ers Gas Container Other4Q952Q964Q962Q974Q972Q984Q982Q994Q992Q004Q002Q014Q012Q024Q022Q03<strong>Bulk</strong> <strong>Vessel</strong>ContractingNew Orders by <strong>Vessel</strong> Type2002 Jul* 2002 Jul* 1999 2000 2001 2002 Jul* This Year v. LastVLCC > 200,000 17 33 0.8 1.5 7.6 16.9 6.8 5.2 10.1 UP BY…. 235%Suezmax 120-200,000 15 36 0.5 1.2 1.1 7.2 3.1 2.3 5.7 UP BY…. 318%Aframax 80-120,000 44 57 1.0 1.3 1.0 5.8 7.5 4.8 6.1 UP BY…. 116%Panamax 60-80,000 45 39 1.0 0.9 0.3 0.5 2.0 3.3 2.8 UP BY…. 47%Products 10-60,000 82 104 1.5 2.0 1.1 2.8 4.7 3.5 4.4 UP BY…. 117%Chemical 10-60,000 70 43 0.9 0.6 0.8 1.2 1.2 1.6 1.1 UP BY…. 17%Specialised 10-60,000 3 0 0.1 0.0 0.2 0.1 0.0 0.1 0.0 DOWN BY….. -100%Tankers > 10,000 276 312 5.9 7.5 12.0 34.6 25.3 20.8 30.1 UP BY…. 148%Tankers < 10,000 79 48 0.5 0.3 0.2 0.2 0.4 0.5 0.3 DOWN BY….. -7%Capesize > 80,000 43 48 1.1 1.1 6.7 4.4 3.8 7.3 6.3 UP BY…. 47%Panamax 60-80,000 72 59 1.4 1.2 9.5 3.7 2.0 5.4 4.4 UP BY…. 40%Handymax 40-60,000 95 60 1.5 0.9 4.7 5.1 2.5 5.0 3.2 UP BY…. 10%Handysize 10-40,000 85 32 0.9 0.4 1.8 1.9 1.3 2.3 1.0 DOWN BY….. -29%<strong>Bulk</strong>ers > 10,000 295 199 4.9 3.6 22.8 15.1 9.5 20.1 14.9 UP BY…. 27%Combos > 10,000 0 0 0.0 0.0 0.0 0.0 0.2 0.0 0.0Total <strong>Bulk</strong> <strong>Vessel</strong>s 650 559 11.3 11.3 35.0 49.9 35.4 41.4 45.3 UP BY…. 88%Special <strong>Vessel</strong>Contracting2002 Jul* 2002 Jul* 1999 2000 2001 2002 Jul* This Year v. LastLNG Carriers 19 5 1.6 0.4 0.4 1.4 1.6 1.3 0.4 DOWN BY….. -51%LPG Carriers 14 14 0.2 0.3 0.2 0.5 0.7 0.3 0.4 UP BY…. 117%Reefers 2 0 0.0 0.0 0.0 0.0 0.0 0.0 0.0 DOWN BY….. -100%Containers > 3,000 teu 58 152 2.4 7.0 5.5 8.7 4.7 3.9 11.6 UP BY…. 414%Containers < 3,000 teu 71 88 0.9 1.2 1.7 4.0 2.1 1.4 1.7 UP BY…. 115%Other Dry > 5,000 dwt 102 82 2.3 1.8 1.1 1.8 0.9 1.4 1.0 UP BY…. 20%Offshore & Others 140 64 0.9 0.4 0.6 1.2 1.6 1.4 0.5 DOWN BY….. -34%Cruise <strong>Vessel</strong>s 4 1 0.2 0.1 0.1 0.1 0.0 0.0 0.0 UP BY…. 73%Ro-Ro Ferries 32 18 0.8 0.5 0.1 0.1 0.1 0.1 0.0 DOWN BY….. -36%Total Special <strong>Vessel</strong>s 442 424 9.4 11.6 9.7 17.8 11.7 9.8 15.7 UP BY…. 174%TotalContractingSource: Clarkson Research StudiesNo. end m.CGT, end: m. DWT, end:No. endm.CGT, end:No. end m.CGT, end: m. DWT, end:2002 Jul* 2002 Jul* 1999 2000 2001 2002 Jul* This Year v. LastAll <strong>Vessel</strong>s Types 1,092 983 20.7 22.9 44.6 67.7 47.1 51.2 60.9 UP BY…. 104%Clarkson Research Studies Page 4Summary• Total contracting to the end of July is 60.9m dwt, anincrease of 11.8m dwt since the end of June. Contractingso far this year surpasses both 2001 and 2002, and isheading towards the 67.7m dwt of 2000.• A dozen Suezmaxes were ordered during July.Greek owners were most active, with Marmaras orderingthree 150,000 dwt tankers from Hyundai at $46.5m each.Tsakos also ordered two Suezmaxes from Hyundai. FiveSuezmaxes were ordered at Universal shipyard.• Universal also won an order for two 203,000 dwtCapesizes from domestic owner NYK Line. In total fiveCapesizes of 1.0m dwt were ordered during July, but thegreatest number of dry bulk carriers ordered in July was inthe Handymax sector. This included four 53,000 dwt shipsto be built at Kouan Shipbuilding for Enterprises<strong>Shipping</strong>. The reported price was $18.25m each.• A staggering 46 (3,000 teu plus) containershipswere ordered in July. Not only is this a new record, it alsomeans that nearly a third of all the ships contracted so farthis year were ordered in just one month!m. DWT, end:Ordering TrendsOrdering TrendsOrdering TrendsN.B. Details of special cargo ships orderbook, in terms of special units of measurement e.g. cbm, teu, '000 cuft. etc. may be found in the blue centre pages. - denotes figureunavailable.Aug-03
New Orders by <strong>Vessel</strong> Type<strong>Bulk</strong> <strong>Vessel</strong>Contracting1995 1996 1997 1998 1999 2000 2001 2002 Jul* This Year v. LastVLCC > 200,000 0.4 3.0 7.7 4.4 3.9 8.8 3.6 2.7 5.2 UP BY…. 230%Suezmax 120-200,000 0.9 1.3 2.4 1.4 0.6 3.7 1.6 1.2 2.9 UP BY…. 315%Aframax 80-120,000 0.9 1.6 2.9 1.7 0.5 3.2 4.0 2.6 3.3 UP BY…. 116%Panamax 60-80,000 0.0 0.0 0.4 0.6 0.2 0.3 1.1 1.8 1.6 UP BY…. 50%Products 10-60,000 0.4 0.8 1.1 0.5 0.7 1.8 2.9 2.2 2.7 UP BY…. 114%Chemical 10-60,000 0.5 0.6 0.9 0.5 0.5 0.8 0.8 1.0 0.7 UP BY…. 18%Specialised 10-60,000 0.2 0.0 0.1 0.1 0.1 0.1 0.0 0.1 0.0 DOWN BY….. -100%Tankers > 10,000 3.4 7.5 15.5 9.2 6.6 18.8 14.0 11.5 16.4 UP BY…. 143%Tankers < 10,000 0.2 0.2 0.3 0.2 0.1 0.1 0.3 3.7 0.2 DOWN BY….. -92%Capesize > 80,000 3.7 1.4 3.2 2.0 3.5 2.2 1.9 3.7 3.2 UP BY…. 50%Panamax 60-80,000 3.5 2.0 2.6 1.9 5.0 2.0 1.0 2.8 2.4 UP BY…. 42%Handymax 40-60,000 3.0 2.2 1.3 0.6 2.7 3.1 1.5 2.9 1.9 UP BY…. 10%Handysize 10-40,000 2.0 1.3 1.2 0.6 1.1 1.3 0.8 1.4 0.6 DOWN BY….. -30%<strong>Bulk</strong>ers > 10,000 12.3 6.8 8.2 5.0 12.4 8.5 5.2 10.8 8.0 UP BY…. 27%Combos > 10,000 0.3 0.1 0.1 0.0 0.0 0.0 0.1 0.0 0.0Total <strong>Bulk</strong> <strong>Vessel</strong>s 16.1 14.5 23.9 14.2 19.0 27.3 19.3 22.4 24.4 UP BY…. 87%Special <strong>Vessel</strong>Contracting1995 1996 1997 1998 1999 2000 2001 2002 Jul* This Year v. LastLNG Carriers 0.3 0.6 0.9 0.1 0.5 1.9 2.1 1.9 0.5 DOWN BY….. -55%LPG Carriers 0.5 0.1 0.4 0.5 0.2 0.5 0.6 0.2 0.3 UP BY…. 116%Reefers 0.2 0.2 0.3 0.1 0.0 0.0 0.0 0.0 0.0 DOWN BY….. -100%Containers > 3,000 teu 3.6 2.3 0.8 3.4 5.0 7.7 4.4 3.6 10.6 UP BY…. 403%Containers < 3,000 teu 3.2 3.3 1.5 1.4 1.4 3.1 1.7 1.1 1.4 UP BY…. 126%Other Dry > 5,000 dwt 2.0 2.1 3.2 2.6 1.5 2.5 1.3 2.3 1.8 UP BY…. 33%Offshore & Others 0.3 0.6 0.9 1.1 0.5 0.9 1.1 1.0 0.4 DOWN BY….. -32%Cruise <strong>Vessel</strong>s 0.7 0.4 0.5 1.3 1.5 1.3 0.2 0.1 0.1 UP BY…. 66%Ro-Ro Ferries 0.4 0.4 0.2 0.5 0.8 0.5 0.2 0.4 0.2 DOWN BY….. -8%Total Special <strong>Vessel</strong>s 11.1 10.0 8.8 10.9 11.4 18.5 11.5 10.8 15.4 UP BY…. 145%TotalContractingRecently Confirmed Shipbuilding ContractsDate Type Dwt Unit DeliveryBuilder Hull No. $m. OwnerJul-03 Suezmax 159,000 1 2006 Hyundai H.I. 46.50 Marmaras Nav. Ltd.Jul-03 Suezmax 159,000 1 2006 Hyundai H.I. 46.50 Marmaras Nav. Ltd.Jul-03 Aframax 105,000 1 2005 Waigaoqiao S/Y Cardiff Marine Inc.Jul-03 Aframax 105,000 1 2006 Waigaoqiao S/Y Cardiff Marine Inc.Jul-03 Panamax 63,000 1 2006 Kras. Barrikady Caspian Maritime LtdJul-03 Panamax 63,000 1 2006 Sadra Shipyard Caspian Maritime LtdJul-03 Panamax 63,000 1 2005 Sadra Shipyard Caspian Maritime LtdJul-03 Panamax 63,000 1 2005 Sadra Shipyard Caspian Maritime LtdJul-03 Panamax 63,000 1 2006 Sadra Shipyard Caspian Maritime LtdJul-03 Handy Prod 46,000 1 2006 Hyundai Mipo 27.00 Athenian TankersJul-03 Small/Spec 3,200 1 2004 Turkter-Tersane Unknown OwnerJul-03 Small/Spec 3,200 1 2004 Turkter-Tersane Unknown OwnerJul-03 Panamax 74,000 1 2005 Jiangnan S/Yard Diana Shpg. AgenciesJul-03 Panamax 74,000 1 2005 Jiangnan S/Yard Diana Shpg. AgenciesJul-03 Handymax 56,000 1 2006 Mitsui S.B. Yasa Shpg. IndustryJul-03 Handymax 48,600 1 2005 I.H.I. Norden D/S A/SJul-03 Panamax 99,700 8,100 TEU 1 2007 Samsung S.B. Reederei C.-P. OffenJul-03 Panamax 99,700 8,100 TEU 1 2006 Samsung S.B. Reederei C.-P. OffenJul-03 Panamax 99,700 8,100 TEU 1 2006 Samsung S.B. Reederei C.-P. OffenJul-03 Panamax 99,700 8,100 TEU 1 2006 Samsung S.B. Reederei C.-P. OffenJul-03 Panamax 98,000 7,700 TEU 1 2006 I.H.I. Blue Star ReedereiJul-03 Panamax 97,000 7,500 TEU 1 2006 Hyundai H.I. Hyundai MerchantJul-03 Panamax 97,000 7,500 TEU 1 2006 Hyundai H.I. Hyundai Merchant1995 1996 1997 1998 1999 2000 2001 2002 Jul* This Year v. LastAll <strong>Vessel</strong>s Types 27.2 24.6 33.0 25.3 30.5 45.9 31.1 33.5 40.0 UP BY…. 104%Clarkson Research Studies Page 5Million GT Ordering TrendsMillion GT Ordering TrendsMillion GT Ordering TrendsN.B. Details of special cargo ships orderbook, in terms of special units of measurement e.g. cbm, teu, '000 cuft. etc. may be found in the blue centre pages. - denotes figureunavailable.Aug-03
20.018.016.014.012.010.08.06.04.02.00.0Mar-96Sep-96Quarterly Deliveries (DWT)Tankers <strong>Bulk</strong>ers GasContainer OtherMar-97Sep-97Mar-98Sep-98Mar-99Sep-99Mar-00Deliveries by <strong>Vessel</strong> TypeSep-00Mar-01Sep-01Source: Clarkson Research StudiesMar-02Sep-02Mar-03Summary• Deliveries of all ship types to the end of Julynumber 607 vessels of 32.2m dwt, of which 5.9m dwtwere delivered during July.Tankers• Six VLCCs were delivered during July, includingthe 310,000 dwt “FRONT HAWK” from Samsung toFrontline. Frontline has taken delivery of 12 VLCCsamounting to 3.6m dwt in the last three years.Dry <strong>Bulk</strong> Carriers• In the dry bulk carrier fleet, Carras Hellas tookdelivery of a 169,800 dwt Capesize “AQUABEAUTY”.The vessel is the third Capesize this year to join the CarrasHellas fleet, the others being the “AQUACHARM” andthe “AQUAJOY”. The trio were built at Sasebo HI.Containerships• The 6,200 teu Post-Panamax “NYK PEGASUS”joined the containership fleet in July. We expect anothertwo more Post-Panamax containerships to join the fleet inAugust.<strong>Bulk</strong> <strong>Vessel</strong>DeliveriesNo. end m.CGT, end: m. DWT, end:2002 Jul* 2002 Jul* 1999 2000 2001 2002 Jul* 2003 2004 2005VLCC > 200,000 39 25 1.9 1.2 9.0 12.3 7.8 12.3 7.8 11.5 8.8 7.2Suezmax 120-200,000 24 13 0.8 0.4 2.4 3.3 2.5 3.8 2.1 4.6 3.2 4.0Aframax 80-120,000 36 44 0.8 1.0 5.0 2.3 1.5 3.8 4.6 7.8 5.0 5.2Panamax 60-80,000 10 14 0.2 0.3 0.6 1.1 0.3 0.7 1.0 1.8 2.7 2.8Products 10-60,000 56 50 1.0 1.0 1.8 1.1 1.2 2.1 2.1 4.0 4.1 3.9Chemical 10-60,000 38 37 0.6 0.5 1.3 1.2 0.7 1.0 1.0 1.9 1.2 0.9Specialised 10-60,000 3 1 0.0 0.0 0.1 0.2 0.2 0.1 0.0 0.1 0.1 0.0Tankers > 10,000 206 184 5.4 4.5 20.2 21.4 14.2 23.7 18.5 31.7 25.1 24.0Tankers < 10,000 46 46 0.3 0.3 0.3 0.2 0.2 0.3 0.3 0.6 0.3 0.1Capesize > 80,000 25 18 0.6 0.5 4.3 6.1 5.4 4.1 2.9 4.5 5.6 5.1Panamax 60-80,000 56 11 1.1 0.2 4.7 4.0 8.3 4.2 0.8 1.7 4.2 3.5Handymax 40-60,000 86 41 1.3 0.6 1.9 1.8 5.1 4.3 2.1 3.6 3.3 2.7Handysize 10-40,000 56 33 0.6 0.4 1.8 1.4 1.6 1.5 0.9 1.7 1.7 0.8<strong>Bulk</strong>ers > 10,000 223 103 3.7 1.7 12.7 13.3 20.5 14.1 6.8 11.5 14.8 12.1Combos > 10,000 0 1 0.0 0.1 0.4 0.0 0.0 0.0 0.1 0.2 0.0 0.0Total <strong>Bulk</strong> <strong>Vessel</strong>s 475 334 9.5 6.6 33.7 34.9 35.0 38.1 25.7 44.0 40.1 36.2Special <strong>Vessel</strong>Deliveries2002 Jul* 2002 Jul* 2001 2000 2001 2002 Jul* 2003 2004 2005LNG Carriers 10 5 0.9 0.4 0.5 0.8 0.1 0.7 0.4 1.1 1.5 1.1LPG Carriers 24 16 0.3 0.3 0.3 0.5 0.5 0.3 0.4 0.8 0.3 0.3Reefers 2 1 0.0 0.0 0.2 0.1 0.0 0.0 0.0 0.1 0.0 0.0Containers > 3,000 teu 89 48 3.4 1.9 1.6 3.9 5.5 5.8 3.1 4.9 6.0 6.3Containers < 3,000 teu 113 58 1.6 0.8 1.9 2.0 2.5 2.5 1.2 2.3 1.7 0.8Other Dry > 5,000 dwt 89 43 1.6 0.8 1.8 2.1 1.1 1.2 0.7 1.7 1.3 0.7Offshore & Others 142 77 1.0 0.6 1.2 1.3 0.7 0.7 0.0 0.0 0.0 0.0Cruise <strong>Vessel</strong>s 14 10 1.4 0.8 0.1 0.1 0.1 0.1 0.0 0.1 0.1 0.0Ro-Ro Ferries 35 15 1.1 0.4 0.1 0.1 0.1 0.1 0.0 0.1 0.1 0.0Total Special <strong>Vessel</strong>s 518 273 11.4 6.1 7.7 10.9 10.7 11.5 5.9 11.1 10.9 9.2DeliveriesNo. endm.CGT, end:m. DWT, end:Total No. end m.CGT, end: m. DWT, end:Delivery TrendsDelivery TrendsDelivery Trends2002 Jul* 2002 Jul* 2001 2000 2001 2002 Jul* 2003 2004 2005All <strong>Vessel</strong>s Types 993 607 20.9 12.5 41.3 45.8 45.6 49.6 32.2 56.9 52.6 46.2N.B. Specialised ships deliveries in terms of other units of measurement (e.g. cbm, teu) are in the blue centre pages. * denotes data for year to date. Deliveries are those reportedClarkson Research Studies Page 6Aug-03
<strong>Bulk</strong> <strong>Vessel</strong>DeliveriesDeliveries by <strong>Vessel</strong> TypeType <strong>Vessel</strong> Name Flag Dwt Unit Delivery Builder OwnerVLCC Perseus Trader PA. 300,000 Jul 2003 Universal S.B. Mitsui O.S.K. LinesVLCC Front Hawk BS. 310,000 Jul 2003 Samsung S.B. Frontline Ltd.Panamax Kyriakoula GR. 72,000 Jul 2003 Hudong S/Yard Diamlemos Shpg. CorpPanamax Tamar M.I. 70,297 Jul 2003 Daewoo S.B. OMI Marine ServicesHandy Prod Cape Bon M.I. 35,000 Jul 2003 Hyundai Mipo Schoeller HoldingsHandy Prod Arctic Point CY. 37,000 Jul 2003 Hyundai Mipo Marlink Schiffs.Handy Prod St. Marco MA. 47,000 Jul 2003 Onomichi Dockyd Stargas S.r.l.Handy Chem Iblea IT. 35,000 Jul 2003 Brod. 3 Maj Ottavio NovellaSmall/Spec Woo Hyeon KO. 3,500 Jul 2003 Nokbong S.B. Woolim <strong>Shipping</strong>Small/Spec Belfin TU. 4,500 Jul 2003 Torlak Deniz. Gorkem DenizcilikLNG British Merchant BS. 75,000 138,000 cbm Jun 2003 Samsung S.B. BP Amoco Shpg. Ltd.Capesize Aquabeauty GR. 169,800 Jul 2003 Sasebo H.I. Carras HellasHandymax Ero L GR. 51,000 Jul 2003 Jiangnan S/Yard Vrontados <strong>Shipping</strong>Handysize Porchard AT. 37,500 Jul 2003 Shanghai Shpyd. Harren & PartnerPost Panamax NYK Pegasus PA. 78,000 6,200 TEU Jul 2003 Koyo Dock K.K. Nippon Yusen KaishaPanamax APL Shanghai LI. 42,200 3,100 TEU Jul 2003 Szczecin. Nowa Peter Dohle Schiff.Panamax Xin Chongqing PRC 50,500 4,050 TEU 2003 Hudong S/Yard China Shpg. Cont.Sub-Panamx Kota Gunawan PA. 36,000 2,700 TEU Jul 2003 Kanasashi K.K. Unknown OwnerSub-Panamx Cap Carmel LI. 33,750 2,524 TEU Jul 2003 Kv. Warnowwerft Ugland Int. HoldingsRo-Ro > 5K DWT Grand Blue PA. 9,450 Jul 2003 Higaki Zosen Unknown OwnerPCC > 5K DWT Heroic Ace PA. 21,000 Jun 2003 Minami Nippon Mitsui O.S.K. LinesOffshore C-Legend AM. 4,830 3,045 GT Jun 2003 North American Edison ChouestOffshore Harvey Explorer AM. 2,177 1,739 GT Jul 2003 Eastern S.B. Harvey Gulf Intl.1995 1996 1997 1998 1999 2000 2001 2002 Jul* 2003 2004 2005VLCC > 200,000 3.9 3.6 1.6 2.0 4.7 6.4 4.1 6.4 4.1 6.0 4.6 3.7Suezmax 120-200,000 0.6 0.7 0.9 1.7 1.3 1.8 1.3 2.0 1.1 2.4 1.7 2.1Aframax 80-120,000 0.7 0.8 1.0 2.0 2.8 1.3 0.9 2.1 2.6 4.2 2.7 2.8Panamax 60-80,000 0.1 0.1 0.0 0.0 0.4 0.6 0.2 0.4 0.6 1.0 1.5 1.6Products 10-60,000 0.7 1.0 0.5 0.8 1.1 0.7 0.8 1.4 1.3 2.5 2.6 2.4Chemical 10-60,000 0.2 0.4 0.5 0.7 0.8 0.7 0.4 0.6 0.6 1.2 0.7 0.6Specialised 10-60,000 0.1 0.2 0.1 0.1 0.1 0.1 0.1 0.1 0.0 0.1 0.1 0.0Tankers > 10,000 6.4 6.8 4.6 7.4 11.2 11.7 7.8 13.0 10.2 17.4 13.8 13.1Tankers < 10,000 0.2 0.2 0.2 0.3 0.2 0.1 0.1 0.2 0.2 0.4 0.2 0.1Capesize > 80,000 3.0 4.1 3.8 1.1 2.2 3.1 2.8 2.1 1.5 2.3 2.8 2.6Panamax 60-80,000 2.2 1.7 2.8 2.3 2.5 2.1 4.4 2.2 0.4 0.9 2.2 1.8Handymax 40-60,000 2.2 2.6 2.1 2.1 1.1 1.0 2.9 2.6 1.2 2.2 2.0 1.6Handysize 10-40,000 1.3 1.4 1.6 1.2 1.1 0.9 1.0 1.0 0.6 1.1 1.0 0.5Dry <strong>Bulk</strong> > 10,000 8.7 9.7 10.4 6.7 6.9 7.2 11.2 7.8 3.7 6.4 8.0 6.5Combos > 10,000 0.0 0.2 0.2 0.0 0.3 0.0 0.0 0.0 0.1 0.1 0.0 0.0Total <strong>Bulk</strong> <strong>Vessel</strong>s 15.3 16.9 15.4 14.3 18.6 19.0 19.2 21.0 14.2 24.3 22.0 19.7Special <strong>Vessel</strong>Deliveries1995 1996 1997 1998 1999 2000 2001 2002 Jul* 2003 2004 2005LNG Carriers 0.5 0.7 0.5 0.4 0.7 1.2 0.1 1.0 0.5 1.5 2.0 1.5LPG Carriers 0.2 0.4 0.3 0.2 0.3 0.4 0.4 0.3 0.4 0.7 0.2 0.2Reefers 0.0 0.1 0.2 0.2 0.2 0.1 0.0 0.0 0.0 0.1 0.0 0.0Containers > 3,000 teu 2.3 2.6 3.0 3.2 1.5 3.5 5.0 5.2 2.8 4.6 5.5 5.8Containers < 3,000 teu 1.6 2.1 2.9 2.9 1.5 1.5 2.0 1.9 1.0 1.8 1.4 0.7Other Dry > 5,000 dwt 1.2 1.0 1.3 2.4 2.8 3.2 1.7 1.7 0.9 2.3 1.9 1.4Offshore & Others 0.2 0.4 0.5 0.6 1.0 0.9 0.6 0.6 0.4 0.4 0.0 0.0Cruise <strong>Vessel</strong>s 0.4 0.6 0.4 0.7 0.6 0.7 0.8 1.1 0.6 1.1 0.9 0.2Ro-Ro Ferries 0.3 0.5 0.3 0.3 0.2 0.3 0.8 0.6 0.2 0.4 0.4 0.1Total Special <strong>Vessel</strong>s 6.8 8.3 9.3 10.9 8.7 11.8 11.4 12.5 6.9 12.9 12.4 9.9TotalDeliveriesRecent Shipbuilding DeliveriesMillion GTMillion GTMillion GTDelivery TrendsDelivery TrendsDelivery Trends1995 1996 1997 1998 1999 2000 2001 2002 Jul* 2003 2004 2005All <strong>Vessel</strong>s Types 22.0 25.2 24.7 25.2 27.3 30.7 30.6 33.5 21.0 37.9 35.1 29.7N.B. Specialised ships deliveries in terms of other units of measurement (e.g. cbm, teu) are in the blue centre pages. * denotes data for year to date. Deliveries are those reportedClarkson Research Studies Page 7 Aug-03
90.085.080.075.070.065.060.055.050.045.040.035.030.025.020.0$m<strong>Bulk</strong> <strong>Vessel</strong>Prices…Tanker Newbuilding PricesVLCCAframaxHandyShipbuilding Price TrendsPrice $ million, endPrice DevelopmentsSummary• It has been a mixed month for tanker pricedevelopments. Suezmax tanker prices increased by $0.25mcompared to last month to $46.50m. Marmaras is reportedto have ordered three Suezmax tankers from Hyundai HI at$46.50m each for delivery in 2006. Aframax prices alsofirmed during the month by $0.25m to $37.50m. CardiffMarine Inc placed an order for two Aframax fromWaigaoqiao Shipyard, but the price was not reported.Product Tanker prices came off slightly by $0.25m to$29.00m, and it is interesting to note that during JulyAthenian Tankers ordered two 46,000dwt Product Tankersfrom Hyundai Mipo.• In the dry bulk carrier sector, Capesize prices roseby $0.5m during July to $39.00m, and the price trend isnow a firm 15% growth on a year ago. The Panamaxsector is also showing double-digit growth.• Prices in the Containership sector have yet to reallytake off even though demand is very strong. A whole raftof Post-Panamax containerships were ordered in July, butprice increases have been a modest 7% year-on-year, butthere could be a sting in the tail. According to ournewbuilding brokers the yards are now holding off onquoting in the short term because of rising costs.Price Trend Against a1995 1996 1997 1998 1999 2000 2001 2002 Jul* Year Ago Is…VLCC 300,000 dwt 85.00 82.00 83.00 72.50 69.00 76.50 70.00 63.50 67.00 FIRMER... 3.9%Suezmax 150,000 dwt 54.00 51.00 52.00 44.00 42.50 52.50 46.50 43.75 46.50 FIRMER... 6.9%Aframax 110,000 dwt 43.50 40.50 41.00 34.50 33.00 41.50 36.00 34.75 37.25 STRONG... 9.6%Panamax 70,000 dwt 37.50 37.00 31.00 31.00 36.00 32.00 31.25 33.50 STRONG... 13.6%Handy 47,000 dwt 33.50 31.50 31.50 26.00 26.00 29.50 26.25 27.00 29.25 STRONG... 11.4%Capesize 170,000 dwt 42.50 39.00 40.50 33.00 35.00 40.50 36.00 36.25 39.00 STRONG... 14.7%Panamax 75,000 dwt 28.50 26.50 27.00 20.00 22.00 22.50 20.50 21.50 23.25 STRONG... 10.7%Handymax 51,000 dwt 24.00 23.00 22.50 18.00 20.00 20.50 18.50 19.00 20.25 FIRMER... 6.6%Handysize 30,000 dwt 19.50 19.00 18.00 14.25 15.50 15.00 14.50 15.00 16.25 STRONG... 8.3%Price Index 140 133 131 111 107 114 108 106 110 FIRMER... 5.0%% change -6% -2% -15% -4% 7% -5% -3% 4%Other <strong>Vessel</strong>Prices…SuezmaxPanamaxJul-98Oct-98Jan-99Apr-99Jul-99Oct-99Jan-00Apr-00Jul-00Oct-00Jan-01Apr-01Jul-01Oct-01Jan-02Apr-02Jul-02Oct-02Jan-03Apr-03Jul-03Source: Clarkson Research StudiesPrice $ million, endPrice Trend Against a1995 1996 1997 1998 1999 2000 2001 2002 Jul* Year Ago Is…LNG 138,000 m 3 230.0 220.0 230.0 190.0 165.0 172.5 165.0 150.0 150.0 SOFTER... -3.2%LPG 78,000 m 3 70.00 68.00 62.00 58.00 56.00 60.00 60.00 58.00 60.00 FIRMER... 3.4%Container 725 teu 18.00 17.00 13.50 14.00 14.00 13.00 13.00 14.25 STRONG... 9.6%Container 1,000 teu 21.00 20.00 18.00 17.50 18.00 15.50 15.50 16.75 STRONG... 8.1%Container 1,700 teu 31.00 29.00 24.50 23.00 25.00 21.50 21.00 22.25 FIRMER... 6.0%Container 2,000 teu 35.00 33.00 29.00 28.00 31.50 28.00 27.00 28.25 FIRMER... 4.6%Container 2,750 teu 38.00 38.00 31.00 33.00 37.50 31.00 29.50 33.00 STRONG... 11.9%Container 3,500 teu 52.00 50.00 42.00 38.00 41.50 36.00 33.00 37.50 STRONG... 13.6%Container 4,600 teu 54.00 52.00 45.00 50.00 STRONG... 11.1%Container 6,200 teu 73.00 72.00 60.00 64.00 FIRMER... 6.7%Ro-Ro 1,2-1,300 Lm 24.00 19.50 21.50 20.00 19.00 18.50 19.25 STEADY... 1.3%Ro-Ro 2,3-2,700 Lm 37.00 30.00 32.50 33.00 31.00 31.00 32.00 FIRMER... 3.2%Sources: <strong>Clarksons</strong>. Ro-Ro prices for 1997 are averages not end year. All historial data refers to standard vessel sizes published at the time. The dwt sizes quoted refer to thelatest spec. in that vessel sector, and new vessel sizes are introduced from time to time. Tanker and Capesize prices are for double-hull vessels; VLCCs from 1992, Suezmax &Aframax from 1990. Panamax and Handy Tankers are coated. Price data assumes a "European spec", with 10/10/10/70% payments, basis "first class competitive yards".Price data latest available at time of press. NB Price Index is value at the end of the previous month.Clarkson Research Studies Page 8Aug-03
353025201510509.20.99.43.6Shipbuilding Investment & Key RatiosInvestment in <strong>Bulk</strong> <strong>Vessel</strong>s ($bn.)Total ContainerTotal GasTotal <strong>Bulk</strong> CarriersTotal Tankers7.71.35.36.63.02.35.711.55.50.90.73.0 6.86.26.54.012.33.65.46.33.112.1 11.04.24.1 2.9 1.06.08.710.54.711.11995 1996 1997 1998 1999 2000 2001 2002 2003Source: Clarkson Research StudiesInvestment Scene This MonthNewbuilding Investment Summary• Despite the holidays and the comfortable orderbook,the orders are still coming in, and owners are keen to takeadvantage of options before the current round of price risesbecomes too steep. In recent months, yards have foundthemselves squeezed by substantial increases in the cost ofpumps, engines generators and other components assuppliers take advantage of high levels of demand from theshipyards to increase their own margins, which had beenunder pressure through low newbuilding prices in recentyears.• So, whilst prices have risen substantially in mostsectors this year, yards' margins have not actually increasedas much as their direct costs. In addition to material costs,yards are also facing the prospect of increasing labour costsand appreciating currencies. As a result, buyers should beprepared to see prices continuing to rise during theremainder of the year as the shipyards take advantage ofscarce capacity and strong demand to increase their margins.InvestmentTrends1995 1996 1997 1998 1999 2000 2001 2002 JulVLCC > 200,000 0.3 1.6 4.0 2.1 1.7 4.1 1.6 1.1 2.1 UP BY…. 231.1%Suezmax 120-200,000 0.6 0.9 1.5 0.8 0.3 2.2 1.0 0.7 1.6 UP BY…. 318.8%Aframax 80-120,000 0.7 1.2 2.0 1.1 0.3 2.1 2.8 1.5 2.0 UP BY…. 129.2%Panamax 60-80,000 0.0 0.0 0.4 0.5 0.1 0.2 1.0 1.4 1.2 UP BY…. 56.6%Handy 10-60,000 2.0 3.0 3.5 1.6 1.6 3.5 4.6 4.1 4.1 UP BY…. 71.7%Total Tankers 3.6 6.6 11.5 6.2 4.0 12.1 11.0 8.7 11.1 UP BY…. 118.4%Capesize > 80,000 1.9 0.6 1.6 0.9 1.4 1.1 0.9 1.5 1.8 UP BY…. 102.7%Panamax 60-80,000 2.7 1.4 1.8 1.1 2.7 1.1 0.6 1.5 1.3 UP BY…. 46.2%Handymax 40-60,000 2.5 1.9 1.0 0.4 1.8 2.1 1.0 1.8 1.2 UP BY…. 12.2%Handysize 10-40,000 2.4 1.5 1.3 0.5 1.0 1.1 0.7 1.2 0.5 DOWN BY….. -31.8%Total <strong>Bulk</strong> Carriers 9.4 5.3 5.7 3.0 6.8 5.4 3.1 6.0 4.7 UP BY…. 34.3%LNG 0.7 1.3 2.1 0.2 0.8 3.3 3.8 2.8 0.8 DOWN BY….. -52.2%LPG > 60,000m³ 0.2 0.0 0.3 0.5 0.1 0.4 0.4 0.1 0.2 UP BY…. 481%Container > 3,000 teu 4.5 2.8 1.1 3.7 4.6 7.9 4.3 3.1 9.1 UP BY…. 404.2%Container 1-3,000 teu 4.7 4.8 2.0 1.8 1.8 4.4 2.0 1.1 1.4 UP BY…. 108.5%Container < 1,000 teu 1.9 2.0 0.7 0.6 0.2 0.5 0.8 0.6 0.9 UP BY…. 161.7%Total Specialised 12.0 11.0 6.1 6.8 7.6 16.4 11.2 7.7 12.4 UP BY…. 176.5%Total 25.1 22.9 23.3 16.0 18.4 33.8 25.4 22.4 28.2 UP BY…. 115.6%% Change -9% 2% -31% 15% 84% -25% -12%Price Ratiosfor InvestorsValue $ billionPrice Ratios (Secondhand/Newbuilding)1995 1996 1997 1998 1999 2000 2001 2002 Jul v. End last YearVLCC 5 Yr. Old 64% 71% 78% 69% 77% 93% 83% 85% 91% UP BY…. 7.1%Suezmax 5 Yr. Old 70% 83% 85% 83% 82% 93% 84% 87% 95% UP BY…. 8.9%Aframax 5 Yr. Old 74% 85% 88% 68% 79% 94% 89% 76% 89% UP BY…. 16.2%Panamax 5 Yr. Old n/a 85% 88% 81% 79% 85% 73% 64% 81% UP BY…. 25.9%Handy 5 Yr. Old 67% 78% 86% 81% 77% 83% 78% 72% 80% UP BY…. 10.8%Tanker Average 69% 81% 85% 76% 79% 90% 81% 77% 87% UP BY…. 13.1%Capesize 5 Yr. Old 77% 72% 85% 78% 83% 75% 75% 80% 85% UP BY…. 5.8%Panamax 5 Yr. Old 75% 74% 81% 70% 76% 71% 68% 79% 82% STEADY…. 3.4%Handymax 5 Yr. Old 88% 82% 80% 69% 80% 74% 72% 75% 79% UP BY…. 5.3%Handysize 5 Yr. Old 85% 68% 76% 65% 74% 80% 76% 75% 80% UP BY…. 6.7%<strong>Bulk</strong> Carrier Average 81% 74% 81% 71% 78% 75% 73% 77% 81% UP BY…. 5.3%NB: The SH/NB ratios have been altered as above. The end 2001 figures have been adjusted in the same manner and the percentage changerepresents the gain/loss over the end 2001 value.Clarkson Research Studies Page 9Investment TrendsThis Year …Price Ratio TrendsAug-03
Orderbook by Country/RegionGlobal Orderbook 2003 by cgtP.R. China12.8%Europe18.2%South Korea46.4%Asian Orderbook 2003 by cgtP.R. China15.5%Others1.9%Japan34.7%Other Asia3.5%European Orderbook 2003 by cgtPoland15%Croatia9%SouthKorea38.4%Japan28.7%Spain7%Other Europe35%Source (all graphs): Clarkson Research StudiesItaly18%Germany16%MajorShipbuildersMillion DWTFor Delivery in:1993 1994 1995 1996 1997 1998 1999 2000 2001 2002 2003* 2003 2004 2005+Japan 5.38 20.24 26.54 28.67 36.08 36.20 34.42 37.94 39.40 40.87 47.98 7.78 19.51 20.69South Korea 4.83 12.90 22.26 23.01 31.09 33.95 36.66 50.34 46.66 45.11 60.08 9.24 21.34 29.50Taiwan 0.17 1.46 2.05 1.63 1.26 1.72 2.26 1.98 1.47 1.17 2.04 0.21 0.94 0.90P.R. China 0.30 2.10 4.62 5.70 5.23 4.03 7.77 9.57 12.02 15.12 20.44 4.15 6.76 9.52Other Asia 0.26 0.63 0.77 1.01 1.02 0.85 0.89 0.88 0.83 1.75 1.68 0.35 0.75 0.58TOTAL ASIA 10.94 37.32 56.24 60.02 74.68 76.76 81.99 100.71 100.38 104.02 132.22 21.73 49.30 61.20Germany 0.04 1.42 2.02 2.08 1.67 1.46 1.28 1.99 2.01 1.46 1.62 0.55 0.77 0.30Denmark 0.90 1.09 1.54 1.07 0.94 0.80 0.91 0.49 1.13 0.64 0.68 0.21 0.40 0.06France 0.37 0.23 0.21 0.13 0.07 0.10 0.07 0.07 0.06 0.08 0.14 0.01 0.05 0.08Italy 0.07 0.22 1.19 1.00 0.95 0.88 0.52 0.55 0.53 0.51 0.43 0.30 0.10 0.03Netherlands 0.01 0.07 0.17 0.35 0.43 0.51 0.37 0.36 0.48 0.59 0.54 0.14 0.28 0.12Spain 0.08 0.89 1.21 0.76 1.23 1.02 0.45 0.40 0.78 0.83 0.70 0.35 0.25 0.10Finland 0.33 0.39 0.38 0.23 0.07 0.06 0.05 0.08 0.06 0.06 0.05 0.01 0.04 0.00Norway 0.19 0.24 0.38 0.35 0.44 0.30 0.23 0.36 0.40 0.26 0.16 0.14 0.02 0.00Turkey 0.12 0.22 0.28 0.34 0.33 0.36 0.20 0.28 0.29 0.26 0.36 0.15 0.12 0.09Poland 0.09 1.32 2.47 2.00 1.67 1.40 1.40 2.90 2.34 1.91 2.11 0.64 0.70 0.77Ukraine 0.06 0.47 0.84 0.67 0.53 0.49 0.44 0.44 0.45 0.46 0.51 0.26 0.20 0.06Croatia 0.00 0.57 0.68 0.93 1.25 0.91 0.81 1.65 2.37 2.02 2.17 0.56 0.93 0.68Other Europe 0.88 1.07 1.56 1.40 1.37 1.26 1.18 1.01 1.06 0.90 1.12 0.55 0.30 0.27TOTAL EUROPE 3.13 8.19 12.94 11.29 10.95 9.56 7.90 10.58 11.95 9.98 10.60 3.88 4.16 2.56Brazil 0.25 0.25 0.18 0.08 0.18 0.06 0.06 0.05 0.51 0.62 0.63 0.05 0.25 0.32USA 0.21 0.32 0.43 0.67 1.11 1.00 0.85 1.48 1.60 1.47 1.44 0.48 0.41 0.55Others 0.07 0.07 0.07 0.08 0.08 0.08 0.06 0.03 0.04 0.04 0.01 0.00 0.01 0.00TOTAL OTHERS 0.53 0.63 0.68 0.84 1.36 1.14 0.96 1.56 2.15 2.12 2.09 0.53 0.67 0.88GLOBAL TOTAL 14.59 46.15 69.86 72.15 86.98 87.46 90.86 112.85 114.47 116.12 144.91 26.14 54.13 64.64*after a year indicates data are the latest year to date figures.Clarkson Research Studies Page 10Aug-03
MajorShipbuildersOrderbook by Country/RegionMillion CGTFor Delivery in:1993 1994 1995 1996 1997 1998 1999 2000 2001 2002 2003* 2003 2004 2005+Japan 2.7 7.2 9.9 11.6 13.5 11.8 11.2 12.3 12.9 14.2 16.4 1.0 6.7 6.8South Korea 1.4 3.9 7.2 7.4 9.0 9.9 11.4 15.8 15.4 15.6 22.0 1.4 7.6 11.5Taiwan 0.0 0.5 0.5 0.7 0.5 0.7 0.8 0.7 0.6 0.4 0.8 2.4 0.3 0.5P.R. China 0.1 0.8 1.9 2.5 2.5 2.1 3.1 4.0 5.0 5.8 7.3 1.2 2.5 3.1Other Asia 0.1 0.3 0.4 0.5 0.6 0.5 0.4 0.5 0.5 0.8 0.8 0.7 0.4 0.2TOTAL ASIA 4.4 12.7 19.9 22.7 26.1 25.1 26.9 33.3 34.4 36.8 47.4 6.7 17.4 22.1Germany 0.1 1.3 2.1 1.9 1.6 2.0 2.4 3.0 2.5 1.7 1.7 0.5 0.9 0.3Denmark 0.5 0.7 0.9 0.7 0.6 0.5 0.5 0.3 0.7 0.4 0.4 0.1 0.2 0.0France 0.4 0.4 0.5 0.4 0.4 0.8 1.1 1.1 0.8 0.6 0.5 0.2 0.1 0.1Italy 0.1 0.5 1.7 2.1 2.5 2.4 2.4 2.9 2.4 1.9 1.8 0.5 0.7 0.5Netherlands 0.0 0.1 0.3 0.5 0.4 0.6 0.5 0.4 0.5 0.5 0.4 0.1 0.2 0.1Spain 0.1 0.4 0.7 0.6 0.9 0.7 0.4 0.6 0.8 0.8 0.8 0.3 0.4 0.1Finland 0.6 1.1 0.9 0.7 0.5 0.5 0.7 1.1 0.9 0.6 0.5 0.2 0.3 0.0Norway 0.2 0.3 0.5 0.5 0.7 0.5 0.4 0.5 0.6 0.4 0.2 0.1 0.1 0.0Turkey 0.1 0.1 0.2 0.3 0.2 0.3 0.2 0.3 0.3 0.2 0.3 0.1 0.1 0.1Poland 0.1 0.8 1.4 1.1 0.9 0.9 1.0 1.8 1.5 1.4 1.6 0.4 0.6 0.6Ukraine 0.1 0.3 0.5 0.4 0.3 0.3 0.2 0.2 0.2 0.3 0.3 0.1 0.1 0.1Croatia 0.0 0.3 0.3 0.5 0.7 0.6 0.5 0.8 1.0 0.8 1.0 0.2 0.4 0.4Other Europe 0.4 0.5 0.8 0.8 0.9 1.0 1.0 0.9 1.0 0.9 1.0 0.6 0.3 0.1TOTAL EUROPE 2.5 6.9 10.9 10.4 10.6 10.9 11.2 13.8 13.1 10.5 10.4 3.6 4.4 2.4Brazil 0.1 0.1 0.1 0.1 0.1 0.1 0.1 0.1 0.2 0.3 0.4 0.1 0.1 0.1USA 0.1 0.3 0.5 0.7 1.1 0.9 0.7 0.8 0.8 0.7 0.7 0.3 0.2 0.1Others 0.1 0.1 0.2 0.2 0.2 0.2 0.1 0.1 0.1 0.1 0.1 0.0 0.0 0.0TOTAL OTHERS 0.3 0.5 0.7 0.9 1.3 1.1 0.9 1.0 1.1 1.1 1.1 0.4 0.4 0.3GLOBAL TOTAL 7.2 20.1 31.5 34.0 38.1 37.2 39.0 48.1 48.6 48.4 58.8 10.7 22.2 24.7MajorShipbuildersNumbers of <strong>Vessel</strong>sFor Delivery in:1993 1994 1995 1996 1997 1998 1999 2000 2001 2002 2003* 2003 2004 2005+Japan 76 336 489 595 657 533 501 538 529 603 660 134 282 244South Korea 40 153 298 292 312 317 364 513 475 483 675 97 239 339Taiwan 2 22 27 38 32 36 33 30 24 17 28 2 12 14P.R. China 11 58 151 217 210 180 208 248 313 361 451 114 163 174Other Asia 13 34 42 50 61 50 35 42 53 78 82 34 33 15TOTAL ASIA 142 603 1007 1192 1272 1116 1141 1371 1394 1542 1896 381 729 786Germany 4 64 112 116 98 89 78 105 108 83 88 30 43 15Denmark 18 31 32 29 24 19 12 11 15 7 10 2 7 1France 5 7 9 8 10 15 17 13 8 8 7 2 2 3Italy 9 14 56 64 74 69 46 49 45 44 46 23 15 8Netherlands 1 8 23 54 68 93 71 62 68 86 78 23 40 15Spain 6 29 44 44 51 33 23 22 28 35 33 14 17 2Finland 7 16 13 10 9 8 6 10 10 6 5 1 4 0Norway 11 22 36 44 64 44 24 42 60 48 32 25 7 0Turkey 4 16 24 34 28 35 26 38 43 40 50 25 18 7Poland 4 62 97 76 63 59 60 91 68 49 59 18 23 18Ukraine 7 17 25 19 17 14 13 13 14 21 28 7 13 8Croatia 0 14 18 26 35 28 23 36 48 39 48 9 19 20Other Europe 36 59 82 88 106 139 127 104 109 103 113 60 38 15TOTAL EUROPE 112 359 571 612 647 645 526 596 624 569 597 239 246 112Brazil 6 6 5 4 5 7 7 7 16 26 30 8 10 12USA 6 9 22 32 87 64 37 30 61 65 58 31 19 8Others 10 16 15 13 13 14 9 7 9 9 6 2 4 0TOTAL OTHERS 22 31 42 49 105 85 53 44 86 100 94 41 33 20GLOBAL TOTAL 276 993 1620 1853 2024 1846 1720 2011 2104 2211 2587 661 1008 918*after a year indicates data are the latest year to date figures.Clarkson Research Studies Page 11 Aug-03
Contracting by Country/RegionOther Dry8%<strong>Bulk</strong>39%Japanese Contracts in 2003 (GT)Tanker38%Other12%Korean Contracts in 2003 (GT)L.N.G.1%<strong>Bulk</strong>35%Chem.7%L.N.G.1%PassengerL.P.G.0%1%Chemical12%Summary• So far this year the Asian shipyards have won 20.4mcgt out of the 22.9m cgt of orders placed, so these yards areextending their lead.Japan• The Japanese share of the global orderbook remainsstatic at 28.7%, and the number of ships ordered so far thisyear in Japanese yards has slipped behind South Korea to660 ships. During July Mitsubishi HI won a substantial tenshiporder from Evergreen Marine for 6,724 teu fully cellularPost-Panamax containerships.China• While the South Korean and Japanese yards have wonorders in July from both domestic and foreign owners, nearlyall orders placed in July came from a foreign client base.This could change radically if China bows to pressure toraise the exchange rate, making its exports more expensive toproduce.South Korea• So far this year owners have contracted 675 vesselswith South Korean yards, with over 10% (69 ships) orderedin July. Nearly half of the ships ordered in July are fullycellular containerships with a capacity of 208,470 teu.ainer%Tanker35%Others5%MajorShipbuilders1993 1994 1995 1996 1997 1998 1999 2000 2001 2002 2003*Japan 4.5 17.7 17.1 17.7 22.8 14.9 16.2 22.4 21.0 20.9 19.4 UP BY…. 59.2%South Korea 4.6 9.0 11.5 10.7 0.0 14.7 18.2 32.7 14.4 19.1 28.5 UP BY…. 155.4%Taiwan 0.2 1.3 1.1 0.7 0.8 1.1 1.2 0.5 0.1 0.7 1.3 UP BY…. 199.7%P.R. China 0.3 1.9 2.7 2.4 1.7 1.4 5.6 4.3 5.4 6.6 8.8 UP BY…. 126.0%Other Asia 0.0 0.4 0.3 0.5 0.2 0.4 0.5 0.4 0.5 1.4 0.3 DOWN BY… -69.9%TOTAL ASIA 9.6 30.3 32.6 32.1 25.5 32.3 41.7 60.3 41.3 48.8 58.2 UP BY…. 104.4%Germany 0.0 1.4 1.3 1.3 0.8 1.0 0.6 1.6 0.9 0.6 0.6 UP BY…. 76.9%Denmark 0.9 0.3 0.7 0.1 0.4 0.4 0.6 0.0 1.1 0.0 0.3 UP BY….France 0.0 0.0 0.0 0.0 0.0 0.0 0.0 0.0 0.0 0.0 0.1 UP BY…. 177.5%Italy 0.0 0.2 1.0 0.2 0.4 0.2 0.1 0.2 0.1 0.1 0.1 UP BY…. 10.8%Netherlands 0.0 0.1 0.1 0.3 0.3 0.3 0.1 0.3 0.4 0.4 0.1 DOWN BY… -55.3%Spain 0.1 0.8 0.4 0.4 0.8 0.3 0.0 0.3 0.4 0.1 0.0 DOWN BY… -40.3%Finland 0.3 0.1 0.1 0.0 0.0 0.0 0.0 0.0 0.0 0.0 0.0 DOWN BY… -100.0%Norway 0.2 0.1 0.2 0.1 0.3 0.1 0.1 0.3 0.2 0.1 0.0 DOWN BY… -33.7%Turkey 0.1 0.1 0.1 0.1 0.1 0.1 0.1 0.2 0.1 0.1 0.2 UP BY…. 202.6%Poland 0.1 1.3 1.5 0.3 0.5 0.6 0.7 2.2 0.2 0.2 0.5 UP BY…. 338.4%Ukraine 0.1 0.4 0.4 0.0 0.0 0.0 0.0 0.0 0.0 0.1 0.1 DOWN BY… -5.2%Croatia 0.0 0.6 0.1 0.7 0.5 0.1 0.3 1.1 1.1 0.2 0.5 UP BY…. 299.7%Other Europe 0.3 0.2 0.6 0.4 0.4 0.5 0.1 0.2 0.3 0.2 0.3 UP BY…. 223.1%TOTAL EUROPE 2.0 5.6 6.5 3.8 4.4 3.7 2.8 6.5 4.8 2.1 2.7 UP BY…. 119.4%Brazil 0.1 0.0 0.0 0.0 0.1 0.0 0.0 0.0 0.5 0.1 0.0 DOWN BY… -48.4%USA 0.2 0.1 0.1 0.2 0.5 0.3 0.1 0.8 0.4 0.1 0.0 DOWN BY… -61.2%Others 0.0 0.0 0.0 0.0 0.0 0.0 0.0 0.0 0.0 0.0 0.0 DOWN BY… -43.9%TOTAL OTHERS 0.3 0.1 0.1 0.3 0.7 0.3 0.1 0.8 0.9 0.3 0.1 DOWN BY… -55.0%GLOBAL TOTAL 12.0 36.0 39.3 36.2 30.6 36.3 44.6 67.7 47.1 51.2 60.9 UP BY…. 104.2%*after a year indicates data are the latest year to date figures.Million DWTTrends This Yearvs. Last YearClarkson Research StudiesPage 12Aug-03
MajorShipbuildersContracting by Country/RegionMillion CGTTrends This Year%1993 1994 1995 1996 1997 1998 1999 2000 2001 2002 2003*Japan 1.9 6.0 6.7 7.3 8.0 5.2 5.7 7.6 7.0 7.8 6.0 UP BY…. 32.0%South Korea 1.1 2.9 4.3 3.4 5.6 4.6 6.0 10.4 5.7 6.8 10.6 UP BY…. 166.2%Taiwan 0.0 0.5 0.3 0.4 0.3 0.5 0.3 0.3 0.1 0.2 0.6 UP BY…. 396.7%P.R. China 0.1 0.7 1.2 1.2 0.9 0.8 2.0 2.1 2.2 2.2 3.0 UP BY…. 128.8%Other Asia 0.0 0.2 0.0 0.3 0.2 0.2 0.2 0.3 0.3 0.6 0.2 DOWN BY… -49.0%TOTAL ASIA 3.2 10.2 12.5 12.6 15.0 11.3 14.2 20.6 15.1 17.6 20.4 UP BY…. 98.0%Germany 0.1 1.2 1.4 0.9 0.0 1.4 1.2 1.3 0.7 0.5 0.4 UP BY…. 50.4%Denmark 0.5 0.2 0.4 0.1 0.2 0.2 0.4 0.0 0.6 0.0 0.1 UP BY….France 0.0 0.2 0.1 0.1 0.2 0.6 0.6 0.3 0.2 0.1 0.1 UP BY…. 318.1%Italy 0.1 0.4 1.3 0.7 0.8 0.8 0.9 1.1 0.2 0.3 0.4 UP BY…. 135.7%Netherlands 0.0 0.1 0.3 0.3 0.3 0.4 0.2 0.4 0.3 0.3 0.1 DOWN BY… -50.1%Spain 0.1 0.4 0.3 0.2 0.5 0.1 0.1 0.4 0.4 0.2 0.0 DOWN BY… -66.1%Finland 0.6 0.5 0.1 0.3 0.1 0.3 0.3 0.7 0.1 0.2 0.0 DOWN BY… -100.0%Norway 0.2 0.2 0.2 0.3 0.5 0.1 0.3 0.4 0.3 0.2 0.0 DOWN BY… -51.2%Turkey 0.0 0.1 0.1 0.1 0.1 0.1 0.1 0.2 0.1 0.1 0.1 UP BY…. 185.9%Poland 0.1 0.8 0.8 0.2 0.3 0.4 0.6 1.3 0.1 0.4 0.4 UP BY…. 74.2%Ukraine 0.1 0.2 0.2 0.0 0.0 0.0 0.0 0.0 0.0 0.1 0.1 UP BY…. 13.1%Croatia 0.0 0.3 0.1 0.3 0.3 0.1 0.1 0.5 0.5 0.2 0.3 UP BY…. 249.6%Other Europe 0.2 0.2 0.4 0.3 0.4 0.4 0.2 0.3 0.3 0.2 0.2 UP BY…. 97.8%TOTAL EUROPE 1.8 4.8 5.7 3.8 3.7 5.0 4.8 6.8 3.9 2.7 2.4 UP BY…. 56.6%Brazil 0.0 0.0 0.0 0.0 0.0 0.0 0.0 0.0 0.2 0.1 0.1 DOWN BY… -24.0%USA 0.1 0.1 0.2 0.3 0.5 0.2 0.2 0.3 0.3 0.2 0.0 DOWN BY… -76.8%Others 0.0 0.1 0.1 0.1 0.1 0.1 0.1 0.1 0.0 0.1 0.0 DOWN BY… -26.8%TOTAL OTHERS 0.2 0.3 0.3 0.4 0.7 0.4 0.3 0.4 0.5 0.4 0.1 DOWN BY… -52.4%GLOBAL TOTAL 5.2 15.3 18.6 16.8 19.3 16.7 19.2 27.8 19.5 20.7 22.9 UP BY…. 89.9%MajorShipbuildersNumber of <strong>Vessel</strong>s1993 1994 1995 1996 1997 1998 1999 2000 2001 2002 2003*Trends This Year%Japan 65 338 417 437 436 279 312 352 338 386 252 UP BY…. 11.9%South Korea 36 125 198 131 199 156 208 337 178 229 331 UP BY…. 147.8%Taiwan 1 21 16 22 15 22 13 12 4 8 19 UP BY…. 307.1%P.R. China 10 50 103 111 75 68 118 132 143 151 173 UP BY…. 96.4%Other Asia 4 26 23 28 26 20 17 26 30 48 19 DOWN BY… -32.1%TOTAL ASIA 116 560 757 729 751 545 668 859 693 822 794 UP BY…. 65.6%Germany 2 62 93 77 47 64 40 78 49 32 30 UP BY…. 60.7%Denmark 18 18 12 14 9 9 7 4 12 0 6 UP BY….France 0 4 3 3 5 10 10 2 2 3 2 UP BY…. 14.3%Italy 3 9 46 23 27 19 13 20 13 12 14 UP BY…. 100.0%Netherlands 1 8 21 46 45 67 24 51 45 58 16 DOWN BY… -52.7%Spain 6 24 21 20 24 6 4 12 17 15 6 DOWN BY… -31.4%Finland 6 10 2 4 4 7 3 6 3 3 0 DOWN BY… -100.0%Norway 11 18 21 30 45 13 14 36 38 26 10 DOWN BY… -34.1%Turkey 2 12 13 14 10 18 8 23 23 14 23 UP BY…. 181.6%Poland 4 64 54 14 19 27 36 62 6 8 17 UP BY…. 264.3%Ukraine 7 11 10 0 2 0 0 0 4 11 7 UP BY…. 9.1%Croatia 0 14 4 19 14 4 6 23 23 8 17 UP BY…. 264.3%Other Europe 17 28 45 39 57 79 28 23 35 29 29 UP BY…. 71.4%TOTAL EUROPE 77 282 345 303 308 323 193 340 270 219 177 UP BY…. 38.6%Brazil 3 0 0 1 2 5 0 2 10 11 8 UP BY…. 24.7%USA 6 6 15 15 71 30 16 18 47 34 2 DOWN BY… -89.9%Others 9 13 10 9 9 9 5 6 5 6 2 DOWN BY… -42.9%TOTAL OTHERS 18 19 25 25 82 44 21 26 62 51 12 DOWN BY… -59.7%GLOBAL TOTAL 211 861 1127 1057 1141 912 882 1225 1025 1092 983 UP BY…. 54.3%*after a year indicates data are the latest year to date figures.Clarkson Research StudiesPage 13Aug-03
Deliveries by Country/Region252015m.CGTOtherNon-EUEUChinaS KoreaJapanScheduled Output by RegionSummary• So far this year deliveries have reached 32.2m dwt.Deliveries from Japanese yards increased 26% month-on-month to12.3m dwt, which is still 1.2m dwt down on South Korean outputso far this year. Furthermore while South Korea has only produced139 vessels compared to Japan’s 195, South Korean cgt output is0.4m cgt higher. South Korea also had the distinction of producingwhat could be the last combination carrier to be built, when the“SKS MERSEY” was delivered from Hyundai. Hyundai has built43% of the Combination Carrier fleet still in service.• Chinese deliveries of 3.4m dwt to the end of July 2003 arequickly closing in on the total for the whole of 2002.10EU Output6.0m. CGT5.054.03.02.00199319941995199619971998199920002001200220032004Source: Clarkson Research Studies200520061.00.019931994199519961997199819992000200120022003Source: Clarkson Research Studies200420052006MajorShipbuildersMillion DWTTrends This Yearvs. Last Year1993 1994 1995 1996 1997 1998 1999 2000 2001 2002 2003*Japan 14.2 12.9 14.5 16.0 15.5 14.8 18.1 18.9 19.6 19.4 12.3 UP BY…. 8.5%South Korea 8.1 6.9 10.2 11.9 0.0 11.8 15.5 19.0 18.0 20.7 13.5 UP BY…. 12.2%Taiwan 1.2 1.0 0.8 1.1 1.2 0.6 0.7 0.8 0.6 1.0 0.4 DOWN BY… -31.4%P.R. China 1.2 1.6 1.6 1.5 2.2 2.6 1.9 2.5 3.0 3.6 3.4 UP BY…. 63.0%Other Asia 0.1 0.1 0.2 0.4 0.2 0.5 0.4 0.4 0.5 0.5 0.3 UP BY…. 10.5%TOTAL ASIA 24.8 22.6 27.3 30.9 19.1 30.3 36.6 41.7 41.8 45.2 30.0 UP BY…. 13.7%Germany 1.0 1.2 1.2 1.3 1.2 1.2 0.7 0.9 0.8 1.1 0.4 DOWN BY… -34.2%Denmark 1.4 1.1 1.8 0.6 0.5 0.5 0.5 0.4 0.4 0.5 0.2 DOWN BY… -25.3%France 0.0 0.2 0.1 0.1 0.1 0.0 0.1 0.0 0.0 0.0 0.0 UP BY…. 62.9%Italy 0.4 0.7 0.5 0.6 0.4 0.3 0.5 0.2 0.1 0.1 0.1 UP BY…. 103.3%Netherlands 0.1 0.1 0.2 0.2 0.2 0.3 0.3 0.3 0.2 0.3 0.1 DOWN BY… -10.3%Spain 0.7 0.2 0.3 1.1 0.3 0.5 0.6 0.3 0.2 0.1 0.2 UP BY…. 295.0%Finland 0.1 0.0 0.1 0.2 0.2 0.0 0.0 0.0 0.0 0.0 0.0 DOWN BY… -67.4%Norway 0.1 0.2 0.1 0.2 0.2 0.2 0.2 0.1 0.1 0.2 0.1 STEADY…. -0.2%Turkey 0.1 0.0 0.0 0.1 0.1 0.1 0.2 0.1 0.1 0.1 0.1 DOWN BY… -10.6%Poland 0.5 0.8 0.6 0.9 0.8 0.9 0.7 0.7 0.8 0.6 0.3 DOWN BY… -25.4%Ukraine 0.3 0.3 0.3 0.3 0.2 0.0 0.0 0.0 0.0 0.1 0.0 DOWN BY… -100.0%Croatia 0.3 0.4 0.2 0.6 0.2 0.5 0.4 0.3 0.4 0.6 0.4 UP BY…. 8.2%Other Europe 0.8 0.6 1.0 0.9 0.5 0.6 0.2 0.4 0.3 0.3 0.1 DOWN BY… -33.9%TOTAL EUROPE 5.9 5.7 6.4 7.0 4.9 5.1 4.5 3.9 3.6 4.1 2.1 DOWN BY… -12.8%Brazil 0.5 0.5 0.3 0.3 0.1 0.1 0.0 0.0 0.0 0.0 0.0 UP BY…. 1040%USA 0.0 0.1 0.1 0.1 0.2 0.4 0.2 0.2 0.3 0.3 0.1 DOWN BY… -68.0%Others 0.0 0.0 0.0 0.0 0.1 0.0 0.0 0.1 0.0 0.0 0.0 UP BY…. 672.6%TOTAL OTHERS 0.6 0.5 0.4 0.4 0.3 0.5 0.3 0.2 0.3 0.3 0.1 DOWN BY… -39.2%GLOBAL TOTAL 31.2 28.9 34.1 38.2 24.3 35.9 41.3 45.8 45.6 49.6 32.2 UP BY…. 11.2%*after a year indicates data are the latest year to date figures.Clarkson Research Studies Page 14 Aug-03
MajorShipbuildersDeliveries by Country/RegionMillion CGTTrends This Year%1993 1994 1995 1996 1997 1998 1999 2000 2001 2002 2003*Japan 4.7 5.0 5.4 5.7 6.1 6.9 6.4 6.5 6.4 6.5 3.8 STEADY…. 0.6%South Korea 1.9 2.1 3.0 3.7 4.1 3.6 4.5 5.9 6.1 6.6 4.2 UP BY…. 10.2%Taiwan 0.3 0.3 0.3 0.2 0.4 0.3 0.3 0.3 0.2 0.3 0.2 DOWN BY… -8.2%P.R. China 0.4 0.6 0.6 0.6 1.0 1.2 1.0 1.2 1.1 1.5 1.4 UP BY…. 56.9%Other Asia 0.1 0.1 0.0 0.2 0.1 0.3 0.3 0.2 0.2 0.3 0.2 STEADY…. 2.8%TOTAL ASIA 7.4 8.1 9.3 10.5 11.7 12.3 12.4 14.2 14.1 15.3 9.8 UP BY…. 10.3%Germany 0.8 0.8 1.1 1.2 0.0 1.0 0.8 0.8 1.2 1.2 0.4 DOWN BY… -40.4%Denmark 0.4 0.3 0.4 0.4 0.4 0.3 0.3 0.2 0.2 0.3 0.1 DOWN BY… -19.0%France 0.1 0.2 0.2 0.3 0.2 0.2 0.2 0.3 0.4 0.3 0.3 UP BY…. 57.8%Italy 0.4 0.4 0.3 0.5 0.5 0.9 1.0 0.6 0.7 0.7 0.6 UP BY…. 30.4%Netherlands 0.2 0.1 0.3 0.2 0.3 0.3 0.3 0.4 0.3 0.3 0.2 DOWN BY… -10.3%Spain 0.2 0.2 0.2 0.4 0.2 0.3 0.3 0.3 0.2 0.1 0.1 UP BY…. 42.5%Finland 0.2 0.1 0.3 0.5 0.3 0.3 0.1 0.3 0.2 0.5 0.1 DOWN BY… -64.3%Norway 0.2 0.2 0.2 0.3 0.3 0.3 0.4 0.2 0.2 0.4 0.2 DOWN BY… -9.8%Turkey 0.0 0.0 0.0 0.0 0.1 0.1 0.1 0.1 0.1 0.1 0.1 STEADY…. -0.9%Poland 0.3 0.4 0.4 0.5 0.5 0.5 0.5 0.5 0.5 0.5 0.1 DOWN BY… -47.4%Ukraine 0.1 0.1 0.1 0.2 0.1 0.0 0.0 0.0 0.0 0.1 0.0 DOWN BY… -100.0%Croatia 0.1 0.2 0.1 0.3 0.1 0.2 0.2 0.2 0.2 0.3 0.2 DOWN BY… -8.6%Other Europe 0.4 0.3 0.5 0.5 0.4 0.4 0.3 0.3 0.2 0.3 0.2 DOWN BY… -16.4%TOTAL EUROPE 3.4 3.5 4.0 5.2 3.3 4.8 4.6 4.2 4.7 5.2 2.6 DOWN BY… -16.6%Brazil 0.2 0.2 0.1 0.1 0.0 0.0 0.0 0.0 0.0 0.0 0.0 UP BY…. 819.2%USA 0.0 0.0 0.1 0.1 0.2 0.5 0.3 0.3 0.3 0.3 0.1 DOWN BY… -50.6%Others 0.1 0.1 0.1 0.1 0.1 0.1 0.1 0.1 0.1 0.1 0.1 UP BY…. 50.0%TOTAL OTHERS 0.3 0.3 0.3 0.3 0.3 0.6 0.5 0.4 0.3 0.4 0.2 DOWN BY… -17.2%GLOBAL TOTAL 11.1 11.9 13.6 16.0 15.3 17.8 17.5 18.8 19.1 20.9 12.5 STEADY…. 3.1%MajorShipbuildersNumber of <strong>Vessel</strong>sTrends This Year%1993 1994 1995 1996 1997 1998 1999 2000 2001 2002 2003*Japan 249 276 330 345 380 410 346 318 349 312 195 UP BY…. 7.1%South Korea 82 101 137 157 180 151 162 188 216 221 139 UP BY…. 7.8%Taiwan 9 9 13 12 21 18 16 15 10 15 8 DOWN BY… -8.6%P.R. China 32 42 41 50 94 111 90 96 79 105 83 UP BY…. 35.5%Other Asia 17 18 26 28 17 42 32 19 20 23 15 UP BY…. 11.8%TOTAL ASIA 389 446 547 592 692 732 646 636 674 676 440 UP BY…. 11.6%Germany 57 60 76 78 68 73 51 51 46 57 25 DOWN BY… -24.8%Denmark 27 22 22 20 15 14 14 5 8 8 3 DOWN BY… -35.7%France 1 3 2 5 3 5 8 6 7 3 3 UP BY…. 71.4%Italy 22 22 14 19 18 24 37 17 17 13 12 UP BY…. 58.2%Netherlands 24 21 28 28 39 45 48 61 44 41 24 STEADY…. 0.3%Spain 9 10 9 21 17 24 16 13 13 8 8 UP BY…. 71.4%Finland 4 3 6 7 5 9 5 2 3 7 1 DOWN BY… -75.5%Norway 15 16 12 22 25 34 34 18 22 39 26 UP BY…. 14.3%Turkey 7 4 6 7 16 11 18 11 18 18 13 UP BY…. 23.8%Poland 24 25 32 38 33 31 35 31 29 27 7 DOWN BY… -55.6%Ukraine 9 9 9 9 4 3 1 0 3 4 0 DOWN BY… -100.0%Croatia 6 9 4 14 5 11 11 10 11 17 8 DOWN BY… -19.3%Other Europe 33 39 59 57 52 50 42 48 31 36 19 DOWN BY… -9.5%TOTAL EUROPE 238 243 279 325 300 334 320 273 252 278 149 DOWN BY… -8.1%Brazil 9 8 7 7 2 3 0 2 1 1 4 UP BY…. 585.7%USA 6 5 5 10 24 66 43 29 19 32 9 DOWN BY… -51.8%Others 6 12 13 12 10 8 10 8 3 6 5 UP BY…. 42.9%TOTAL OTHERS 21 25 25 29 36 77 53 39 23 39 18 DOWN BY… -20.9%GLOBAL TOTAL 648 714 851 946 1028 1143 1019 948 949 993 607 STEADY…. 4.8%*after a year indicates data are the latest year to date figures.Clarkson Research StudiesPage 15Aug-03
Orderbookby Year ofDelivery:VLCC16%FPSO/FSO14%No. Cgt2003 4 188,0592004 6 151,1842005 9 207,0952006 2 46,197Total 21 592,534Offshore1%Shipyard Capacity (1)Aframax35%Shipyard Feature:Spotlight on Dalian New Yard, China.• China State Shipbuilding Company recentlyannounced plans to build a huge new $3bn shipyard inShanghai, but for the time being the Dalian New Yard isthe largest facility in China. It also has the third largestorderbook in China after Hudong Shipyard and JiangnanShipyard.• The current mix of vessel types on order extendsfrom five Panamax tankers through to nine Aframaxes andonward to a pair of VLCCs. The emphasis on servicing theoil business includes downstream to Offshore andFPSO/FSO units. Dalian New Yard has also won acontract to build a pair of Post-Panamax containerships forChina <strong>Shipping</strong>. The reported price is $56m. each vessel.20-60Kcu.m. LPG3%Panamax19%• Most of the owners are domestic, although APMoller is behind the coated Aframax tankers, four ofwhich were ordered at $35-37m. Associated companyTorm also has a pair on order for delivery in 2006. Thereported price is $38.5m each.Shipbuilder….. Capacity* Output in Orderbook forShipyard…. Dock Berth Lgth gt cgt 2002 JulyNumber m. (,000) (,000) No. dwt cgt No. dwt cgtHyundai H.I. Ulsan South Korea 9 - 640 186 2,417 49 5,609 1,956 175 19,235 6,494 1Samsung S.B. Koje South Korea 3 - 640 170 1,363 35 4,184 1,362 114 13,169 4,541 2Daewoo S.B. Okpo South Korea 2 - 530 235 1,513 36 5,086 1,276 87 9,439 3,757 3Hyundai Samho Samho South Korea 2 - 512 166 650 22 3,275 650 62 7,556 2,054 4Hyundai Mipo Ulsan South Korea 4 4 380 40 711 24 790 479 97 3,978 1,871 5Tsuneishi Zosen Numakuma Japan 1 2 266 88 450 18 1,328 367 68 5,370 1,305 6Mitsubishi H.I. Nagasaki Japan 2 2 375 199 612 5 328 398 19 1,622 1,290 7Hanjin H.I. Busan South Korea 4 4 302 94 473 11 588 276 31 2,190 1,267 8STX Shipbuild. Chinhae South Korea 1 3 320 41 352 18 756 338 60 3,122 1,210 9Stocznia Gdynia Gdynia Poland 2 - 380 92 318 11 322 257 27 1,064 990 10Kawasaki H.I. Sakaide Japan 2 - 450 203 440 5 428 181 16 1,448 938 11Hudong S/Yard Shanghai China P.R. - 10 280 67 361 6 399 109 38 2,622 933 12I.H.I. Kure Japan 3 7 488 234 358 8 1,371 358 19 3,339 907 13Universal S.B. Tsu Japan - - - 160 199 0 0 0 28 5,194 907 14Oshima S.B. Co. Oshima Japan 2 - 535 73 404 25 1,382 401 52 2,878 872 15Kanasashi K.K. Toyohashi Japan 1 - 275 60 258 9 482 170 15 302 848 16Universal S.B. Ariake Japan - - - 160 285 1 298 48 20 5,066 817 17CSBC Kaohsiung Taiwan 2 - 950 232 326 11 936 276 27 1,965 800 18Mitsubishi H.I. Kobe Japan - 3 292 80 225 4 300 203 17 1,006 800 19Imabari S.B. Marugame Japan 2 - 290 73 419 18 1,232 419 29 1,664 791 20Shin Kurushima Onishi Japan 2 - 276 75 336 11 366 276 33 1,208 634 21Shina S.B. Chungmu South Korea - 3 165 34 182 7 200 106 30 1,222 624 22Jiangnan S/Yard Shanghai China P.R. 3 2 232 41 219 7 388 127 30 1,761 613 23Mitsui S.B. Chiba Japan 3 6 419 189 384 8 1,234 269 11 1,745 597 24Dalian New Yard Dalian China P.R. 1 2 365 161 395 4 421 85 21 2,432 590 25Fincantieri Monfalcone Italy 1 - 350 131 274 2 15 274 4 34 570 26Szczecin. Nowa Szczecin Poland - - - 35 201 5 103 91 22 814 490 27Nantong S.B. Nantong China P.R. - - 360 160 140 5 514 140 21 1,501 481 28De l'Atlantique St. Nazaire France 1 - 900 261 458 3 20 293 5 140 460 29Mitsui S.B. Tamano Japan 2 5 386 72 161 7 380 106 27 1,631 456 30Waigaoqiao S/Y Shanghai China P.R. - - - 0 89 0 0 0 17 2,676 451 31Imabari S.B. Saijo Japan 2 - 420 160 152 5 835 152 13 2,009 443 32Brod. Uljanik Pula Croatia - 2 225 139 149 5 132 127 19 616 431 33Koyo Dock K.K. Mihara Japan 1 5 378 86 364 6 425 270 12 859 429 34Namura Zosensho Imari Japan 1 - 450 114 259 12 896 239 16 2,184 402 35New Century S/Y Jingjiang China P.R. - - - 31 157 8 335 114 22 1,275 395 36Odense Lindo Lindo Denmark 3 - 415 167 271 5 482 271 8 676 389 37* Capacity output is defined as (1) the largest vessel built at the yard in gross tons (2) the maximum annual output for each yard in CGT since 1991. All DWT, GT and CGTfigures in this table are in ,000's. Ranking of shipyards in the table are based on the current orderbook measured in CGT.Clarkson Research StudiesPage 16Aug-03
Shipyard Capacity (2)Shipbuilder….. Capacity* Output in Orderbook forShipyard…. Dock Berth Lgth gt cgt 2002 JulyNumber m. (,000) (,000) No. dwt cgt No. dwt cgt RankDalian Shipyard Dalian China P.R. 2 3 230 72 224 7 262 143 20 840 388 38Guangzhou Shpyd Guangzhou China P.R. 3 3 200 29 248 4 129 71 20 736 373 39Sanoyas Mizushima Japan 1 - 675 75 174 9 592 173 18 1,428 360 40Shanghai Shpyd. Shanghai China P.R. - 2 228 30 164 5 217 77 18 728 358 41Sasebo H.I. Sasebo Japan 5 - 370 154 244 5 640 131 15 1,429 323 42Onomichi Dockyd Onomichi Japan - 1 260 58 169 9 499 169 17 943 319 43Fincantieri Marghera Italy 1 2 340 85 210 1 7 105 3 22 315 44Meyer Werft Papenburg Germany 1 - 370 91 256 3 20 256 4 21 311 45Sumitomo H.I. Oppama Japan 1 - 560 261 282 5 440 157 14 1,227 297 46I.H.I. Yokohama Japan - - - 117 138 2 14 73 14 890 276 47Kvaerner Masa Turku Finland 2 - 365 137 257 1 10 172 2 15 265 48Jiangdu S/yard Yangzhou China P.R. - - - 25 120 2 64 29 15 625 262 49Tsuneishi Cebu Cebu Philippines - - - 30 106 5 256 79 17 889 259 50Sestri-Cantiere Genoa Italy 2 - 285 101 139 1 7 61 2 22 253 51Brod. Split Split Croatia - 4 269 82 122 6 282 122 11 993 253 52Iwagi Zosen Iwagi Japan - 1 136 32 106 4 143 54 13 616 244 53Bohai Shipyard Hu Lu Dao China P.R. - - 195 29 115 1 46 21 10 1,104 241 54Izar P. Real Puerto Real Spain - - - 93 95 0 0 0 3 233 238 55Minami Nippon Usuki Japan - 1 178 57 176 6 260 104 5 121 229 56Guang. Wenchong Huangpu China P.R. 3 1 300 18 82 4 88 55 17 421 227 57Fincantieri CastellammareItaly - 2 240 59 103 2 30 97 4 38 211 58Eisa Shipyard Rio De JaneiroBrazil - 2 280 38 69 0 0 0 13 526 208 59J. J. Sietas Hamburg Germany 2 2 150 18 128 13 165 124 20 252 197 60Aker MTW Werft Wismar Germany 1 - 340 67 170 5 140 135 10 340 195 61Jinling Shipyd. Nanjing China P.R. - - - 27 71 4 70 67 13 340 190 62Lloyd Werft Bremerhaven Germany 3 - 335 78 98 0 0 0 2 12 180 63Volkswerft Stralsund Germany 2 - 300 34 103 5 168 96 9 240 176 64National Steel San Diego United States 1 10 305 111 112 1 34 41 5 770 173 65Flensburger S.B Flensburg Germany - 1 270 31 86 4 57 85 7 73 171 66Brod. 3 Maj Rijeka Croatia - 2 260 58 76 3 96 56 9 330 171 67Mitsubishi H.I. Shimonoseki Japan - 2 180 30 162 4 25 82 8 102 166 68ISOICO Bandar Abbas Iran - - - 23 143 0 0 0 9 372 160 69Izar Sestao Bilbao/Sestao Spain - - - 93 79 0 0 0 4 199 159 70Kanda Zosensho Kawajiri Japan 3 2 181 20 107 9 250 107 14 426 157 71Saiki Hvy. Ind. Saiki Japan - 2 155 24 78 6 164 72 9 338 147 72Admiralty S.Y. St. Petersburg Russia 2 2 240 33 45 2 40 20 8 324 146 73Xiamen Shipyard Xiamen China P.R. - - - 23 52 3 104 52 7 287 142 74Qingshan S.Y. Wuhan China P.R. - - - 12 55 2 24 18 18 184 139 75Shikoku Dock. Takamatsu Japan - 1 160 21 63 4 106 46 11 324 137 76Xingang S.Y. Tianjin China P.R. 2 1 212 22 70 3 73 31 10 359 129 77Kouan S.B. Taizhou China P.R. - - - 20 37 3 55 37 9 355 127 78Zhou Shan S/Y Zhoushan China P.R. - - - 17 40 3 13 13 15 173 125 79Naikai S.B. Setoda Japan 3 7 230 34 126 4 128 72 8 223 123 80Aker Finnyards Rauma Finland 1 - 250 50 130 4 12 130 2 32 123 81Jiangsu S/Yard Yangzijiang China P.R. - - - 18 71 6 90 54 10 174 112 82Hakodate Dock Hakodate Japan 2 1 184 128 65 5 193 65 10 320 110 83Barreras S.A. Vigo Spain - 6 180 28 87 3 19 69 7 21 110 84Zhejiang S/Yard Ningbo China P.R. - - - 20 43 2 31 23 11 273 109 85Stocznia Gdansk Gdansk Poland - 6 280 33 115 5 160 95 7 226 109 86Chengxi Shipyd. Jiangyin China P.R. - - - 7 16 1 8 10 7 343 108 87Imabari S.B. Imabari Japan - 1 247 53 133 5 125 55 9 239 108 88Kvaerner Masa Helsinki Finland 1 - 280 86 215 2 16 215 1 7 108 89Peene Werft Wolgast Germany 1 - 165 14 52 4 71 51 8 147 104 90Lindenau Kiel Germany 2 1 185 23 35 2 67 35 6 198 103 91Bender S.B. Mobile United States 3 9 251 9 31 3 9 22 14 59 103 92Watanabe Zosen Hakata Japan 1 2 160 30 48 3 26 28 9 162 101 93Chernomorskiy Nikolayev Ukraine - 2 289 32 50 1 45 25 4 182 100 94Weihai S/yard Weihai China P.R. - - - 13 25 0 0 0 11 148 100 95Volharding Eemshaven Netherlands - - - 8 40 6 45 40 11 118 97 96Varna Shipyard Varna Bulgaria 2 - 237 57 75 0 0 0 8 184 95 97Damen Okean Nikolayev Ukraine - - - 10 58 0 0 0 14 113 93 98Kv. Warnowwerft Warnemunde Germany 1 - 320 67 137 4 135 77 5 169 91 99Kawasaki H.I. Kobe Japan - 4 289 88 85 3 151 42 6 306 89 100NG Avondale New Orleans United States - - - 85 79 2 176 79 3 425 88 101Celiktekne Tuzla Turkey - - - 11 23 3 23 21 10 115 86 102* Capacity output is defined as (1) the largest vessel built at the yard in gross tons (2) the maximum annual output for each yard in CGT since 1991. All DWT, GT and CGTfigures in this table are in ,000's. Ranking of shipyards in the table are based on the current orderbook measured in CGT.Clarkson Research StudiesPage 17Aug-03
Shipyard Capacity (3)Shipbuilder….. Capacity* Output in Orderbook forShipyard…. Dock Berth Lgth gt cgt 2002 JulyNumber m. (,000) (,000) No. dwt cgt No. dwt cgt RankBrod. Trogir Trogir Croatia 1 2 200 28 63 2 57 30 4 190 85 103Universal S.B. Maizuru Japan - - - 39 60 1 70 22 4 285 84 104Shin Kurushima Akitsu Japan - 2 131 17 110 5 98 61 9 134 84 105Jurong S/Yard Tanjong Kling Singapore 1 4 330 52 57 4 59 52 4 125 82 106Usuki Zosensho Usuki Japan 3 - 180 19 67 5 66 50 7 126 82 107Fincantieri Palermo Italy 6 - 286 59 82 0 0 0 2 50 82 108Damen Galati Galatz Romania - - - 24 47 3 67 38 12 105 82 109Wuhu Shipyard Wuhu China P.R. - - 120 19 58 2 54 26 10 101 81 110Jiangzhou S/Y Jiangxi China P.R. - - - 9 33 2 16 15 11 101 79 111Schps. Bodewes Hoogezand Netherlands - - - 5 33 3 22 20 15 80 78 112Jiangdong S/Y Wuhu China P.R. - - - 10 34 2 18 13 9 114 74 113Vulcano S.A. Vigo Spain - 2 158 14 57 1 17 12 5 92 73 114Hellenic S/Yard Skaramanga Greece - - - 21 72 0 0 0 2 4 72 115Peters Schpsw. Kampen Netherlands - 4 110 3 32 3 14 14 16 63 72 116Soc. Esercizio Viareggio Italy - 5 180 21 60 0 0 0 6 93 72 117Jingjiang Sumec Jingjiang China P.R. - - - 7 20 1 6 5 10 89 70 118Shin Kurushima Hashihama Japan - 1 268 75 51 4 32 32 8 70 69 119Shanghai Edward Shanghai China P.R. - - 170 12 35 3 44 31 7 100 69 120Kitanihon Zosen Hachinohe Japan 2 - 140 19 74 3 54 43 5 121 67 121Vianayard Viana Castelo Portugal - 2 203 18 89 2 23 20 4 61 65 122Kvaerner Phil. Philadelphia United States - - - 29 22 0 0 0 3 90 65 123Fukuoka S.B. Fukuoka Japan - 1 110 12 48 5 65 42 6 95 65 124Izar Sevilla Seville Spain - - - 24 25 1 6 25 2 6 65 125Volharding Harlingen Netherlands - - - 12 38 0 0 0 8 82 63 126Shin Kochi H.I. Kochi City Japan - 2 168 19 100 7 73 49 6 140 62 127Itajai Shipyard Itajai Brazil - - 120 6 31 0 0 0 5 65 56 128Sasaki Zosen Kinoe Japan - 1 135 8 32 4 25 32 7 61 56 129Severnaya S.B. St. Petersburg Russia - 4 170 16 33 1 5 7 8 40 54 130Cant. Orlando Leghorn Italy - 2 140 24 76 0 0 0 2 27 53 131Rodriquez Pietro Ligure Italy - - - 6 18 0 0 0 5 0 53 132Rolandwerft Bremen Germany - - 115 10 54 2 17 15 5 31 53 133Visentini Donada Italy 1 3 190 40 110 2 15 52 2 14 53 134Dae Sun S.B. Pusan South Korea - 3 173 13 36 4 37 36 5 54 47 135Kyokuyo S/yard Shimonoseki Japan 1 - 134 22 48 4 34 38 6 74 47 136Braila Shipyard Braila Romania - 2 135 8 46 0 0 0 7 39 46 137Samho Tongyoung Tongyoung South Korea - - - 8 17 1 3 6 6 67 46 138Avondale Ind. New Orleans United States 2 3 900 85 124 0 0 0 1 34 45 13961 Kommunar Nikolayev Ukraine 1 3 134 14 32 0 0 0 4 38 45 140Dong Feng S/Y Hangzhou China P.R. - - - 0 38 0 0 0 8 101 44 141Jiangyang S.Y. Yangzhou China P.R. - - - 41 55 0 0 0 3 139 44 142Krasnoy Sormovo Gorkiy Russia - - - 6 26 1 5 5 6 56 44 143Shanhaiguan S/Y Shanhaiguan China P.R. - - - 14 0 0 0 0 5 120 43 144INP Heavy Ind. Ulsan South Korea - - - 13 45 6 66 45 6 39 43 145Volgograd S.Y. Volgograd Russia - - 129 5 16 3 20 16 7 47 43 146Higaki Zosen Imabari Japan - 3 110 9 83 8 63 59 7 62 43 147Atsalakis S/Y Perama Greece - - - 7 42 0 0 0 2 3 42 148FELS-Setal Angra Dos Rei Brazil - - - 4 9 0 0 0 5 17 42 149Kraljevica Kraljevica Croatia - 3 125 8 9 0 0 0 5 37 42 150Rousse Shipyard Rousse Bulgaria - 12 138 4 33 2 9 8 10 45 40 151Kleven Floroe Floroe Norway - - - 33 58 2 80 42 2 80 40 152Okean Shipyard Nikolayev Ukraine 1 - 225 63 47 0 0 0 2 138 39 153Naval Gijon Gijon Spain 1 - 165 24 26 1 35 19 2 70 39 154ABG Shipyard Surat India - - - 6 47 1 1 6 10 8 38 155Zaliv Shipyard Kerch Ukraine 1 - 354 89 21 2 12 11 4 38 37 156VT Halter Pascagoula United States - - - 37 37 0 0 0 1 13 37 157Daewoo-Mangalia Mangalia Romania - - - 16 15 0 0 0 4 38 37 158Zhonghua S/Yard Shanghai China P.R. - 2 107 22 79 3 31 41 3 34 37 159Jaya S.B. & Eng Singapore Singapore - - - 2 26 1 2 5 7 14 37 160Yantai Raffles Yantai China P.R. - - - 30 37 2 2 12 5 20 36 161P.T. PAL Indon. Surabaya Indonesia 7 - - 26 41 1 45 16 3 94 35 162Bohai Sembawang Tianjin China P.R. - - - 20 34 0 0 0 2 58 34 163Others 3,306 243 8,968 2,897 295 1,719 1,805TOTAL 29,594 993 49,589 20,869 2,587 144,906 58,827* Capacity output is defined as (1) the largest vessel built at the yard in gross tons (2) the maximum annual output for each yard in CGT since 1991. All DWT, GT and CGTfigures in this table are in ,000's. Ranking of shipyards in the table are based on the current orderbook measured in CGT.Clarkson Research StudiesPage 18Aug-03
2.001.751.501.251.000.750.500.250.00m. dwt19931994Trends of Losses at Sea19951996TankersGasCombos199719981999<strong>Vessel</strong>s Lost At Sea<strong>Bulk</strong>ersContainerOther20002001Source: Clarkson Research Studies20022003Summary• The 1982 built, 3,338 gt “OGAN” sank after takingon water during a fire in the engine room. The vessel sankin the Aegean Sea, along with the cargo of iron it hadpicked up from the Ukraine. All 17 crew were rescued.• The 1987 built, 134,430 dwt “EASTERN HONOR”touched the bottom of Whangarei Harbour. The ship wasproceeding at 5.5 knots in swells of 1.5-2.0 metres whenthe incident occurred. None of the 131,292 tonnes of crudeoil was spilt, but the incident highlights the problemstankers have in reaching the terminals in the harbour.According to reports the pilot broke the rule on taking invessels when the swell is greater than 1.0 metre. This rulehas been amended to include that entry can only take placeduring daylight hours, when it is easier to judge the swells.• The 1979-built, 87,588 dwt tanker “TASMANSPIRIT” grounded in the Keamari Channel in KarachiPort. The vessel is still carrying 40,000 tonnes of lightcrude oil. As WSM went to press the ship had developedserious cracks and is danger of breaking up. The ship hasbeen cordoned with booms.<strong>Bulk</strong> <strong>Vessel</strong>Losses2000 2001 2002 Jul* 2000 2001 2002 Jul* 2000 2001 2002 Jul*VLCC > 200,000 0 1 0 0 0 24 0 0 0 122 0 0Suezmax 120-200,000 0 0 0 0 0 0 0 0 0 0 0 0Aframax 80-120,000 0 0 1 1 0 0 26 14 0 0 43 53Panamax 60-80,000 0 0 0 0 0 0 0 0 0 0 0 0Products 10-60,000 1 2 0 0 22 31 0 0 11 26 0 0Chemical 10-60,000 0 0 0 0 0 0 0 0 0 0 0 0Specialised 10-60,000 0 0 0 0 0 0 0 0 0 0 0 0Tankers > 10,000 1 3 1 1 22 28 26 14 11 148 43 53Tankers < 10,000 3 3 0 0 11 17 0 0 11 13 0 0Capesize > 80,000 2 2 0 0 21 16 0 0 137 161 0 0Panamax 60-80,000 2 1 2 1 20 17 19 8 79 35 69 39Handymax 40-60,000 1 1 1 0 17 24 18 0 32 31 25 0Handysize 10-40,000 9 2 0 1 20 17 0 21 138 39 0 7<strong>Bulk</strong>ers > 10,000 14 6 3 2 20 18 18 14 385 267 94 46Combos > 10,000 0 0 0 0 0 0 0 0 0 0 0 0Total <strong>Bulk</strong> <strong>Vessel</strong>s 18 12 4 3 18 20 20 14 407 427 137 98Special <strong>Vessel</strong>Losses2000 2001 2002 Jul* 2000 2001 2002 Jul* 2000 2001 2002 Jul*LNG Carriers 0 0 0 0 0 0 0 0 0 0 0 0LPG Carriers 0 0 0 0 0 0 0 0 0 0 0 0Reefers 3 5 0 0 14 25 0 0 12 24 0 0Containers > 3,000 teu 0 0 0 0 0 0 0 0 0 0 0 0Containers < 3,000 teu 0 0 1 0 0 0 6 0 0 0 6 0Other Dry > 5,000 dwt 9 5 9 5 19 17 20 24 77 52 160 86Offshore & Others 5 4 5 3 28 22 24 18 5 12 14 5Cruise <strong>Vessel</strong>s 0 0 0 0 0 0 0 0 0 0 0 0Ro-Ro Ferries 0 0 0 0 0 0 0 0 0 0 0 0Total Special <strong>Vessel</strong>s 17 14 15 8 21 21 21 22 94 88 180 91Total All LossesNo. of <strong>Vessel</strong>sNo. of <strong>Vessel</strong>sNo. of <strong>Vessel</strong>sAverage AgeAverage AgeAverage Age,000 GT,000 GT,000 GT2000 2001 2002 Jul* 2000 2001 2002 Jul* 2000 2001 2002 Jul*All <strong>Vessel</strong>s Types 35 26 19 11 20 21 20 20 501 516 317 189* denotes data for year to date.Clarkson Research StudiesPage 19Aug-03
12.010.08.06.04.02.00.04Q95Demolition Sales by <strong>Vessel</strong> TypeQuarterly Demolitions (DWT)Tankers <strong>Bulk</strong>ers GasContainer Other2Q964Q962Q974Q972Q984Q982Q994Q992Q004Q002Q014Q012Q024Q022Q03Source: Clarkson Research StudiesSummary• At the beginning of July demolition prices were stillfirm, and owners have been taking advantage of thedemand for scrap in China. Chinese breakers paidastounding levels for VLCC and ULCC tonnage - the tt"EATON" (357,100 dwt, built 1977 Sweden, 43,395 ldt)and the MT "DORSET (269,895 dwt, built 1975 Japan,40,000 ldt) both achieved a reported $244.50/ldt.Combined with the sale of a further VLCC on privateterms to Chinese breakers however the immediate hungerfrom the Chinese yards became satiated. Indian breakershad to push up prices to compete. For many in the marketthis level of pricing had not been seen for over a decadesince mid-1990.• By the end of the month prices had weakened,especially in India where the cash intermediaries weretaking a more considered approach.<strong>Bulk</strong> <strong>Vessel</strong>DemolitionNo. end Average Age m. DWT, end:2002 Jul* 2002 Jul* 1999 2000 2001 2002 Jul* 2003 2004VLCC > 200,000 33 24 26.0 26.0 9.9 7.1 8.6 10.9 7.6 8.5 6.7Suezmax 120-200,000 11 8 26.0 25.0 3.1 2.5 4.0 1.6 1.1 2.3 1.7Aframax 80-120,000 17 16 25.0 25.0 2.5 1.7 1.4 1.5 1.4 2.4 1.6Panamax 60-80,000 6 10 25.0 26.0 0.2 0.3 0.4 0.4 0.7 1.1 0.3Products 10-60,000 68 46 27.0 29.0 0.7 2.2 1.0 2.3 1.5 2.5 2.3Chemical 10-60,000 10 7 27.0 29.0 0.1 0.1 0.1 0.3 0.2 0.1 0.2Specialised 10-60,000 2 3 43.0 27.0 0.0 0.0 0.1 0.1 0.1 0.1 0.1Tankers > 10,000 147 114 26.0 27.0 16.5 13.9 15.5 17.0 12.6 17.0 12.9Tankers < 10,000 20 21 29.0 31.0 0.0 0.0 0.0 0.1 0.1 0.1 0.0Capesize > 80,000 10 3 26.0 26.0 3.0 1.0 1.6 1.3 0.3 0.5 0.6Panamax 60-80,000 22 2 24.0 26.0 1.5 0.2 2.1 1.4 0.1 0.8 0.9Handymax 40-60,000 10 4 25.0 26.0 1.6 0.8 0.7 0.5 0.2 0.3 0.9Handysize 10-40,000 92 45 26.0 26.0 3.0 2.3 3.4 2.4 1.3 2.2 3.5<strong>Bulk</strong>ers > 10,000 134 54 26.0 26.0 9.1 4.3 7.8 5.6 1.9 3.8 5.9Combos > 10,000 12 5 24.0 22.0 1.0 0.6 0.8 1.2 0.5 0.5 0.2Total <strong>Bulk</strong> <strong>Vessel</strong>s 313 194 26.0 27.0 26.5 18.8 24.3 24.0 15.2 21.4 19.0Special <strong>Vessel</strong>Demolition2002 Jul* 2002 Jul* 1999 2000 2001 2002 Jul* 2003 2004LNG Carriers 0 0 0.0 0.0 0.0 0.0 0.0 0.0 0.0 0.0 0.0LPG Carriers 23 14 29.0 28.0 0.1 0.1 0.0 0.5 0.3 0.3 0.3Reefers 14 16 26.0 30.0 0.4 0.2 0.1 0.1 0.1 0.2 0.2Containers > 3,000 teu 1 1 29.0 1.0 0.0 0.0 0.1 0.0 0.1 0.1 0.1Containers < 3,000 teu 49 20 25.0 27.0 0.9 0.2 0.5 1.1 0.4 0.7 0.8Other Dry > 5,000 dwt 118 62 25.0 25.0 2.1 2.4 2.5 2.0 1.0 2.3 2.4Offshore & Others 13 10 29.0 28.0 0.5 0.4 0.1 0.4 0.0 1.0 1.0Cruise <strong>Vessel</strong>s 2 0 47.0 0.0 0.0 0.0 0.0 0.0 0.0 0.0 0.0Ro-Ro Ferries 5 0 26.0 0.0 0.0 0.0 0.0 0.0 0.0 0.3 0.3Total Special <strong>Vessel</strong>s 225 123 26.0 26.0 4.0 3.3 3.4 4.1 1.9 4.9 5.1TotalDemolitionNo. end Average Age m. DWT, end:No. end Average Age m. DWT, end: Forecast Demolition2002 Jul* 2002 Jul* 1999 2000 2001 2002 Jul* 2003 2004All <strong>Vessel</strong>s Types 538 317 26.0 27.0 30.6 22.1 27.6 28.1 17.1 26.3 24.1*after a month indicates data are the latest year to date figures. Average age is based on number of ships.Forecast DemolitionForecast DemolitionClarkson Research Studies Page 20Aug-03
<strong>Bulk</strong> <strong>Vessel</strong>Demolition Sales by <strong>Vessel</strong> TypeDemolition 1995 1996 1997 1998 1999 2000 2001 2002 Jul* 2003 2004VLCC > 200,000 3.6 1.7 1.0 2.0 4.7 3.4 4.1 5.3 3.7 4.1 3.2Suezmax 120-200,000 0.6 0.5 0.1 0.7 1.6 1.3 2.0 0.8 0.6 1.2 0.9Aframax 80-120,000 0.3 0.3 0.4 0.1 1.3 0.9 0.8 0.8 0.8 1.3 0.9Panamax 60-80,000 0.1 0.0 0.0 0.1 0.1 0.1 0.2 0.2 0.3 0.6 0.2Products 10-60,000 0.7 0.3 0.2 0.2 0.4 1.3 0.6 1.3 0.9 1.4 1.3Chemical 10-60,000 0.0 0.1 0.0 0.0 0.1 0.1 0.0 0.2 0.1 0.1 0.1Specialised 10-60,000 0.0 0.0 0.0 0.0 0.0 0.0 0.0 0.0 0.0 0.1 0.1Tankers > 10,000 5.4 2.9 1.8 3.3 8.2 7.1 7.7 8.7 6.4 8.8 6.6Tankers < 10,000 0.0 0.0 0.0 0.0 0.0 0.0 0.0 0.1 0.1 0.1 0.0Capesize > 80,000 0.4 1.5 1.6 2.0 1.6 0.5 0.8 0.7 0.2 0.3 0.3Panamax 60-80,000 0.1 0.5 0.7 1.1 0.8 0.1 1.2 0.8 0.1 0.4 0.5Handymax 40-60,000 0.1 1.0 0.6 0.9 1.0 0.5 0.4 0.3 0.1 0.2 0.6Handysize 10-40,000 0.3 1.1 1.5 2.6 1.8 1.4 2.1 1.5 0.8 1.3 2.1<strong>Bulk</strong>ers > 10,000 0.9 4.0 4.4 6.7 5.2 2.5 4.5 3.3 1.1 2.2 3.5Combos > 10,000 0.9 1.2 0.4 1.0 0.5 0.4 0.5 0.7 0.3 0.3 0.1Total <strong>Bulk</strong> <strong>Vessel</strong>s 7.3 8.2 6.6 11.0 13.9 10.0 12.7 12.7 8.0 11.4 10.3Special <strong>Vessel</strong>Demolition 1995 1996 1997 1998 1999 2000 2001 2002 Jul* 2003 2004LNG Carriers 0.0 0.0 0.0 0.0 0.0 0.0 0.0 0.0 0.0 0.0 0.0LPG Carriers 0.0 0.0 0.1 0.0 0.1 0.1 0.0 0.4 0.3 0.3 0.3Reefers 0.2 0.2 0.1 0.2 0.4 0.2 0.1 0.1 0.1 0.2 0.2Containers > 3,000 teu 0.0 0.0 0.0 0.3 0.1 0.1 0.1 0.1 0.0 0.1 0.1Containers < 3,000 teu 0.2 0.4 0.4 1.3 0.8 0.2 0.5 1.1 0.4 0.7 0.8Other Dry > 5,000 dwt 0.5 1.2 1.7 1.6 1.5 1.9 1.9 1.6 0.8 1.8 1.9Offshore <strong>Vessel</strong>s 0.0 0.0 0.0 0.0 0.0 0.0 0.0 0.0 0.0 0.0 0.0Cruise <strong>Vessel</strong>s 0.0 0.0 0.1 0.0 0.0 0.0 0.0 0.0 0.0 0.0 0.0Ro-Ro Ferries 0.0 0.0 0.0 0.0 0.0 0.0 0.0 0.0 0.0 0.0 0.0Total Special <strong>Vessel</strong>s 0.9 1.8 2.4 3.4 2.9 2.4 2.7 3.2 1.6 3.1 3.3TotalForecast DemolitionForecast DemolitionForecast DemolitionMillion GTDemolition 1995 1996 1997 1998 1999 2000 2001 2002 Jul* 2003 2004All <strong>Vessel</strong>s Types 8.1 10.0 8.9 14.4 16.8 12.4 15.4 15.9 9.5 14.4 13.5* denotes data for year to date.Recent Ship Sales for DemolitionDate Type <strong>Vessel</strong> Name Flag Dwt Ldt Blt. Owner Breaker $/ldt $m.Jul-03 VLCC Founder M M.I. 273,861 38,664 1976 Barclay Shpg. Ltd. Bangladesh 240.00 9.28Jul-03 Aframax Sea Jewel BS. 92,033 12,177 1980 Tanker Pacific Mngt. IndiaJul-03 Aframax Legaspi GR. 90,333 15,211 1980 Tsakos Shpg. & Trad. India 240.00 3.65Jul-03 Panamax Sea I MA. 66,728 11,379 1978 Eastern Med. Mar. BangladeshJul-03 Panamax Opal Stone CS. 64,900 12,230 1978 Tomini Ship Mngmt India 248.00 3.03Jul-03 Handy Prod Santa Panagia MA. 57,694 12,769 1980 Roxana Navigation BangladeshJul-03 Handy Prod Corelli BS. 38,720 9,279 1975 GEMARFIN India 242.00 2.25Jul-03 Handy Prod Gebze TU. 38,987 8,157 1975 Dunya Denizcilik India 252.00 2.06Jul-03 Handy Prod Episkopi GR. 32,101 7,240 1976 Vardinoyannis Group PRC 236.00 1.71Jul-03 Handy Prod Lipetsk RS. 23,876 1978 Novorossiysk Shpg. IndiaJul-03 Handy Spec Zoe PA. 29,958 8,205 1975 Unknown Owner IndiaJul-03 Small/Spec Dania SV. 6,101 1973 Khor al Zubair Shpg. PakistanJul-03
Oil TankerFleetFleet ForecastsNumbers, end m. DWT, end Forecast1999 2000 2001 2002 Jul* 1999 2000 2001 2002 Jul* 2003 2004Orderbook (end period) 308 411 585 656 784 37.5 50.7 61.8 58.9 70.5New Orders 104 283 300 276 312 12.0 34.6 25.3 20.8 30.1Newbuildings Delivered 210 180 127 206 184 20.2 21.4 14.2 23.7 18.5 31.7 25.1Sold for Scrap 116 145 116 147 114 16.5 13.9 15.5 17.0 12.6 17.0 12.9Losses 1 1 3 1 1 0.0 0.0 0.3 0.1 0.1 0.1Miscellaneous Additions 2 1 4 4 0.2 0.1 0.3 0.4Miscellaneous Removals 2 8 3 8 2 0.2 0.2 0.1 1.0 0.1 0.1Total Tanker Fleet 3,410 3,437 3,430 3,473 3,536 289.0 296.4 292.0 296.1 301.3 310.0 322.2% change 2.7% 0.8% -0.2% 1.3% 1.8% 1.2% 2.6% -1.5% 1.4% 1.8% 4.7% 3.9%of which:VLCC >200,000 425 441 428 428 428 123.8 129.0 125.7 125.2 125.1 127.9 130.0% change -0.9% 3.8% -2.9% -0.7% 4.2% -2.5% -0.4% -0.1% 2.2% 1.6%Suezmax 120-200,000 287 291 275 286 291 41.3 42.1 40.1 42.0 43.0 44.3 45.9% change -2.7% 1.4% -5.5% 4.0% 1.7% -2.0% 2.1% -4.7% 4.8% 2.2% 5.4% 3.5%Aframax 80-120,000 549 553 552 569 593 52.3 52.9 53.0 55.1 57.9 60.1 63.5% change 3.8% 0.7% -0.2% 3.1% 4.2% 4.9% 1.0% 0.2% 4.0% 5.2% 9.0% 6%Panamax 60-80,000 207 219 216 219 223 13.8 14.6 14.4 14.6 14.9 15.3 17.7% change 3.0% 5.8% -1.4% 1.4% 1.8% 3.0% 6.0% -1.6% 1.5% 2.3% 4.9% 15.5%Handy 10-60,000 1,942 1,933 1,959 1,971 2,001 57.9 57.9 58.8 59.1 60.4 62.4 65.2% change 4.1% -0.5% 1.3% 0.6% 1.5% 4.3% 0.0% 1.6% 0.5% 2.1% 5.5% 4.5%<strong>Bulk</strong> CarrierFleetNumbers, end m. DWT, end Forecast1999 2000 2001 2002 Jul* 1999 2000 2001 2002 Jul* 2003 2004Orderbook (end period) 462 533 369 441 537 33.4 35.3 24.3 30.3 38.3New Orders 331 252 145 295 199 22.8 15.1 9.5 20.1 14.9Newbuildings Delivered 198 184 310 223 103 12.7 13.3 20.5 14.1 6.8 11.5 14.8Sold for Scrap 198 115 188 134 54 9.1 4.3 7.8 5.6 1.9 3.8 5.9Losses 6 14 6 3 2 0.2 0.7 0.5 0.2 0.1 0.1Miscellaneous Additions 3 0.3Miscellaneous Removals 5 12 4 9 5 0.2 0.3 0.1 0.3 0.1Total <strong>Bulk</strong> Carrier Fleet 5,337 5,379 5,490 5,567 5,609 267.3 275.1 287.1 295.1 299.8 302.7 311.5% change -0.2% 0.8% 2.1% 1.4% 0.8% 1.2% 2.9% 4.3% 2.8% 1.6% 2.6% 2.9%of which:Capesize >80,000 527 558 576 591 606 82.5 87.3 90.7 93.5 96.1 97.5 102.4% change -0.2% 5.9% 3.2% 2.6% 2.5% 1.5% 5.8% 3.9% 3.1% 2.8% 4.3% 5.1%Panamax 60-80,000 901 949 1,028 1,059 1,067 62.2 65.9 72.0 74.5 75.2 75.4 78.6% change 4.9% 5.3% 8.3% 3.0% 0.8% 5.5% 5.8% 9.3% 3.5% 0.8% 1.1% 4.3%Handy 40-60,000 993 1,013 1,098 1,173 1,210 45.2 46.1 50.4 54.2 56.2 57.5 60.0% change 0.5% 2.0% 8.4% 6.8% 3.2% 0.4% 2.0% 9.4% 7.6% 3.6% 6.1% 4.2%Handysize 10-40,000 2,916 2,859 2,788 2,744 2,726 77.4 75.9 74.0 72.9 72.4 72.3 70.4% change -1.9% -2.0% -2.5% -1.6% -0.7% -1.7% -1.9% -2.5% -1.5% -0.7% -0.9% -2.5%CombinedCarrier FleetNumbers, end m. DWT, end Forecast1999 2000 2001 2002 Jul* 1999 2000 2001 2002 Jul* 2003 2004Orderbook (end period) - - 2 2 1 - - 0.2 0.2 0.1New Orders - - 2 - - - - 0.2 - -Newbuildings Delivered 4 - - - 1 0.4 - - - 0.1 0.2 -Sold for Scrap 8 6 8 12 5 1.0 0.6 0.8 1.2 0.5 0.5 0.2Losses - - - - - - - - - - -Miscellaneous Additions - 1 - 1 - - 0.1 - 0.1 -Miscellaneous Removals - 1 - 3 - - 0.0 - 0.4 -Total Combined Fleet 147 141 133 120 116 14.8 14.2 13.4 12.0 11.6 11.8 11.6% change -3% -4% -6% -10% -3% -4% -4% -6% -10% -4% -2.1% -1.7%LNG CarrierFleetNumbers, end m. cbm., end Forecast1999 2000 2001 2002 Jul* 1999 2000 2001 2002 Jul* 2003 2004Orderbook (end period) 18 26 47 56 56 2.3 3.4 6.3 7.4 7.5New Orders 5 20 22 19 5 0.7 2.6 3.0 2.5 0.7Newbuildings Delivered 7 12 1 10 5 1.0 1.5 0.1 1.4 0.7 2.0 2.8Sold for Scrap - 1 - - - - 0.0 - - - - -Losses - - - - - - - - - - -Miscellaneous Additions - - - - - - - - - -Miscellaneous Removals - - - - - - - - - -Total LNG Fleet 117 128 129 139 144 12.7 14.2 14.3 15.7 16.4 17.8 20.6% change 9.4% 0.8% 7.8% 3.6% 12.0% 1.0% 9.6% 4.4% 13.0% 15.9%N.B. All dwt measurements/size categories are now in metric tonnes. * orders, deliveries, scrapping, losses etc. are for the year to end of month indicated.Clarkson Research StudiesPage 22Aug-03
LPG CarrierFleetFleet ForecastsNumbers, end m. cbm., end Forecast1999 2000 2001 2002 Jul* 1999 2000 2001 2002 Jul* 2003 2004Orderbook (end period) 41 45 51 41 39 1.1 1.3 1.5 1.5 1.4New Orders 14 34 36 14 14 0.2 0.8 0.9 0.4 0.5Newbuildings Delivered 30 30 30 24 16 0.4 0.6 0.7 0.5 0.6 1.1 0.4Sold for Scrap 9 10 7 23 14 0.1 0.1 0.1 0.7 0.4 0.3 0.4Losses 1 0.0Miscellaneous AdditionsMiscellaneous Removals 1 1 3 0.0 0.0 0.0Total LPG Fleet 944 963 986 983 985 12.9 13.5 14.1 13.9 14.1 14.7 14.7% change 2.1% 2.0% 2.4% -0.3% 0.2% 2.6% 4.0% 4.6% -1.6% 1.5% 5.9% 0.2%of which:> 60,000 cbm 93 98 105 103 105 7.2 7.6 8.1 8.0 8.2 8.7 8.8% change 3.3% 5.4% 7.1% -1.9% 1.9% 3.5% 5.5% 7.4% -1.5% 2.3% 8.0% 1.3%20-60,000 cbm 77 81 80 78 78 2.8 2.9 2.9 2.8 2.8 3.1 3.3% change -1.3% 5.2% -1.2% -2.5% -0.5% 2.0% -0.9% -3.9% 0.8% 11.8% 5.5%8-20,000 cbm 88 89 88 90 92 1.1 1.1 1.1 1.1 1.1 1.0 0.9% change 2.3% 1.1% -1.1% 2.3% 2.2% 2.4% 0.8% -0.8% -0.4% 1.1% -6.2% -12%< 8,000 cbm 686 695 713 712 710 1.9 1.9 2.0 2.0 2.0 1.9 1.7% change 2.2% 1.3% 2.6% -0.1% -0.3% 4.3% 2.8% 4.7% 0.8% -0.7% -6.8% -8.3%ContainershipFleetNumbers, end m. TEU, end Forecast1999 2000 2001 2002 Jul* 1999 2000 2001 2002 Jul* 2003 2004Orderbook (end period) 278 421 414 341 475 0.9 1.4 1.4 1.1 1.9New Orders 155 300 181 129 240 0.6 1.0 0.5 0.4 1.1Newbuildings Delivered 128 157 188 202 106 0.3 0.4 0.6 0.6 0.3 0.6 0.6Sold for Scrap 49 12 29 50 21 0.1 0.0 0.0 0.1 0.0 0.1 0.1Losses 3 1 0.0 0.0Miscellaneous AdditionsMiscellaneous Removals 1 3 2 2 0.0 0.0 0.0 0.0Total Containership Fleet 2,607 2,751 2,906 3,054 3,137 4.4 4.8 5.4 6.0 6.3 6.5 7.1% change 2.9% 5.5% 5.6% 5.1% 2.7% 4.9% 9.8% 12.1% 10.6% 5.2% 8.6% 8.7%of which:Post-P' max 4,000 &+ teu 104 138 201 246 271 0.6 0.8 1.1 1.4 1.6 1.6 1.9% change 15.6% 32.7% 45.7% 22.4% 10.2% 17.8% 35.2% 47.7% 24.1% 11.4% 17.0% 16.5%Panamax 3,000 &+ teu 342 365 382 425 447 1.3 1.4 1.4 1.6 1.7 1.8 2.0% change 2.4% 6.7% 4.7% 11.3% 5.2% 2.8% 7.8% 4.8% 12.6% 5.4% 9.1% 11.0%Handymax 2-2,999 teu 380 401 441 473 490 0.9 1.0 1.1 1.2 1.2 1.3 1.3% change 5.0% 5.5% 10.0% 7.3% 3.6% 4.8% 5.4% 10.1% 7.4% 3.8% 7.9% 4.3%Handy 1-1,999 teu 795 837 874 893 903 1.1 1.2 1.2 1.3 1.3 1.3 1.3% change 2.4% 5.3% 4.4% 2.2% 1.1% 2.9% 5.8% 4.4% 2.3% 1.1% 1.8% 1.0%Feeders < 1,000 teu 986 1,010 1,008 1,017 1,026 0.5 0.5 0.5 0.5 0.5 0.6 0.6% change 1.4% 2.4% -0.2% 0.9% 0.9% 2.0% 3.3% 0.3% 2.1% 1.6% 3.2% 2.9%ReeferFleetNumbers, end m. Cu.ft, end Forecast1999 2000 2001 2002 Jul* 1999 2000 2001 2002 Jul* 2003 2004Orderbook (end period) 20 12 8 8 7 9.3 5.2 3.9 3.1 2.9New Orders 4 4 - 2 - 1.2 1.5 0.4Newbuildings Delivered 22 12 4 2 1 10.0 5.6 1.3 1.3 0.2 2.3 0.7Sold for Scrap 54 17 14 14 16 17.4 6.6 4.5 4.9 4.8 15.4 18.4Losses 1 3 5 - - 0.0 0.6 1.1Miscellaneous Additions - 1 - - - 0.1Miscellaneous Removals - 4 6 3 - 0.2 1.7 0.8Total Reefer Fleet 1,356 1,341 1,320 1,305 1,290 363.9 361.4 355.5 351.0 346.5 337.9 320.2% change -1% -2% -1% -1% -1% -2% -1% -1% -3.7% -5.2%Other Dry*Fleet >5,000 dwtNumbers, end m. DWT, end Forecast1999 2000 2001 2002 Jul* 1999 2000 2001 2002 Jul* 2003 2004Orderbook (end period) 256 206 195 208 247 3.2 2.9 2.7 2.9 3.2New Orders 100 123 82 102 82 1.1 1.8 0.9 1.4 1.0Newbuildings Delivered 156 174 94 89 43 1.8 2.1 1.1 1.2 0.7 1.7 1.3Sold for Scrap 141 164 156 118 62 2.1 2.4 2.5 2.0 1.0 2.3 2.4Losses 11 9 5 9 5 0.1 0.1 0.1 0.1 0.0 0.0Miscellaneous Additions - - 5 1 - 0.2 0.1Miscellaneous Removals 6 8 9 23 41 0.1 0.1 0.2 0.3 0.4Total Other Dry Cargo Fleet 3,793 3,783 3,707 3,650 3,585 48.7 48.2 46.5 45.4 44.6 44.3 43.2% change -0.3% -2.0% -1.5% -1.8% -1.0% -3.4% -2.4% -1.8% -2.4% -2.5%* other dry fleet includes Multi-purpose, General Cargo Tramps and Liners and Ro-Ro vessels.Clarkson Research StudiesPage 23Aug-03
Shipbuilding FocusDragon’s Hunger Slays Demolition ForecastDemolition in the dry bulk sector isvirtually non-existent this year, a surprisingswitch around from last year.The answer lies in the freight rates.Average earnings for 1990/91 builtCapesize ships are knocking on thedoor of $30,000/day. If the benchmarkrates are this high, then demandis firm enough to support older vessels,and for owners profit marginswill be even higher as the older shipshave lower capital costs, or may havepaid down all the debt.China FactorOur Graph of the Week illustrates theconundrum. It is relatively simple to10.09.08.07.06.05.04.03.02.01.00.0Dry <strong>Bulk</strong> Carrier Demolitionm. dwt19992000Graph of the MonthAge related demolitionforecastCABIactual/freightrelated demolitionforecast200120022003forecast demolition on fleet age profiles,but a sudden change in the marketcan demolish the scrapping forecast.Based on age profile alone, 2003should be a strong year for scrapping.At the start of 2003, 30.2m dwt of thedry bulk carrier fleet was over the ageof 25, and so it was reasonable to expecta large proportion to feel the heatof the breaker’s torch.Hungry for OreBut that was before demand took off.The China factor is the main drivingforce behind the high freight rates.The growth in demand for raw materialswas unexpected and chaotic.Iron ore imports intoChina were 111.5mtonnes in 2002. We expect18001600imports to reach143.8m tonnes in 2003,an increase of nearly30%! There have been1400 reports of Capesizes12001000waiting to load in Braziland producers likeBHP have brought forwardcapacity expansions,800commitmentsthat cost billions.600400HavocCABI2004Source: <strong>Clarksons</strong> Research Studies2000These dramatic changesof fortune in the drybulk market play havocwith fleet growth forecasts.Using age as theprime indicator of potentialfor demolition, at the start of2000 there were 2.06m dwt of Capesizebetween 25-29 years old. It is notunreasonable to expect vessels of thisvintage to be candidates for demolitionduring the year, but 2000 was agood year for Capesize earnings. Theaverage earnings for 1990/91 vesselswere $20,000/day, so in fact 50% ofthe 25-29 years old survived. Butthose that had survived were the mostvulnerable to a downturn in the marketand 2001 saw average earningsfall to $12,500/day. Of those still inthe fleet and those old enough to jointhe age group, 70% were scrapped.Average earnings in 2002 fell to$11,400/day, so it was reasonable toassume a similar level of scrapping in2003.But where next?Then China happened, and 1990/91built Capesize average earnings havemore than doubled to $28,000/day.So far this year only two Capesizeshave been scrapped compared to theten in 2002. Therefore we have revisedour demolition forecasts to takeinto account the change in market.How long the situation will carry onis anyone’s guess. If China succumbsto pressure to alter the exchange rate,Chinese goods abroad will becomemore expensive, and imports of rawmaterials will fall. The fall in demandwill send the older ships onto thebreakers beaches. Whatever happens,expect a review of demolition forecastsin the New Year.World Shipyard Monitor, 20 August, 2003Editorial Board:Published by: Managing Director Martin StopfordClarkson Research Studies, Publisher Cliff TylerResearch & Publications Division, H. Clarkson & Co.Ltd. Research Services Stephen Gordon12, Camomile Street, Editor/Analyst Craig JallalLONDON EC3A 7BP, England Technician Kevin BottingProduction G. OcholaTelephone: (44) (020) 7283 8955 Newbuilding N. WoodFax: (44) (020) 7623 0539 Newbuilding Data P. EnglishTelex: 8812927 CLTNKA G Demolition A. FlynnDesignDavid WhickerE-mail: crs@clarksons.co.ukWeb site: http://www.clarksons.co.uk/researchWorld Shipyard Monitor is published 12 times a year. It monitors changes in thesupply of 16 different types of cargo ship. The centre sections contain listings ofthe orderbook by ship type and shipyard; the main pages contain “at a glance”tables, graphs and text analysing trends in the orderbook, ordering, deliveriesscrapping & losses, prices, shipbuilding market shares and capacity and fleetforecasts. It is available on subscription at a price of £450 a year plus postage.Whilst care has been taken in the production of this review, no liability can beaccepted for any loss incurred in any way whatsoever by any person who mayseek to rely on the information contained herein. The information in this reportmay not be reproduced without the written permission of Clarkson ResearchStudies.