Bulk Vessel - Clarksons Shipping Intelligence Network
Bulk Vessel - Clarksons Shipping Intelligence Network
Bulk Vessel - Clarksons Shipping Intelligence Network

Create successful ePaper yourself
Turn your PDF publications into a flip-book with our unique Google optimized e-Paper software.
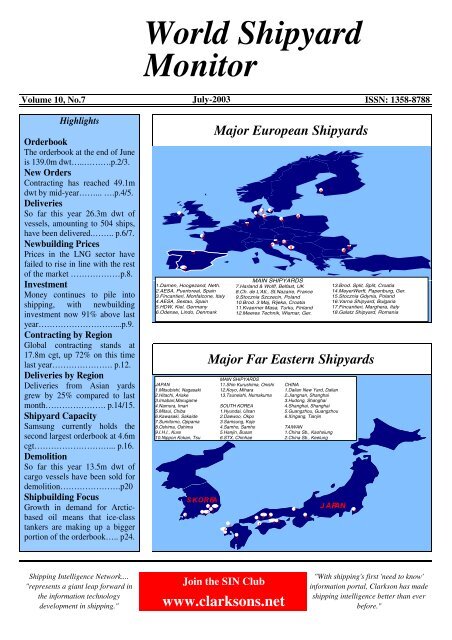
World ShipyardMonitorVolume 10, No.7 July-2003ISSN: 1358-8788HighlightsOrderbookThe orderbook at the end of Juneis 139.0m dwt…..……….p.2/3.New OrdersContracting has reached 49.1mdwt by mid-year……... ….p.4/5.DeliveriesSo far this year 26.3m dwt ofvessels, amounting to 504 ships,have been delivered.…….. p.6/7.Newbuilding PricesPrices in the LNG sector havefailed to rise in line with the restof the market ………………p.8.InvestmentMoney continues to pile intoshipping, with newbuildinginvestment now 91% above lastyear………………………....p.9.Contracting by RegionGlobal contracting stands at17.8m cgt, up 72% on this timelast year…………………. p.12.Deliveries by RegionDeliveries from Asian yardsgrew by 25% compared to lastmonth…………………. p.14/15.Shipyard CapacitySamsung currently holds thesecond largest orderbook at 4.6mcgt………………………... p.16.DemolitionSo far this year 13.5m dwt ofcargo vessels have been sold fordemolition………………….p20Shipbuilding FocusGrowth in demand for Arcticbasedoil means that ice-classtankers are making up a biggerportion of the orderbook….. p24.721.Damen, Hoogezand, Neth.2.AESA, Puertoreal, Spain3.Fincantieri, Monfalcone, Italy4.AESA, Sestao, Spain5.HDW, Kiel, Germany6.Odense, Lindo, Denmark4JAPAN1.Mitsubishi, Nagasaki2.Hitachi, Ariake3.Imabari,Marugame4.Namura, Imari5.Mitsui, Chiba6.Kawasaki, Sakaide7.Sumitomo, Oppama8.Oshima, Oshima9.I.H.I., Kure10.Nippon Kokan, Tsu48S.KOREAMajor European Shipyards146 15 1293 101713MAIN SHIPYARDS7.Harland & Wolff, Belfast, UK8.Ch. de L'Atl., St.Nazaire, France9.Stocznia Szczecin, Poland10.Brod. 3 Maj, Rijeka, Croatia11.Kvaerner Masa, Turku, Finland12.Meeres Technik, Wismar, Ger.1816Major Far Eastern Shipyards6153 2MAIN SHIPYARDS11.Shin Kurushima, Onishi12.Koyo, Mihara13.Tsuneishi, NumakumaSOUTH KOREA1.Hyundai, Ulsan2.Daewoo, Okpo3.Samsung, Koje4.Samho, Samho5.Hanjin, Busan6.STX, Chinhae48129 12 133 61715CHINA1.Dalian New Yard, Dalian2.Jiangnan, Shanghai3.Hudong, Shanghai4.Shanghai, Shanghai5.Guangzhou, Guangzhou6.Xingang, Tianjin101TAIWAN1.China Sb., Kaohsiung2.China Sb., Keelung13.Brod. Split, Split, Croatia14.MeyerWerft, Papenburg, Ger.15.Stocznia Gdynia, Poland16.Varna Shipyard, Bulgaria17.Fincantieri, Marghera, Italy18.Galatz Shipyard, RomaniaJAPAN5<strong>Shipping</strong> <strong>Intelligence</strong> <strong>Network</strong>...."represents a giant leap forward inthe information technologydevelopment in shipping."Join the SIN Clubwww.clarksons.net"With shipping's first 'need to know'information portal, Clarkson has madeshipping intelligence better than everbefore."
SpecialisedChemicalProductsPanamaxAframaxSuezmaxVLCCHandysizeHandymaxPanamaxCapesizeCombosFCC3KteuOrderbook As % Of Fleet (DWT)5.2%6.5%25.0%25.4%24.7%20.2%18.5%15.2%5.0%4.8%14.8%14.1%13.3%9.6%15.8%12.9%1.0%2.0%8.9%8.2%Orderbook by <strong>Vessel</strong> Type20.8%21.1%26.8%21.9%26.7%35.0%End Jun 03End 200237.3%44.8%0% 10% 20% 30% 40% 50%Source: Clarkson Research StudiesSummary• The orderbook at the end of June is 139.0m dwtfor all vessel types. This is a 3.1% increase on lastmonth, and a 19% increase on the orderbook since theend of 2002.• The Post-Panamax and Panamax containership(>3,000 teu) orderbook continues to grow, but the rate ofgrowth is slowing. In June the orderbook increased by3.2%, compared to nearly 5% in May. Even so, theorderbook in this sector is now 49% higher than the startof the year.• In the tanker sector the Panamax tanker orderbookhas grown by 21.5% since the start of the year, butordering slowed in June to give a month on monthgrowth of just over 3%.• The Capesize orderbook has grown to 15.1m dwt,a growth of 25% since the end of 2002.<strong>Bulk</strong> <strong>Vessel</strong>OrderbookNo. endm.CGT, end:Orderbook, Delivery in:2002 Jun* 2002 Jun* 1999 2000 2001 2002 Jun* 2003 2004 2005+VLCC > 200,000 62 76 3.0 3.6 22.4 27.2 26.2 19.0 23.2 5.8 9.1 8.2Suezmax 120-200,000 54 67 1.7 2.1 5.5 9.3 9.9 8.5 10.5 3.1 3.3 4.1Aframax 80-120,000 130 133 3.1 3.1 3.4 7.0 13.0 14.0 14.4 4.1 4.9 5.4Panamax 60-80,000 71 94 1.5 2.0 1.4 0.8 2.5 5.1 6.8 1.0 2.8 3.0Products 10-60,000 210 259 4.0 4.9 2.4 4.1 7.5 8.8 10.9 2.3 4.2 4.4Chemical 10-60,000 124 125 1.9 1.9 2.0 2.1 2.6 3.3 3.3 1.2 1.2 1.0Specialised 10-60,000 5 4 0.1 0.1 0.3 0.3 0.2 0.2 0.2 0.1 0.1 0.0Tankers > 10,000 656 758 15.3 17.8 37.5 50.7 61.8 58.9 69.3 17.6 25.5 26.2Tankers < 10,000 115 114 0.7 0.7 0.3 0.3 0.5 0.7 0.7 0.3 0.3 0.1Capesize > 80,000 72 102 1.9 2.5 12.2 10.5 8.8 12.0 15.1 2.4 5.8 7.0Panamax 60-80,000 95 133 1.9 2.6 12.5 12.1 5.8 7.2 10.0 1.0 4.7 4.4Handymax 40-60,000 149 159 2.4 2.6 6.4 9.6 7.0 7.6 8.3 1.8 3.5 3.0Handysize 10-40,000 126 127 1.4 1.4 2.4 3.0 2.7 3.5 3.6 1.0 1.8 0.9<strong>Bulk</strong>ers > 10,000 442 521 7.5 9.1 33.4 35.3 24.3 30.3 37.0 6.1 15.7 15.2Combos > 10,000 2 1 0.1 0.0 0.0 0.0 0.2 0.2 0.1 0.1 0.0 0.0Total <strong>Bulk</strong> <strong>Vessel</strong>s 1215 1394 23.6 27.6 71.2 86.3 86.8 90.2 107.1 24.2 41.5 41.5Special <strong>Vessel</strong>OrderbookOrderbook, Delivery in:2002 Jun* 2002 Jun* 1999 2000 2001 2002 Jun* 2003 2004 2005+LNG Carriers 56 55 4.6 4.5 1.3 1.9 3.4 4.0 3.9 0.8 1.5 1.6LPG Carriers 41 42 0.8 0.8 0.9 0.9 1.1 1.1 1.1 0.5 0.3 0.4Reefers 8 8 0.1 0.1 0.2 0.1 0.1 0.1 0.1 0.1 0.0 0.0Containers > 3,000 teu 164 231 6.5 9.6 8.7 13.5 12.7 10.7 15.9 2.6 6.3 7.1Containers < 3,000 teu 176 196 2.4 2.7 3.1 5.1 4.7 3.6 4.0 1.4 1.7 1.0Other Dry > 5,000 dwt 208 249 4.1 5.1 3.2 2.9 2.7 2.9 3.2 1.2 1.3 0.8Offshore & Other 265 247 2.1 1.8 1.7 1.6 2.5 3.3 3.3 1.5 1.3 0.0Cruise <strong>Vessel</strong>s 30 25 3.0 2.8 0.3 0.3 0.3 0.2 0.2 0.1 0.1 0.0Ro-Ro Ferries 50 49 1.3 1.3 0.2 0.3 0.2 0.2 0.2 0.1 0.1 0.0Total Special <strong>Vessel</strong>s 998 1,102 24.9 28.8 19.7 26.6 27.7 26.1 31.9 8.1 12.5 10.8TotalOrderbookNo. endm.CGT, end:Orderbook, Delivery in:2002 Jun* 2002 Jun* 1999 2000 2001 2002 Jun* 2003 2004 2005+All <strong>Vessel</strong>s Types 2,213 2,496 48.5 56.3 90.9 112.9 114.5 116.3 139.0 32.3 54.0 52.7Clarkson Research Studies Page 2m. DWT, end:m. DWT, end:No. end m.CGT, end: m. DWT, end:N.B. Details of special cargo ships orderbook, in terms of special units of measurement e.g. cbm, teu, ,000 cuft. etc. may be found in the blue centre pages. - denotes figureunavailable.Jul-03
Orderbook by <strong>Vessel</strong> TypeQuarterly Forward Orderbook by Shiptype (m. dwt)16.00m. dwt14.0012.0010.008.006.004.002.000.00TankersCombosContainer<strong>Bulk</strong>ersGas1-20033-20035-20037-20039-200311-20031-20043-20045-20047-20049-200411-20041-20053-20055-2005Source: Clarkson Research Studies7-20059-200511-20051-20063-20065-20067-2006<strong>Bulk</strong> <strong>Vessel</strong>OrderbookOrderbook, Delivery in:1995 1996 1997 1998 1999 2000 2001 2002 Jun* 2003 2004 2005+VLCC > 200,000 4.0 4.1 10.2 12.6 12 14.2 13.7 9.9 12.0 3.0 4.7 4.2Suezmax 120-200,000 1.6 2.3 3.8 3.6 2.9 4.9 5.2 4.4 5.5 1.6 1.7 2.1Aframax 80-120,000 1.6 2.6 4.4 4.2 1.9 3.9 7.1 7.6 7.8 2.2 2.7 2.9Panamax 60-80,000 0.1 0.0 0.4 1.0 0.8 0.5 1.4 2.8 3.7 0.6 1.5 1.7Products 10-60,000 1.7 1.7 2.3 1.9 1.5 2.6 4.7 5.5 6.8 1.4 2.6 2.7Chemical 10-60,000 1.1 1.4 1.8 1.6 1.3 1.3 1.7 2.0 2.1 0.7 0.7 0.6Specialised 10-60,000 0.2 0.1 0.1 0.2 0.2 0.2 0.1 0.1 0.1 0.1 0.1 0.0Tankers > 10,000 10.2 12.3 23.2 25.0 20.4 27.6 33.9 32.5 38.0 9.6 14.0 14.3Tankers < 10,000 0.2 0.3 0.4 0.3 0.2 0.2 0.3 0.5 0.4 0.2 0.2 0.1Capesize > 80,000 7.2 4.8 4.2 5.0 6.3 5.4 4.5 6.1 7.7 1.2 2.9 3.6Panamax 60-80,000 4.1 4.7 4.4 4.1 6.6 6.5 3.1 3.8 5.3 0.5 2.5 2.3Handymax 40-60,000 4.6 4.4 3.5 2.0 3.7 5.7 4.2 4.5 4.9 1.1 2.1 1.7Handysize 10-40,000 2.6 2.5 2.1 1.5 1.5 1.9 1.7 2.2 2.2 0.6 1.1 0.5<strong>Bulk</strong>ers > 10,000 18.5 16.3 14.3 12.6 18.1 19.5 13.5 16.6 20.1 3.5 8.5 8.1Combos > 10,000 0.4 0.3 0.3 0.3 0.0 0.0 0.1 0.1 0.1 0.1 0.0 0.0Total <strong>Bulk</strong> <strong>Vessel</strong>s 29.3 29.2 38.1 38.3 38.8 47.3 47.8 49.6 58.6 13.4 22.7 22.5Special <strong>Vessel</strong>OrderbookMillion GTOrderbook, Delivery in:1996 1996 1997 1998 1999 2000 2001 2002 Jun* 2003 2004 2005+LNG Carriers 1.9 1.8 2.3 2.0 1.8 2.5 4.5 5.4 5.3 1.1 2.0 2.2LPG Carriers 0.6 0.4 0.6 0.9 0.7 0.8 1.0 0.9 0.9 0.4 0.2 0.3Reefers 0.2 0.3 0.5 0.4 0.2 0.1 0.1 0.1 0.1 0.1 0.0 0.0Containers > 3,000 teu 6.5 6.4 4.2 4.4 8.0 12.2 11.5 9.9 14.6 2.4 5.8 6.5Containers < 3,000 teu 4.3 5.5 4.2 2.6 2.5 4.0 3.7 2.9 3.2 1.1 1.3 0.8Other Dry > 5,000 dwt 2.6 3.9 5.8 6.0 4.8 4.2 3.7 4.3 5.3 1.6 1.9 1.7Offshore & Others 0.5 0.8 1.2 1.8 1.3 1.3 1.8 2.3 2.3 1.2 0.3 0.0Cruise <strong>Vessel</strong>s 1.6 1.7 1.8 2.4 3.3 4.0 3.4 2.4 2.2 0.9 1.0 0.4Ro-Ro Ferries 0.6 0.6 0.5 0.6 1.3 1.5 0.9 0.7 0.7 0.2 0.4 0.1Total Special <strong>Vessel</strong>s 18.9 21.4 21.1 21.1 23.8 30.6 30.7 29.0 34.7 8.9 13.0 12.0TotalOrderbookMillion GTMillion GTOrderbook, Delivery in:1995 1996 1997 1998 1999 2000 2001 2002 Jun* 2003 2004 2005+All <strong>Vessel</strong>s Types 48.3 50.6 59.2 59.4 62.6 77.8 78.5 78.6 93.3 22.2 36.3 34.8N.B. Details of special cargo ships orderbook, in terms of special units of measurement e.g. cbm, teu, ,000 cuft. etc. may be found in the blue centre pages. - denotes figureunavailable.Clarkson Research Studies Page 3Jul-03
3.53.02.52.01.51.00.50.0m. cgtQuarterly Contracting by m. cgtTankers <strong>Bulk</strong>ers Gas Container Other4Q952Q964Q962Q974Q972Q984Q982Q994Q992Q004Q002Q014Q012Q024Q022Q03Source: Clarkson Research StudiesNew Orders by <strong>Vessel</strong> TypeSummary• New orders for all cargo vessels slowed down alittle on last month. Total orders at the end of April 2003reached 31.8m dwt, which is up 86% on last year’s rate ofcontracting.• The decline in VLCC rates following the end of thewar in Iraq did not dampen investor enthusiasm for thetanker sector. VLCC orders placed to the end of April2003 are now over 250% ahead of last year.• Contracting in the Suezmax sector has beenrelatively even heavier, reaching 3.3m dwt by the end ofApril 2003, over 300% higher than last year and higherthan full year levels of contracting in 2001 and 2002.• The orderbook for large containerships continuesgrow at an astonishing rate. Contracting here too isrunning at over 300% more than last year, with orders of5.4m dwt placed by the end of April 2003. Recent ordersinclude Hapag-Lloyd’s three 8,000teu Post-Panamaxcontainer-ships from Hyundai HI at a price of $75m each,for delivery in 2005-2006.<strong>Bulk</strong> <strong>Vessel</strong>Contracting2002 Jun* 2002 Jun* 1999 2000 2001 2002 Jun* This Year v. LastVLCC > 200,000 17 33 0.8 1.5 7.6 17.0 6.8 5.2 10.1 UP BY…. 291%Suezmax 120-200,000 15 24 0.5 0.8 1.1 7.2 3.1 2.3 3.8 UP BY…. 225%Aframax 80-120,000 44 41 1.0 1.0 1.0 5.8 7.5 4.8 4.4 UP BY…. 82%Panamax 60-80,000 45 35 1.0 0.8 0.3 0.5 2.0 3.3 2.5 UP BY…. 53%Products 10-60,000 82 91 1.5 1.7 1.2 2.9 4.7 3.5 3.9 UP BY…. 123%Chemical 10-60,000 70 33 0.9 0.5 0.7 1.2 1.2 1.6 0.8 UP BY…. 7%Specialised 10-60,000 3 0 0.1 0.0 0.2 0.1 0.0 0.1 0.0 DOWN BY….. -100%Tankers > 10,000 276 257 5.9 6.2 12.0 34.7 25.2 20.8 25.5 UP BY…. 145%Tankers < 10,000 80 37 0.5 0.2 0.2 0.2 0.4 0.5 0.2 DOWN BY….. -15%Capesize > 80,000 43 43 1.1 0.9 6.7 4.4 3.8 7.3 5.3 UP BY…. 46%Panamax 60-80,000 73 49 1.4 1.0 9.5 3.7 2.0 5.5 3.7 UP BY…. 34%Handymax 40-60,000 95 47 1.5 0.7 4.7 5.1 2.5 5.0 2.5 STEADY AT…. 2%Handysize 10-40,000 85 30 0.9 0.3 1.8 1.9 1.3 2.3 0.9 DOWN BY….. -23%<strong>Bulk</strong>ers > 10,000 296 169 5.0 3.0 22.8 15.1 9.5 20.1 12.4 UP BY…. 24%Combos > 10,000 0 0 0.0 0.0 0.0 0.0 0.2 0.0 0.0Total <strong>Bulk</strong> <strong>Vessel</strong>s 652 463 11.4 9.5 35.0 49.9 35.4 41.4 38.1 UP BY…. 84%Special <strong>Vessel</strong>Contracting2002 Jun* 2002 Jun* 1999 2000 2001 2002 Jun* This Year v. LastLNG Carriers 19 3 1.6 0.2 0.4 1.4 1.6 1.3 0.2 DOWN BY….. -67%LPG Carriers 14 14 0.2 0.3 0.2 0.5 0.7 0.3 0.4 UP BY…. 153%Reefers 2 0 0.0 0.0 0.0 0.0 0.0 0.0 0.0 DOWN BY….. -100%Containers > 3,000 teu 58 106 2.4 4.6 5.5 8.7 4.7 3.9 7.7 UP BY…. 296%Containers < 3,000 teu 71 69 0.9 0.9 1.7 4.0 2.1 1.4 1.3 UP BY…. 93%Other Dry > 5,000 dwt 102 78 2.3 1.7 1.1 1.8 0.9 1.4 0.9 UP BY…. 31%Offshore & Others 140 42 1.0 0.2 0.6 1.2 1.6 1.4 0.3 DOWN BY….. -51%Cruise <strong>Vessel</strong>s 4 1 0.2 0.1 0.1 0.1 0.0 0.0 0.0 UP BY…. 102%Ro-Ro Ferries 32 11 0.8 0.3 0.1 0.1 0.1 0.1 0.0 DOWN BY….. -33%Total Special <strong>Vessel</strong>s 442 324 9.4 8.5 9.7 17.8 11.7 9.8 10.9 UP BY…. 123%TotalContractingNo. end m.CGT, end: m. DWT, end:No. endm.CGT, end:No. end m.CGT, end: m. DWT, end:2002 Jun* 2002 Jun* 1999 2000 2001 2002 Jun* This Year v. LastAll <strong>Vessel</strong>s Types 1,094 787 20.7 17.9 44.6 67.7 47.1 51.3 49.1 UP BY…. 91%Clarkson Research Studies Page 4m. DWT, end:Ordering TrendsOrdering TrendsOrdering TrendsN.B. Details of special cargo ships orderbook, in terms of special units of measurement e.g. cbm, teu, '000 cuft. etc. may be found in the blue centre pages. - denotes figureunavailable.Jul-03
New Orders by <strong>Vessel</strong> Type<strong>Bulk</strong> <strong>Vessel</strong>Contracting1995 1996 1997 1998 1999 2000 2001 2002 Jun* This Year v. LastVLCC > 200,000 0.4 3.0 7.7 4.4 3.9 8.8 3.6 2.7 5.2 UP BY…. 285%Suezmax 120-200,000 0.9 1.3 2.4 1.4 0.6 3.7 1.6 1.2 2.0 UP BY…. 222%Aframax 80-120,000 0.9 1.6 2.9 1.7 0.5 3.2 4.0 2.6 2.4 UP BY…. 83%Panamax 60-80,000 0.0 0.0 0.4 0.6 0.2 0.3 1.1 1.8 1.4 UP BY…. 55%Products 10-60,000 0.4 0.8 1.1 0.5 0.8 1.9 2.9 2.2 2.4 UP BY…. 122%Chemical 10-60,000 0.5 0.6 0.9 0.5 0.5 0.7 0.8 1.0 0.5 UP BY…. 7%Specialised 10-60,000 0.2 0.0 0.1 0.1 0.1 0.1 0.0 0.1 0.0 DOWN BY….. -100%Tankers > 10,000 3.4 7.5 15.5 9.2 6.6 18.8 14.0 11.5 13.8 UP BY…. 140%Tankers < 10,000 0.2 0.2 0.3 0.2 0.1 0.1 0.3 3.7 0.1 DOWN BY….. -92%Capesize > 80,000 3.7 1.4 3.2 2.0 3.5 2.2 1.9 3.7 2.7 UP BY…. 48%Panamax 60-80,000 3.5 2.0 2.6 1.9 5.0 2.0 1.0 2.9 2.0 UP BY…. 35%Handymax 40-60,000 3.0 2.2 1.3 0.6 2.7 3.1 1.5 2.9 1.5 STEADY AT…. 2%Handysize 10-40,000 2.0 1.3 1.2 0.6 1.1 1.3 0.8 1.4 0.5 DOWN BY….. -24%<strong>Bulk</strong>ers > 10,000 12.3 6.8 8.2 5.0 12.4 8.5 5.2 10.9 6.7 UP BY…. 23%Combos > 10,000 0.3 0.1 0.1 0.0 0.0 0.0 0.1 0.0 0.0Total <strong>Bulk</strong> <strong>Vessel</strong>s 16.1 14.5 23.9 14.2 19.0 27.3 19.3 22.4 20.5 UP BY…. 83%Special <strong>Vessel</strong>Contracting1995 1996 1997 1998 1999 2000 2001 2002 Jun* This Year v. LastLNG Carriers 0.3 0.6 0.9 0.1 0.5 1.9 2.1 1.9 0.3 DOWN BY….. -70%LPG Carriers 0.5 0.1 0.4 0.5 0.2 0.5 0.6 0.2 0.3 UP BY…. 152%Reefers 0.2 0.2 0.3 0.1 0.0 0.0 0.0 0.0 0.0 DOWN BY….. -100%Containers > 3,000 teu 3.6 2.3 0.8 3.4 5.0 7.7 4.3 3.6 7.0 UP BY…. 285%Containers < 3,000 teu 3.2 3.3 1.5 1.4 1.4 3.1 1.7 1.1 1.1 UP BY…. 105%Other Dry > 5,000 dwt 2.0 2.1 3.2 2.6 1.5 2.5 1.3 2.3 1.7 UP BY…. 51%Offshore & Others 0.3 0.6 0.9 1.1 0.5 0.9 1.1 1.0 0.3 DOWN BY….. -47%Cruise <strong>Vessel</strong>s 0.7 0.4 0.5 1.3 1.5 1.3 0.2 0.1 0.1 UP BY…. 93%Ro-Ro Ferries 0.4 0.4 0.2 0.5 0.8 0.5 0.2 0.4 0.2 DOWN BY….. -17%Total Special <strong>Vessel</strong>s 11.1 10.0 8.8 10.9 11.4 18.5 11.5 10.8 11.0 UP BY…. 104%TotalContractingRecently Confirmed Shipbuilding ContractsDate Type Dwt Unit DeliveryBuilder Hull No. $m. OwnerJun-03 Handy Chem 37,300 1 2005 Jinling Shipyd. 02-0505 Rigel SchiffahrtsJun-03 Handy Chem 37,300 1 2005 Jinling Shipyd. 02-0506 Brostrom Tankers SAJun-03 Handy Chem 19,500 1 2005 Shanghai Edward Donsotank RederiJun-03 Small/Spec 8,500 1 2005 Sasaki Zosen Schoeller HoldingsJun-03 Small/Spec 8,500 1 2004 Sasaki Zosen Schoeller HoldingsJun-03 Small/Spec 8,500 1 2004 Sasaki Zosen Schoeller HoldingsJun-03 Small/Spec 2,850 1 2004 Shitanoe Zosen Samudera Shpg. LineJun-03 Capesize 82,500 1 2006 Tsuneishi Zosen Unknown OwnerJun-03 Capesize 82,500 1 2006 Tsuneishi Zosen Unknown OwnerJun-03 Capesize 82,500 1 2006 Tsuneishi Zosen Unknown OwnerJun-03 Capesize 82,500 1 2006 Tsuneishi Zosen Unknown OwnerJun-03 Capesize 82,500 1 2006 Tsuneishi Zosen Unknown OwnerJun-03 Capesize 82,500 1 2006 Tsuneishi Zosen Unknown OwnerJun-03 Capesize 82,500 1 2006 Tsuneishi Zosen 1309 Chios NavigationJun-03 Capesize 82,500 1 2006 Tsuneishi Zosen Unknown OwnerJun-03 Panamax 74,500 1 2007 Hudong S/Yard Iolcos HellenicJun-03 Panamax 74,500 1 2007 Hudong S/Yard Iolcos HellenicJun-03 Panamax 42,200 3,100 TEU 1 2006 Szczecin. Nowa B178/116 Peter Dohle Schiff.Jun-03 Panamax 42,200 3,100 TEU 1 2005 Szczecin. Nowa B178/115 Peter Dohle Schiff.Jun-03 Sub-Panamx 34,500 2,500 TEU 1 2005 H.D.W. MPC SteamshipJun-03 Sub-Panamx 34,500 2,500 TEU 1 2004 H.D.W. MPC SteamshipJun-03 MPP > 5K DWT 10,400 1 2005 Damen Galati Jorker Shipmngt.Jun-03 MPP > 5K DWT 10,400 1 2004 Damen Galati Jorker Shipmngt.1995 1996 1997 1998 1999 2000 2001 2002 Jun* This Year v. LastAll <strong>Vessel</strong>s Types 27.2 24.6 33.0 25.3 30.5 45.9 31.1 33.6 31.7 UP BY…. 89%Clarkson Research Studies Page 5Million GT Ordering TrendsMillion GT Ordering TrendsMillion GT Ordering TrendsN.B. Details of special cargo ships orderbook, in terms of special units of measurement e.g. cbm, teu, '000 cuft. etc. may be found in the blue centre pages. - denotes figureunavailable.Jul-03
16.014.012.010.08.06.04.02.00.0Mar-96Sep-96Quarterly Deliveries (DWT)Tankers <strong>Bulk</strong>ers GasContainer OtherMar-97Sep-97Mar-98Sep-98Mar-99Sep-99Mar-00Deliveries by <strong>Vessel</strong> TypeSep-00Mar-01Sep-01Source: Clarkson Research StudiesMar-02Sep-02Mar-03Summary• So far this year (to the end of June) 26.3m dwt ofvessels, amounting to 504 ships, have been delivered..Tankers• The number of Aframax tankers delivered so far thisyear (38), has now surpassed the 36 deliveries for thewhole of 2002. In June Vela International took delivery ofthe 97,200dwt “ALDEBARAN STAR” from Daewoo SB.Dry <strong>Bulk</strong> Carriers• Potentially Capesize deliveries this year couldsurpass last year, having already reached 13 vessels.Containerships• It is unlikely >3,000 teu containership deliveries willovertake last year, even though so far 39 ships have beendelivered, compared to 59 vessel by the end of June 2002<strong>Bulk</strong> <strong>Vessel</strong>DeliveriesNo. end m.CGT, end: m. DWT, end:2002 Jun* 2002 Jun* 1999 2000 2001 2002 Jun* 2003 2004 2005VLCC > 200,000 39 19 1.9 0.9 9.0 12.3 7.8 12.3 5.9 11.4 8.9 7.2Suezmax 120-200,000 24 11 0.8 0.3 2.4 3.3 2.5 3.8 1.8 4.7 3.3 3.3Aframax 80-120,000 36 38 0.8 0.9 5.0 2.3 1.5 3.8 4.0 7.8 4.8 4.4Panamax 60-80,000 10 12 0.2 0.3 0.6 1.1 0.3 0.7 0.8 1.8 2.7 2.7Products 10-60,000 57 42 1.1 0.8 1.8 1.2 1.3 2.2 1.7 4.0 4.2 3.6Chemical 10-60,000 37 32 0.5 0.4 1.3 1.1 0.7 1.0 0.8 1.9 1.2 0.7Specialised 10-60,000 3 1 0.0 0.0 0.1 0.2 0.2 0.1 0.0 0.1 0.1 0.0Tankers > 10,000 206 155 5.4 3.7 20.2 21.4 14.2 23.7 15.1 31.7 25.1 21.8Tankers < 10,000 45 38 0.3 0.2 0.3 0.2 0.2 0.3 0.2 0.6 0.3 0.1Capesize > 80,000 25 13 0.6 0.3 4.3 6.1 5.4 4.1 2.2 4.5 5.6 4.9Panamax 60-80,000 56 11 1.1 0.2 4.7 4.0 8.3 4.2 0.8 1.7 4.3 3.0Handymax 40-60,000 86 37 1.3 0.6 1.9 1.8 5.1 4.3 1.9 3.6 3.3 2.5Handysize 10-40,000 56 29 0.6 0.3 1.8 1.4 1.6 1.5 0.8 1.7 1.7 0.7<strong>Bulk</strong>ers > 10,000 223 90 3.7 1.4 12.7 13.3 20.5 14.1 5.8 11.4 15.0 11.2Combos > 10,000 0 1 0.0 0.1 0.4 0.0 0.0 0.0 0.1 0.2 0.0 0.0Total <strong>Bulk</strong> <strong>Vessel</strong>s 474 284 9.5 5.5 33.7 34.9 35.0 38.1 21.2 43.9 40.3 33.1Special <strong>Vessel</strong>Deliveries2002 Jun* 2002 Jun* 2001 2000 2001 2002 Jun* 2003 2004 2005LNG Carriers 10 4 0.9 0.3 0.5 0.8 0.1 0.7 0.3 1.1 1.5 1.0LPG Carriers 24 13 0.3 0.3 0.3 0.5 0.5 0.3 0.3 0.8 0.3 0.3Reefers 2 0 0.0 0.0 0.2 0.1 0.0 0.0 0.0 0.1 0.0 0.0Containers > 3,000 teu 89 39 3.4 1.5 1.6 3.9 5.5 5.8 2.5 4.9 6.1 5.5Containers < 3,000 teu 113 49 1.6 0.7 1.9 2.0 2.5 2.5 1.0 2.3 1.7 0.7Other Dry > 5,000 dwt 90 37 1.6 0.7 1.8 2.1 1.1 1.2 0.6 1.7 1.2 0.7Offshore & Others 141 60 1.0 0.5 1.2 1.3 0.7 0.7 0.0 0.0 0.0 0.0Cruise <strong>Vessel</strong>s 14 6 1.4 0.3 0.1 0.1 0.1 0.1 0.0 0.1 0.1 0.0Ro-Ro Ferries 35 12 1.1 0.4 0.1 0.1 0.1 0.1 0.0 0.1 0.1 0.0Total Special <strong>Vessel</strong>s 518 220 11.4 4.7 7.7 10.9 10.7 11.5 4.8 11.1 11.0 8.1DeliveriesNo. endm.CGT, end:m. DWT, end:Total No. end m.CGT, end: m. DWT, end:Delivery TrendsDelivery TrendsDelivery Trends2002 Jun* 2002 Jun* 2001 2000 2001 2002 Jun* 2003 2004 2005All <strong>Vessel</strong>s Types 992 504 20.9 10.1 41.3 45.8 45.6 49.6 26.3 56.9 52.8 41.8N.B. Specialised ships deliveries in terms of other units of measurement (e.g. cbm, teu) are in the blue centre pages. * denotes data for year to date. Deliveries are those reportedClarkson Research Studies Page 6Jul-03
Deliveries by <strong>Vessel</strong> TypeType <strong>Vessel</strong> Name Flag Dwt Unit Delivery Builder OwnerVLCC Iran Damavand IR. 299,500 Jun 2003 Dalian New Yard Nat. Iranian TankerAframax Aldebaran Star M.I. 97,200 Jun 2003 Daewoo S.B. Vela InternationalPanamax Sunlight Venture H.K. 70,200 Jun 2003 Universal S.B. Wah Kwong Shpg.Handy Chem Petro Vario SG. 16,500 Jun 2003 Kyokuyo S/yard Petroships Pte.Handy Chem Chemroad Vega PA. 30,050 Jun 2003 Shin Kurushima Iino Kaiun KaishaHandy Chem Stenheim GB. 16,400 Jun 2003 Jiangnan S/Yard Stenersen A/SSmall/Spec Whitchampion BR. 4,500 Jun 2003 Gemak Shipyard Whitaker, John H.Small/Spec Bro Genius NE. 7,560 Jun 2003 Ferus Smit Erik Thun ABSmall/Spec Presto BE. 2,460 Jun 2003 Damen Shipyards Dagevos <strong>Shipping</strong>Small/Spec New Millennium H.K. 7,500 Jun 2003 Kurinoura Dock Unknown OwnerSmall/Spec Tasco Amata TH. 7,000 78,000 cbm Jun 2003 Shin Kurushima Tipco Maritime Co.VLGC LPG Gas Capricorn PA. 48,500 Jun 2003 Mitsubishi H.I. Nippon Yusen KaishaCapesize Aquacharm GR. 169,800 May 2003 Sasebo H.I. Carras HellasHandymax Eternal Athena H.K. 46,500 Jun 2003 Oshima S.B. Co. Libera CorporationHandysize IVS Viscount LI. 34,300 Jun 2003 Xingang S.Y. Dockendale Shpg Co.Handysize Infinite Wisdom PA. 12,500 3,607 TEU Jun 2003 Higaki Zosen Wisdom Marine LinesPanamax Barcelona Bridge PA. 37,230 2,495 TEU Jun 2003 Hyundai H.I. NVA NorddeutscheSub-Panamx CSAV Shenzhen PA. 33,000 1,728 TEU May 2003 Naikai S.B. Schepers & Co.Handy Robert Rickmers PA. 22,900 1,118 TEU Jun 2003 Szczecin. Nowa Rickmers ReedereiHandy Asian Island AT. 13,760 950 GT Jun 2003 Jiangdong S/Y W. BockstiegelOffshore Al Saqr UAE 650 690 GT Apr 2003 ABG Shipyard Al Mansoori Product.Offshore Zamil 21 PA. 900 8,100 GT Mar 2003 ABG Shipyard Zamil OperationsRo-Ro Ferries Lobo Marinho PO. 800 1,150 GT Apr 2003 Vianayard Porto Santo Line<strong>Bulk</strong> <strong>Vessel</strong>Deliveries1995 1996 1997 1998 1999 2000 2001 2002 Jun* 2003 2004 2005VLCC > 200,000 3.9 3.6 1.6 2.0 4.7 6.4 4.1 6.4 3.1 5.9 4.6 3.7Suezmax 120-200,000 0.6 0.7 0.9 1.7 1.3 1.8 1.3 2.0 0.9 2.4 1.7 1.7Aframax 80-120,000 0.7 0.8 1.0 2.0 2.8 1.3 0.9 2.1 2.2 4.3 2.6 2.4Panamax 60-80,000 0.1 0.1 0.0 0.0 0.4 0.6 0.2 0.4 0.5 1.0 1.5 1.5Products 10-60,000 0.7 1.0 0.5 0.8 1.1 0.7 0.8 1.4 1.1 2.5 2.6 2.2Chemical 10-60,000 0.2 0.4 0.5 0.7 0.8 0.7 0.4 0.6 0.5 1.2 0.7 0.4Specialised 10-60,000 0.1 0.2 0.1 0.1 0.1 0.1 0.1 0.1 0.0 0.1 0.1 0.0Tankers > 10,000 6.4 6.8 4.6 7.4 11.2 11.7 7.8 13.0 8.3 17.4 13.8 11.9Tankers < 10,000 0.2 0.2 0.2 0.3 0.2 0.1 0.1 0.2 0.2 0.4 0.2 0.1Capesize > 80,000 3.0 4.1 3.8 1.1 2.2 3.1 2.8 2.1 1.1 2.3 2.8 2.5Panamax 60-80,000 2.2 1.7 2.8 2.3 2.5 2.1 4.4 2.2 0.4 0.9 2.2 1.6Handymax 40-60,000 2.2 2.6 2.1 2.1 1.1 1.0 2.9 2.6 1.1 2.1 2.0 1.4Handysize 10-40,000 1.3 1.4 1.6 1.2 1.1 0.9 1.0 1.0 0.5 1.1 1.0 0.4Dry <strong>Bulk</strong> > 10,000 8.7 9.7 10.4 6.7 6.9 7.2 11.2 7.8 3.2 6.4 8.1 6.0Combos > 10,000 0.0 0.2 0.2 0.0 0.3 0.0 0.0 0.0 0.1 0.1 0.0 0.0Total <strong>Bulk</strong> <strong>Vessel</strong>s 15.3 16.9 15.4 14.3 18.6 19.0 19.2 21.0 11.7 24.3 22.1 17.9Special <strong>Vessel</strong>Deliveries1995 1996 1997 1998 1999 2000 2001 2002 Jun* 2003 2004 2005LNG Carriers 0.5 0.7 0.5 0.4 0.7 1.2 0.1 1.0 0.4 1.5 2.0 1.4LPG Carriers 0.2 0.4 0.3 0.2 0.3 0.4 0.4 0.3 0.3 0.7 0.2 0.2Reefers 0.0 0.1 0.2 0.2 0.2 0.1 0.0 0.0 0.0 0.1 0.0 0.0Containers > 3,000 teu 2.3 2.6 3.0 3.2 1.5 3.5 5.0 5.2 2.3 4.5 5.6 5.1Containers < 3,000 teu 1.6 2.1 2.9 2.9 1.5 1.5 2.0 1.9 0.8 1.8 1.3 0.5Other Dry > 5,000 dwt 1.2 1.0 1.3 2.4 2.8 3.2 1.7 1.7 0.8 2.3 1.9 1.4Offshore & Others 0.2 0.4 0.5 0.6 1.0 0.9 0.6 0.6 0.3 0.3 0.0 0.0Cruise <strong>Vessel</strong>s 0.4 0.6 0.4 0.7 0.6 0.7 0.8 1.1 0.2 1.1 0.9 0.2Ro-Ro Ferries 0.3 0.5 0.3 0.3 0.2 0.3 0.8 0.6 0.2 0.4 0.4 0.1Total Special <strong>Vessel</strong>s 6.8 8.3 9.3 10.9 8.7 11.8 11.4 12.5 5.3 12.6 12.5 8.9TotalDeliveriesRecent Shipbuilding DeliveriesMillion GTMillion GTMillion GTDelivery TrendsDelivery TrendsDelivery Trends1995 1996 1997 1998 1999 2000 2001 2002 Jun* 2003 2004 2005All <strong>Vessel</strong>s Types 22.0 25.2 24.7 25.2 27.3 30.7 30.6 33.5 17.0 37.8 35.3 26.9N.B. Specialised ships deliveries in terms of other units of measurement (e.g. cbm, teu) are in the blue centre pages. * denotes data for year to date. Deliveries are those reportedClarkson Research Studies Page 7 Jul-03
90.085.080.075.070.065.060.055.050.045.040.035.030.025.020.0$m<strong>Bulk</strong> <strong>Vessel</strong>Prices…Tanker Newbuilding PricesShipbuilding Price TrendsPrice $ million, endPrice DevelopmentsSummary• In the tanker market, Minerva Marine increased itsseries of Aframaxes at Samsung to seven vessels afterdeclaring two options. Hyundai Mipo also benefited fromthe declaration of options with another two Boston Beam37,000dwt ice classed ships for Tsakos and a further threeunits for Interorient. This takes these buyers' orders at theyard to 6 and 13 ships respectively.• Prices in the LNG sector have failed to rise in linewith the rest of the market due to fierce competitionbetween the Japanese and the Korean yards both internallyand externally. Pricing was not helped by the report thatGaz de France has ordered a 153,000 cbm LNG carrier atChantiers de l’Atlantique for E195m ($220m), which isaround $70m more than Far East bids.• It has been an active time for the dry bulk market aswell with the Japanese domestic shipowners finalising anumber of negotiations before the new IACS rules cameinto force. Tsuneishi extended its series of 229m LOAKamsarmax bulkers to 20 units and have also taken aconventional Panamax order for delivery at the end of2005. In China, Restis has signed contracts at Kouanshipyard for four Handymax bulkers with numerousoptions.Price Trend Against a1995 1996 1997 1998 1999 2000 2001 2002 Jun* Year Ago Is…VLCC 300,000 dwt 85.00 82.00 83.00 72.50 69.00 76.50 70.00 63.50 67.00 STEADY... 2.3%Suezmax 150,000 dwt 54.00 51.00 52.00 44.00 42.50 52.50 46.50 43.75 46.25 FIRMER... 5.1%Aframax 110,000 dwt 43.50 40.50 41.00 34.50 33.00 41.50 36.00 34.75 37.00 FIRMER... 7.2%Panamax 70,000 dwt 37.50 37.00 31.00 31.00 36.00 32.00 31.25 33.00 STRONG... 10.9%Handy 47,000 dwt 33.50 31.50 31.50 26.00 26.00 29.50 26.25 27.00 29.00 STRONG... 10.5%Capesize 170,000 dwt 42.50 39.00 40.50 33.00 35.00 40.50 36.00 36.25 38.50 STRONG... 11.6%Panamax 75,000 dwt 28.50 26.50 27.00 20.00 22.00 22.50 20.50 21.50 22.50 FIRMER... 4.7%Handymax 51,000 dwt 24.00 23.00 22.50 18.00 20.00 20.50 18.50 19.00 19.75 FIRMER... 3.9%Handysize 30,000 dwt 19.50 19.00 18.00 14.25 15.50 15.00 14.50 15.00 15.75 FIRMER... 6.8%Price Index 140 133 131 111 107 114 108 106 110 FIRMER... 4.2%% change -6% -2% -15% -4% 7% -5% -3% 4%Other <strong>Vessel</strong>Prices…VLCCAframaxHandySuezmaxPanamaxJun-98Sep-98Dec-98Mar-99Jun-99Sep-99Dec-99Mar-00Jun-00Sep-00Dec-00Mar-01Jun-01Sep-01Dec-01Mar-02Jun-02Sep-02Dec-02Mar-03Jun-03Source: Clarkson Research StudiesPrice $ million, endPrice Trend Against a1995 1996 1997 1998 1999 2000 2001 2002 Jun* Year Ago Is…LNG 138,000 m 3 230.0 220.0 230.0 190.0 165.0 172.5 165.0 150.0 150.0 SOFTER... -4.5%LPG 78,000 m 3 70.00 68.00 62.00 58.00 56.00 60.00 60.00 58.00 60.00 FIRMER... 3.4%Container 725 teu 18.00 17.00 13.50 14.00 14.00 13.00 13.00 14.00 FIRMER... 7.7%Container 1,000 teu 21.00 20.00 18.00 17.50 18.00 15.50 15.50 16.50 FIRMER... 6.5%Container 1,700 teu 31.00 29.00 24.50 23.00 25.00 21.50 21.00 22.00 FIRMER... 4.8%Container 2,000 teu 35.00 33.00 29.00 28.00 31.50 28.00 27.00 28.00 STEADY... 1.8%Container 2,750 teu 38.00 38.00 31.00 33.00 37.50 31.00 29.50 32.50 STRONG... 8.3%Container 3,500 teu 52.00 50.00 42.00 38.00 41.50 36.00 33.00 37.00 STRONG... 10.4%Container 4,600 teu 54.00 52.00 45.00 49.00 FIRMER... 7.7%Container 6,200 teu 73.00 72.00 60.00 63.00 STEADY... 1.6%Ro-Ro 1,2-1,300 Lm 24.00 19.50 21.50 20.00 19.00 18.50 19.25 STEADY... 1.3%Ro-Ro 2,3-2,700 Lm 37.00 30.00 32.50 33.00 31.00 31.00 32.00 FIRMER... 3.2%Sources: <strong>Clarksons</strong>. Ro-Ro prices for 1997 are averages not end year. All historial data refers to standard vessel sizes published at the time. The dwt sizes quoted refer to thelatest spec. in that vessel sector, and new vessel sizes are introduced from time to time. Tanker and Capesize prices are for double-hull vessels; VLCCs from 1992, Suezmax &Aframax from 1990. Panamax and Handy Tankers are coated. Price data assumes a "European spec", with 10/10/10/70% payments, basis "first class competitive yards".Price data latest available at time of press. NB Price Index is value at the end of the previous month.Clarkson Research Studies Page 8Jul-03
353025201510509.20.99.43.6Shipbuilding Investment & Key RatiosInvestment in <strong>Bulk</strong> <strong>Vessel</strong>s ($bn.)Total ContainerTotal GasTotal <strong>Bulk</strong> CarriersTotal Tankers7.71.35.36.63.02.35.711.56.55.60.90.73.0 6.86.24.012.33.65.43.112.1 11.04.1 2.96.10.74.08.7 9.21995 1996 1997 1998 1999 2000 2001 2002 2003Source: Clarkson Research Studies6.34.26.9Investment Scene This MonthNewbuilding Investment Summary• Money continues to pile into shipping, withnewbuilding investment now 91% ahead of last year’s rateof investment. At this time last year we recorded $22.5bninvested in newbuildings. To the end of June $21.5bn hasgone into the industry.• A further $0.9bn was invested into >3,000 teunewbuildings during June. At $5.9bn the level of investmentin this sector so far this year is close to double the totalamount invested in 2002.• We understand German financiers are in talks with anAsian owner or owners about the construction of a series of9,600 teu vessels. No price has been reported, but recentlyCostamare placed orders for 8,200 teu containerships atbetween $80-81m each.InvestmentTrends1995 1996 1997 1998 1999 2000 2001 2002 JunVLCC > 200,000 0.3 1.6 4.0 2.1 1.7 4.1 1.6 1.1 2.1 UP BY…. 285.0%Suezmax 120-200,000 0.6 0.9 1.5 0.8 0.3 2.2 1.0 0.7 1.1 UP BY…. 223.9%Aframax 80-120,000 0.7 1.2 2.0 1.1 0.3 2.1 2.8 1.5 1.4 UP BY…. 90.9%Panamax 60-80,000 0.0 0.0 0.4 0.5 0.1 0.2 1.0 1.4 1.1 UP BY…. 62.2%Handy 10-60,000 2.0 3.0 3.5 1.6 1.6 3.5 4.6 4.1 3.4 UP BY…. 67.5%Total Tankers 3.6 6.6 11.5 6.2 4.0 12.1 11.0 8.7 9.2 UP BY…. 110.3%Capesize > 80,000 1.9 0.6 1.6 0.9 1.4 1.1 0.9 1.5 1.6 UP BY…. 109.5%Panamax 60-80,000 2.7 1.4 1.8 1.1 2.7 1.1 0.6 1.5 1.1 UP BY…. 38.5%Handymax 40-60,000 2.5 1.9 1.0 0.4 1.8 2.1 1.0 1.8 0.9 STEADY…. 2.0%Handysize 10-40,000 2.4 1.5 1.3 0.5 1.0 1.1 0.7 1.2 0.5 DOWN BY….. -25.9%Total <strong>Bulk</strong> Carriers 9.4 5.3 5.7 3.0 6.8 5.4 3.1 6.1 4.0 UP BY…. 32.2%LNG 0.7 1.3 2.1 0.2 0.8 3.3 3.8 2.8 0.5 DOWN BY….. -67.5%LPG > 60,000m³ 0.2 0.0 0.3 0.5 0.1 0.4 0.4 0.1 0.2 UP BY…. 576%Container > 3,000 teu 4.5 2.8 1.1 3.7 4.6 7.9 4.3 3.1 5.9 UP BY…. 279.7%Container 1-3,000 teu 4.7 4.8 2.0 1.8 1.8 4.4 2.0 1.1 1.0 UP BY…. 81.2%Container < 1,000 teu 1.9 2.0 0.7 0.6 0.2 0.5 0.8 0.6 0.8 UP BY…. 150.9%Total Specialised 12.0 11.0 6.1 6.8 7.6 16.4 11.2 7.7 8.3 UP BY…. 116.5%Total 25.1 22.9 23.3 16.0 18.4 33.8 25.3 22.5 21.5 UP BY…. 91.3%% Change -9% 2% -31% 15% 84% -25% -11%Price Ratiosfor InvestorsValue $ billionPrice Ratios (Secondhand/Newbuilding)1995 1996 1997 1998 1999 2000 2001 2002 Jun v. End last YearVLCC 5 Yr. Old 64% 71% 78% 69% 77% 93% 83% 85% 91% UP BY…. 7.1%Suezmax 5 Yr. Old 70% 83% 85% 83% 82% 93% 84% 87% 95% UP BY…. 9.5%Aframax 5 Yr. Old 74% 85% 88% 68% 79% 94% 89% 76% 89% UP BY…. 17.0%Panamax 5 Yr. Old n/a 85% 88% 81% 79% 85% 73% 64% 82% UP BY…. 27.8%Handy 5 Yr. Old 67% 78% 86% 81% 77% 83% 78% 72% 81% UP BY…. 11.7%Tanker Average 69% 81% 85% 76% 79% 90% 81% 77% 88% UP BY…. 13.9%Capesize 5 Yr. Old 77% 72% 85% 78% 83% 75% 75% 80% 83% STEADY…. 3.9%Panamax 5 Yr. Old 75% 74% 81% 70% 76% 71% 68% 79% 83% UP BY…. 5.4%Handymax 5 Yr. Old 88% 82% 80% 69% 80% 74% 72% 75% 81% UP BY…. 8.0%Handysize 5 Yr. Old 85% 68% 76% 65% 74% 80% 76% 75% 79% UP BY…. 5.8%<strong>Bulk</strong> Carrier Average 81% 74% 81% 71% 78% 75% 73% 77% 82% UP BY…. 5.7%NB: The SH/NB ratios have been altered as above. The end 2001 figures have been adjusted in the same manner and the percentage changerepresents the gain/loss over the end 2001 value.Clarkson Research Studies Page 9Investment TrendsThis Year …Price Ratio TrendsJul-03
Orderbook by Country/RegionGlobal Orderbook 2003 by cgtAsian Orderbook 2003 by cgtP.R. China12.9%Europe19.6%South Korea45.4%P.R. China15.9%Others2.0%Japan35.3%Other Asia3.5%SouthKorea36.9%Source (all graphs): Clarkson Research StudiesJapan28.7%Spain7%Italy18%European Orderbook 2003 by cgtPoland15%Germany16%Croatia9%Other Europe35%MajorShipbuildersMillion DWTFor Delivery in:1993 1994 1995 1996 1997 1998 1999 2000 2001 2002 2003* 2003 2004 2005+Japan 5.38 20.23 26.54 28.67 36.08 36.21 34.42 37.94 39.39 40.94 46.74 10.39 19.53 16.82South Korea 4.83 12.90 22.26 23.01 31.09 33.95 36.66 50.36 46.73 45.15 56.48 11.50 21.28 23.71Taiwan 0.17 1.46 2.05 1.63 1.26 1.72 2.26 1.98 1.47 1.17 1.97 0.30 0.94 0.73P.R. China 0.30 2.10 4.62 5.70 5.23 4.03 7.77 9.57 12.03 15.12 19.38 4.70 6.72 7.95Other Asia 0.26 0.63 0.77 1.01 1.02 0.85 0.89 0.88 0.83 1.77 1.69 0.43 0.75 0.51TOTAL ASIA 10.94 37.32 56.24 60.02 74.68 76.76 82.00 100.74 100.44 104.16 126.26 27.33 49.22 49.72Germany 0.04 1.42 2.02 2.08 1.67 1.46 1.28 1.99 2.00 1.46 1.70 0.60 0.77 0.34Denmark 0.90 1.09 1.54 1.07 0.94 0.80 0.91 0.49 1.13 0.64 0.68 0.21 0.40 0.06France 0.37 0.23 0.21 0.13 0.07 0.10 0.07 0.07 0.06 0.08 0.08 0.03 0.05 0.00Italy 0.07 0.22 1.19 1.00 0.95 0.88 0.52 0.55 0.53 0.51 0.45 0.32 0.10 0.03Netherlands 0.01 0.07 0.17 0.35 0.43 0.51 0.37 0.36 0.48 0.59 0.55 0.15 0.27 0.12Spain 0.08 0.89 1.21 0.76 1.23 1.02 0.45 0.40 0.78 0.83 0.70 0.35 0.25 0.10Finland 0.33 0.39 0.38 0.23 0.07 0.06 0.05 0.08 0.06 0.06 0.05 0.01 0.04 0.00Norway 0.19 0.24 0.38 0.35 0.44 0.30 0.23 0.36 0.40 0.26 0.17 0.16 0.02 0.00Turkey 0.12 0.22 0.28 0.34 0.33 0.36 0.20 0.28 0.29 0.25 0.29 0.16 0.10 0.03Poland 0.09 1.32 2.47 2.00 1.67 1.40 1.40 2.90 2.34 1.91 2.15 0.69 0.80 0.66Ukraine 0.06 0.47 0.84 0.67 0.53 0.49 0.44 0.44 0.45 0.46 0.51 0.26 0.20 0.06Croatia 0.00 0.57 0.68 0.93 1.25 0.91 0.81 1.65 2.37 2.02 2.20 0.75 0.82 0.63Other Europe 0.88 1.07 1.56 1.40 1.37 1.26 1.18 1.01 1.05 0.90 1.14 0.57 0.30 0.27TOTAL EUROPE 3.13 8.19 12.94 11.29 10.95 9.56 7.90 10.58 11.93 9.97 10.67 4.24 4.13 2.29Brazil 0.25 0.25 0.18 0.08 0.18 0.06 0.06 0.05 0.51 0.62 0.62 0.05 0.25 0.31USA 0.21 0.32 0.43 0.67 1.11 1.00 0.85 1.48 1.61 1.47 1.46 0.64 0.40 0.41Others 0.07 0.07 0.07 0.08 0.08 0.08 0.06 0.03 0.04 0.04 0.04 0.03 0.01 0.00TOTAL OTHERS 0.53 0.63 0.68 0.84 1.36 1.14 0.96 1.57 2.16 2.12 2.11 0.73 0.66 0.72GLOBAL TOTAL 14.59 46.14 69.86 72.15 86.98 87.46 90.86 112.88 114.52 116.26 139.04 32.30 54.00 52.73*after a year indicates data are the latest year to date figures.Clarkson Research Studies Page 10Jul-03
MajorShipbuildersOrderbook by Country/RegionMillion CGTFor Delivery in:1993 1994 1995 1996 1997 1998 1999 2000 2001 2002 2003* 2003 2004 2005+Japan 2.7 7.2 9.9 11.6 13.5 11.8 11.2 12.3 12.9 14.3 15.7 1.2 6.7 5.3South Korea 1.4 3.9 7.2 7.4 9.0 9.9 11.4 15.8 15.3 15.6 20.2 1.6 7.5 9.1Taiwan 0.0 0.5 0.5 0.7 0.5 0.7 0.8 0.7 0.5 0.4 0.8 2.8 0.3 0.4P.R. China 0.1 0.8 1.9 2.5 2.5 2.1 3.1 4.0 5.0 5.8 7.1 1.5 2.5 2.6Other Asia 0.1 0.3 0.4 0.5 0.6 0.5 0.4 0.5 0.5 0.8 0.8 0.8 0.3 0.2TOTAL ASIA 4.4 12.7 19.9 22.7 26.1 25.1 26.9 33.3 34.4 36.8 44.5 7.9 17.3 17.6Germany 0.1 1.3 2.1 1.9 1.6 2.0 2.4 3.0 2.4 1.7 1.7 0.6 0.8 0.3Denmark 0.5 0.7 0.9 0.7 0.6 0.5 0.5 0.3 0.7 0.4 0.4 0.1 0.2 0.0France 0.4 0.4 0.5 0.4 0.4 0.8 1.1 1.1 0.8 0.6 0.6 0.4 0.1 0.1Italy 0.1 0.5 1.7 2.1 2.5 2.4 2.4 2.9 2.4 1.9 1.9 0.8 0.7 0.4Netherlands 0.0 0.1 0.3 0.5 0.4 0.6 0.5 0.4 0.5 0.5 0.4 0.2 0.2 0.1Spain 0.1 0.4 0.7 0.6 0.9 0.7 0.4 0.6 0.8 0.8 0.8 0.3 0.4 0.1Finland 0.6 1.1 0.9 0.7 0.5 0.5 0.7 1.1 0.9 0.6 0.5 0.2 0.3 0.0Norway 0.2 0.3 0.5 0.5 0.7 0.5 0.4 0.5 0.6 0.4 0.2 0.2 0.0 0.0Turkey 0.1 0.1 0.2 0.3 0.2 0.3 0.2 0.3 0.3 0.2 0.2 0.1 0.1 0.0Poland 0.1 0.8 1.4 1.1 0.9 0.9 1.0 1.8 1.5 1.4 1.6 0.5 0.7 0.5Ukraine 0.1 0.3 0.5 0.4 0.3 0.3 0.2 0.2 0.2 0.3 0.3 0.1 0.1 0.1Croatia 0.0 0.3 0.3 0.5 0.7 0.6 0.5 0.8 1.0 0.8 1.0 0.3 0.4 0.3Other Europe 0.4 0.5 0.8 0.8 0.9 1.0 1.0 0.9 1.0 0.9 1.0 0.6 0.3 0.1TOTAL EUROPE 2.5 6.9 10.9 10.4 10.7 10.9 11.2 13.8 13.1 10.5 10.7 4.3 4.4 2.1Brazil 0.1 0.1 0.1 0.1 0.1 0.1 0.1 0.1 0.2 0.3 0.3 0.1 0.1 0.1USA 0.1 0.3 0.5 0.7 1.1 0.9 0.7 0.8 0.8 0.7 0.7 0.4 0.2 0.1Others 0.1 0.1 0.2 0.2 0.2 0.2 0.1 0.1 0.1 0.1 0.1 0.0 0.0 0.0TOTAL OTHERS 0.3 0.5 0.7 0.9 1.3 1.1 0.9 1.0 1.1 1.1 1.1 0.5 0.4 0.2GLOBAL TOTAL 7.2 20.1 31.5 34.0 38.1 37.2 39.0 48.1 48.5 48.5 56.3 12.7 22.0 19.9MajorShipbuildersNumbers of <strong>Vessel</strong>sFor Delivery in:1993 1994 1995 1996 1997 1998 1999 2000 2001 2002 2003* 2003 2004 2005+Japan 76 336 489 595 657 533 501 538 529 604 642 162 282 198South Korea 40 153 298 292 312 317 364 513 476 484 630 121 236 273Taiwan 2 22 27 38 32 36 33 30 24 17 28 5 12 11P.R. China 11 58 151 217 210 180 208 248 313 362 437 128 160 149Other Asia 13 34 42 50 61 50 35 42 53 78 73 37 25 11TOTAL ASIA 142 603 1007 1192 1272 1116 1141 1371 1395 1545 1810 453 715 642Germany 4 64 112 116 98 89 78 105 107 82 85 32 39 14Denmark 18 31 32 29 24 19 12 11 15 7 8 2 5 1France 5 7 9 8 10 15 17 13 8 8 8 4 2 2Italy 9 14 56 64 74 69 46 49 45 44 44 26 14 4Netherlands 1 8 23 54 68 93 71 62 68 86 81 27 39 15Spain 6 29 44 44 51 33 23 22 28 35 34 15 17 2Finland 7 16 13 10 9 8 6 10 10 6 5 1 4 0Norway 11 22 36 44 64 44 24 42 60 48 33 28 5 0Turkey 4 16 24 34 28 35 26 38 42 39 41 26 13 2Poland 4 62 97 76 63 59 60 91 68 49 58 19 23 16Ukraine 7 17 25 19 17 14 13 13 14 21 28 7 13 8Croatia 0 14 18 26 35 28 23 36 48 39 48 12 18 18Other Europe 36 59 82 88 106 139 127 104 108 103 118 65 38 15TOTAL EUROPE 112 359 571 612 647 645 526 596 621 567 591 264 230 97Brazil 6 6 5 4 5 7 7 7 16 26 26 9 9 8USA 6 9 22 32 87 64 37 31 62 66 61 38 16 7Others 10 16 15 13 13 14 9 7 9 9 8 4 4 0TOTAL OTHERS 22 31 42 49 105 85 53 45 87 101 95 51 29 15GLOBAL TOTAL 276 993 1620 1853 2024 1846 1720 2012 2103 2213 2496 768 974 754*after a year indicates data are the latest year to date figures.Clarkson Research Studies Page 11 Jul-03
Contracting by Country/RegionOther Dry9.6%<strong>Bulk</strong>41.7%Japanese Contracts in 2003 (GT)Other2.6%Tanker42.9%Pass.L.P.G.0.3%1.0%Korean Contracts in 2003 (GT)L.N.G.0.5%Chem.7%L.N.G.0.5% <strong>Bulk</strong>Container41.7%4.6%Chemical4.6%Tanker42.9% Others5.8%Summary• Global contracting stands at 17.8m cgt, up 72% on anannualised basis, and 0.7m cgt higher than last month.• Asian yards now have 15.8m cgt on order at thehalfway point of 2003. This is more than the total for 2001.Japan• Japan has managed to regain some ground on SouthKorea. In May 2003 Japan’s proportion of the Asianorderbook was 3.5m cgt, or 27% of the Asian orderbook.This proportion has now increased to 29%. In June 2002Japan held over 18% of the Asian orderbook.China• The orderbook in China is now larger, at 2.5m cgt,than in 2002. In 2002 China won order for 151 vessels. Sofar this year orders for 146 vessels have been placed, whichis more than in 2000 and 2001, and not far from the numberfor 2002.South Korea• The South Korean orderbook at 8.2m cgt isapproaching twice the size of that of Japan. This couldpotentially be the largest South Korean orderbook since2000, which is quite amazing considering the South Koreanorderbook ten years ago was only 1.1m cgt.MajorShipbuilders1993 1994 1995 1996 1997 1998 1999 2000 2001 2002 2003*Japan 4.5 17.7 17.1 17.7 22.8 14.9 16.2 22.4 21.0 21.0 15.5 UP BY…. 47.5%South Korea 4.6 9.0 11.5 10.7 0.0 14.7 18.2 32.7 14.4 19.1 22.7 UP BY…. 136.7%Taiwan 0.2 1.3 1.1 0.7 0.8 1.1 1.2 0.5 0.1 0.7 1.1 UP BY…. 203.6%P.R. China 0.3 1.9 2.7 2.4 1.7 1.4 5.6 4.3 5.4 6.6 7.2 UP BY…. 115.5%Other Asia 0.0 0.4 0.3 0.5 0.2 0.4 0.5 0.4 0.5 1.4 0.2 DOWN BY… -77.5%TOTAL ASIA 9.6 30.3 32.6 32.1 25.5 32.3 41.7 60.4 41.4 48.9 46.5 UP BY…. 90.3%Germany 0.0 1.4 1.3 1.3 0.8 1.0 0.6 1.6 0.8 0.6 0.6 UP BY…. 116.3%Denmark 0.9 0.3 0.7 0.1 0.4 0.4 0.6 0.0 1.1 0.0 0.3 UP BY….France 0.0 0.0 0.0 0.0 0.0 0.0 0.0 0.0 0.0 0.0 0.0 DOWN BY… -100.0%Italy 0.0 0.2 1.0 0.2 0.4 0.2 0.1 0.2 0.1 0.1 0.1 UP BY…. 19.9%Netherlands 0.0 0.1 0.1 0.3 0.3 0.3 0.1 0.3 0.4 0.4 0.1 DOWN BY… -50.2%Spain 0.1 0.8 0.4 0.4 0.8 0.3 0.0 0.3 0.4 0.1 0.0 DOWN BY… -30.4%Finland 0.3 0.1 0.1 0.0 0.0 0.0 0.0 0.0 0.0 0.0 0.0 DOWN BY… -100.0%Norway 0.2 0.1 0.2 0.1 0.3 0.1 0.1 0.3 0.2 0.1 0.0 DOWN BY… -32.1%Turkey 0.1 0.1 0.1 0.1 0.1 0.1 0.1 0.2 0.1 0.1 0.1 UP BY…. 72.5%Poland 0.1 1.3 1.5 0.3 0.5 0.6 0.7 2.2 0.2 0.2 0.5 UP BY…. 401.8%Ukraine 0.1 0.4 0.4 0.0 0.0 0.0 0.0 0.0 0.0 0.1 0.1 UP BY…. 10.6%Croatia 0.0 0.6 0.1 0.7 0.5 0.1 0.3 1.1 1.1 0.2 0.5 UP BY…. 323.3%Other Europe 0.3 0.2 0.6 0.4 0.4 0.5 0.1 0.2 0.3 0.2 0.3 UP BY…. 276.5%TOTAL EUROPE 2.0 5.6 6.5 3.8 4.4 3.7 2.8 6.5 4.8 2.1 2.5 UP BY…. 136.1%Brazil 0.1 0.0 0.0 0.0 0.1 0.0 0.0 0.0 0.5 0.1 0.0 DOWN BY… -68.7%USA 0.2 0.1 0.1 0.2 0.5 0.3 0.1 0.8 0.4 0.1 0.0 DOWN BY… -53.9%Others 0.0 0.0 0.0 0.0 0.0 0.0 0.0 0.0 0.0 0.0 0.0 DOWN BY… -34.6%TOTAL OTHERS 0.3 0.1 0.1 0.3 0.7 0.3 0.1 0.8 0.9 0.2 0.0 DOWN BY… -59.9%GLOBAL TOTAL 12.0 36.0 39.3 36.2 30.6 36.3 44.6 67.7 47.1 51.3 49.1 UP BY…. 91.5%*after a year indicates data are the latest year to date figures.Million DWTTrends This Year-Clarkson Research Studies Page 12 Jul-03
MajorShipbuildersContracting by Country/RegionMillion CGTTrends This Year%1993 1994 1995 1996 1997 1998 1999 2000 2001 2002 2003*Japan 1.9 6.0 6.7 7.3 8.0 5.2 5.7 7.6 7.0 7.8 4.6 UP BY…. 16.3%South Korea 1.1 2.9 4.3 3.4 5.6 4.6 6.0 10.4 5.6 6.8 8.2 UP BY…. 138.5%Taiwan 0.0 0.5 0.3 0.4 0.3 0.5 0.3 0.3 0.1 0.2 0.5 UP BY…. 384.1%P.R. China 0.1 0.7 1.2 1.2 0.9 0.8 2.0 2.1 2.2 2.2 2.5 UP BY…. 123.6%Other Asia 0.0 0.2 0.0 0.3 0.2 0.2 0.2 0.3 0.3 0.6 0.1 DOWN BY… -79.5%TOTAL ASIA 3.2 10.2 12.5 12.6 15.0 11.2 14.2 20.6 15.1 17.7 15.8 UP BY…. 78.3%Germany 0.1 1.2 1.4 0.9 0.0 1.4 1.2 1.3 0.7 0.5 0.4 UP BY…. 79.5%Denmark 0.5 0.2 0.4 0.1 0.2 0.2 0.4 0.0 0.6 0.0 0.1 UP BY….France 0.0 0.2 0.1 0.1 0.2 0.6 0.6 0.3 0.2 0.1 0.1 UP BY…. 82.7%Italy 0.1 0.4 1.3 0.7 0.8 0.8 0.9 1.1 0.2 0.3 0.3 UP BY…. 104.9%Netherlands 0.0 0.1 0.3 0.3 0.3 0.4 0.2 0.4 0.3 0.3 0.1 DOWN BY… -44.3%Spain 0.1 0.4 0.3 0.2 0.5 0.1 0.1 0.4 0.4 0.2 0.0 DOWN BY… -60.4%Finland 0.6 0.5 0.1 0.3 0.1 0.3 0.3 0.7 0.1 0.2 0.0 DOWN BY… -100.0%Norway 0.2 0.2 0.2 0.3 0.5 0.1 0.3 0.4 0.3 0.2 0.0 DOWN BY… -53.4%Turkey 0.0 0.1 0.1 0.1 0.1 0.1 0.1 0.2 0.1 0.1 0.1 UP BY…. 60.7%Poland 0.1 0.8 0.8 0.2 0.3 0.4 0.6 1.3 0.1 0.4 0.4 UP BY…. 91.4%Ukraine 0.1 0.2 0.2 0.0 0.0 0.0 0.0 0.0 0.0 0.1 0.1 UP BY…. 32.0%Croatia 0.0 0.3 0.1 0.3 0.3 0.1 0.1 0.5 0.5 0.2 0.3 UP BY…. 260.5%Other Europe 0.2 0.2 0.4 0.3 0.4 0.4 0.2 0.3 0.3 0.2 0.2 UP BY…. 131.0%TOTAL EUROPE 1.8 4.8 5.7 3.8 3.7 5.0 4.8 6.8 3.9 2.7 2.1 UP BY…. 57.7%Brazil 0.0 0.0 0.0 0.0 0.0 0.0 0.0 0.0 0.2 0.1 0.0 DOWN BY… -55.7%USA 0.1 0.1 0.2 0.3 0.5 0.2 0.2 0.3 0.3 0.2 0.0 DOWN BY… -79.3%Others 0.0 0.1 0.1 0.1 0.1 0.1 0.1 0.1 0.0 0.1 0.0 DOWN BY… -14.6%TOTAL OTHERS 0.2 0.3 0.3 0.4 0.7 0.4 0.3 0.4 0.5 0.4 0.1 DOWN BY… -62.3%GLOBAL TOTAL 5.2 15.3 18.6 16.8 19.3 16.7 19.2 27.8 19.5 20.7 17.9 UP BY…. 73.0%MajorShipbuildersNumber of <strong>Vessel</strong>s1993 1994 1995 1996 1997 1998 1999 2000 2001 2002 2003*Trends This Year%Japan 65 338 417 437 436 279 312 352 338 387 204 UP BY…. 5.4%South Korea 36 125 198 131 199 156 208 337 179 230 262 UP BY…. 127.8%Taiwan 1 21 16 22 15 22 13 12 4 8 16 UP BY…. 300.0%P.R. China 10 50 103 111 75 68 118 132 143 151 146 UP BY…. 93.4%Other Asia 4 26 23 28 26 20 17 26 30 48 7 DOWN BY… -70.8%TOTAL ASIA 116 560 757 729 751 545 668 859 694 824 635 UP BY…. 54.1%Germany 2 62 93 77 47 64 40 78 48 32 25 UP BY…. 56.3%Denmark 18 18 12 14 9 9 7 4 12 0 4 UP BY….France 0 4 3 3 5 10 10 2 2 3 1 DOWN BY… -33.3%Italy 3 9 46 23 27 19 13 20 13 12 9 UP BY…. 50.0%Netherlands 1 8 21 46 45 67 24 51 45 58 15 DOWN BY… -48.3%Spain 6 24 21 20 24 6 4 12 17 15 6 DOWN BY… -20.0%Finland 6 10 2 4 4 7 3 6 3 3 0 DOWN BY… -100.0%Norway 11 18 21 30 45 13 14 36 38 26 7 DOWN BY… -46.2%Turkey 2 12 13 14 10 18 8 23 22 14 12 UP BY…. 71.4%Poland 4 64 54 14 19 27 36 62 6 8 15 UP BY…. 275.0%Ukraine 7 11 10 0 2 0 0 0 4 11 7 UP BY…. 27.3%Croatia 0 14 4 19 14 4 6 23 23 8 15 UP BY…. 275.0%Other Europe 17 28 45 39 57 79 28 23 34 29 29 UP BY…. 100.0%TOTAL EUROPE 77 282 345 303 308 323 193 340 267 219 145 UP BY…. 32.4%Brazil 3 0 0 1 2 5 0 2 10 11 4 DOWN BY… -27.3%USA 6 6 15 15 71 30 16 19 47 34 1 DOWN BY… -94.1%Others 9 13 10 9 9 9 5 6 5 6 2 DOWN BY… -33.3%TOTAL OTHERS 18 19 25 25 82 44 21 27 62 51 7 DOWN BY… -72.5%GLOBAL TOTAL 211 861 1127 1057 1141 912 882 1226 1023 1094 787 UP BY…. 43.9%*after a year indicates data are the latest year to date figures.Clarkson Research Studies Page 13 Jul-03
Deliveries by Country/Region30252015m.CGTScheduled Output by RegionOtherNon-EUEUChinaS KoreaJapanSummary• Deliveries grew by 6.0% on an annualised basis compared toJune 2002 to reach 26.3m dwt by the end of June 2003. The growthon last month is a healthy 27% for global total of deliveries. Thisdoes not include the recent delivery of the “MANUKAI”, the firstcommercial ship in 31 years to be delivered by the KvaernerPhiladelphia Shipyard.• Deliveries from Asian yards grew by 25% compared to lastmonth, with most of the increase in deliveries coming from theSouth Korean yards.• European yards continue to lose ground to the Asian yards.Deliveries from Germany, the most prolific European producer in2002 with 1.1m dwt, are down to 0.2m dwt so far. In 2002Germany had already delivered twice that amount.Japanese Output1050199319941995199619971998199920002001200220032004Source: Clarkson Research Studies200520068.07.06.05.04.03.02.01.00.0m. CGT19931994199519961997199819992000200120022003Source: Clarkson Research Studies200420052006MajorShipbuildersMillion DWTTrends This Year1993 1994 1995 1996 1997 1998 1999 2000 2001 2002 2003*Japan 14.2 12.9 14.5 16.0 15.5 14.8 18.1 18.9 19.6 19.4 9.7 STEADY…. -0.5%South Korea 8.1 6.9 10.2 11.9 0.0 11.8 15.5 19.0 18.0 20.7 11.3 UP BY…. 9.3%Taiwan 1.2 1.0 0.8 1.1 1.2 0.6 0.7 0.8 0.6 1.0 0.3 DOWN BY… -38.0%P.R. China 1.2 1.6 1.6 1.5 2.2 2.6 1.9 2.5 3.0 3.6 2.9 UP BY…. 60.7%Other Asia 0.1 0.1 0.2 0.4 0.2 0.5 0.4 0.4 0.5 0.5 0.2 STEADY…. -2.7%TOTAL ASIA 24.8 22.6 27.3 30.9 19.1 30.3 36.6 41.7 41.8 45.2 24.4 UP BY…. 8.0%Germany 1.0 1.2 1.2 1.3 1.2 1.2 0.7 0.9 0.8 1.1 0.4 DOWN BY… -32.4%Denmark 1.4 1.1 1.8 0.6 0.5 0.5 0.5 0.4 0.4 0.5 0.2 DOWN BY… -12.9%France 0.0 0.2 0.1 0.1 0.1 0.0 0.1 0.0 0.0 0.0 0.0 DOWN BY… -40.0%Italy 0.4 0.7 0.5 0.6 0.4 0.3 0.5 0.2 0.1 0.1 0.1 UP BY…. 99.9%Netherlands 0.1 0.1 0.2 0.2 0.2 0.3 0.3 0.3 0.2 0.3 0.1 DOWN BY… -5.1%Spain 0.7 0.2 0.3 1.1 0.3 0.5 0.6 0.3 0.2 0.1 0.2 UP BY…. 354.6%Finland 0.1 0.0 0.1 0.2 0.2 0.0 0.0 0.0 0.0 0.0 0.0 DOWN BY… -62.0%Norway 0.1 0.2 0.1 0.2 0.2 0.2 0.2 0.1 0.1 0.2 0.1 STEADY…. 4.2%Turkey 0.1 0.0 0.0 0.1 0.1 0.1 0.2 0.1 0.1 0.1 0.1 DOWN BY… -19.5%Poland 0.5 0.8 0.6 0.9 0.8 0.9 0.7 0.7 0.8 0.6 0.2 DOWN BY… -26.8%Ukraine 0.3 0.3 0.3 0.3 0.2 0.0 0.0 0.0 0.0 0.1 0.0 DOWN BY… -100.0%Croatia 0.3 0.4 0.2 0.6 0.2 0.5 0.4 0.3 0.4 0.6 0.3 STEADY…. -2.8%Other Europe 0.8 0.6 1.0 0.9 0.5 0.6 0.2 0.4 0.3 0.3 0.1 DOWN BY… -32.4%TOTAL EUROPE 5.9 5.7 6.4 7.0 4.9 5.1 4.5 3.9 3.6 4.1 1.8 DOWN BY… -11.5%Brazil 0.5 0.5 0.3 0.3 0.1 0.1 0.0 0.0 0.0 0.0 0.0 UP BY…. 1230%USA 0.0 0.1 0.1 0.1 0.2 0.4 0.2 0.2 0.3 0.3 0.0 DOWN BY… -69.8%Others 0.0 0.0 0.0 0.0 0.1 0.0 0.0 0.1 0.0 0.0 0.0 DOWN BY… -78.4%TOTAL OTHERS 0.6 0.5 0.4 0.4 0.3 0.5 0.3 0.2 0.3 0.3 0.1 DOWN BY… -57.6%GLOBAL TOTAL 31.2 28.9 34.1 38.2 24.3 35.9 41.3 45.8 45.6 49.6 26.3 UP BY…. 6.0%*after a year indicates data are the latest year to date figures.Clarkson Research Studies Page 14 Jul-03
MajorShipbuildersDeliveries by Country/RegionMillion CGTTrends This Year%1993 1994 1995 1996 1997 1998 1999 2000 2001 2002 2003*Japan 4.7 5.0 5.4 5.7 6.1 6.9 6.4 6.5 6.4 6.5 3.1 DOWN BY… -5.0%South Korea 1.9 2.1 3.0 3.7 4.1 3.6 4.5 5.9 6.1 6.6 3.5 UP BY…. 6.3%Taiwan 0.3 0.3 0.3 0.2 0.4 0.3 0.3 0.3 0.2 0.3 0.1 DOWN BY… -26.8%P.R. China 0.4 0.6 0.6 0.6 1.0 1.2 1.0 1.2 1.1 1.5 1.2 UP BY…. 53.9%Other Asia 0.1 0.1 0.0 0.2 0.1 0.3 0.3 0.2 0.2 0.3 0.1 DOWN BY… -5.3%TOTAL ASIA 7.4 8.1 9.3 10.5 11.7 12.3 12.4 14.2 14.1 15.3 8.0 UP BY…. 5.3%Germany 0.8 0.8 1.1 1.2 0.0 1.0 0.8 0.8 1.2 1.2 0.4 DOWN BY… -36.2%Denmark 0.4 0.3 0.4 0.4 0.4 0.3 0.3 0.2 0.2 0.3 0.1 DOWN BY… -5.5%France 0.1 0.2 0.2 0.3 0.2 0.2 0.2 0.3 0.4 0.3 0.1 DOWN BY… -48.8%Italy 0.4 0.4 0.3 0.5 0.5 0.9 1.0 0.6 0.7 0.7 0.3 DOWN BY… -16.4%Netherlands 0.2 0.1 0.3 0.2 0.3 0.3 0.3 0.4 0.3 0.3 0.2 DOWN BY… -8.1%Spain 0.2 0.2 0.2 0.4 0.2 0.3 0.3 0.3 0.2 0.1 0.1 UP BY…. 51.3%Finland 0.2 0.1 0.3 0.5 0.3 0.3 0.1 0.3 0.2 0.5 0.1 DOWN BY… -58.4%Norway 0.2 0.2 0.2 0.3 0.3 0.3 0.4 0.2 0.2 0.4 0.2 DOWN BY… -8.9%Turkey 0.0 0.0 0.0 0.0 0.1 0.1 0.1 0.1 0.1 0.1 0.1 DOWN BY… -13.5%Poland 0.3 0.4 0.4 0.5 0.5 0.5 0.5 0.5 0.5 0.5 0.1 DOWN BY… -49.4%Ukraine 0.1 0.1 0.1 0.2 0.1 0.0 0.0 0.0 0.0 0.1 0.0 DOWN BY… -100.0%Croatia 0.1 0.2 0.1 0.3 0.1 0.2 0.2 0.2 0.2 0.3 0.1 DOWN BY… -17.7%Other Europe 0.4 0.3 0.5 0.5 0.4 0.4 0.3 0.3 0.2 0.3 0.1 DOWN BY… -16.2%TOTAL EUROPE 3.4 3.5 4.0 5.2 3.3 4.8 4.6 4.2 4.7 5.2 1.9 DOWN BY… -27.4%Brazil 0.2 0.2 0.1 0.1 0.0 0.0 0.0 0.0 0.0 0.0 0.0 UP BY…. 972.4%USA 0.0 0.0 0.1 0.1 0.2 0.5 0.3 0.3 0.3 0.3 0.1 DOWN BY… -54.6%Others 0.1 0.1 0.1 0.1 0.1 0.1 0.1 0.1 0.1 0.1 0.0 UP BY…. 21.7%TOTAL OTHERS 0.3 0.3 0.3 0.3 0.3 0.6 0.5 0.4 0.3 0.4 0.1 DOWN BY… -23.2%GLOBAL TOTAL 11.1 11.9 13.6 16.0 15.3 17.8 17.5 18.8 19.1 20.9 10.1 STEADY…. -3.4%MajorShipbuildersNumber of <strong>Vessel</strong>sTrends This Year%1993 1994 1995 1996 1997 1998 1999 2000 2001 2002 2003*Japan 249 276 330 345 380 410 346 318 349 312 166 UP BY…. 6.4%South Korea 80 101 137 157 180 151 162 188 216 222 116 STEADY…. 4.5%Taiwan 9 9 13 12 21 18 16 15 10 15 5 DOWN BY… -33.3%P.R. China 32 42 41 50 94 111 90 96 79 104 71 UP BY…. 36.5%Other Asia 17 18 26 28 17 42 32 19 20 23 12 STEADY…. 4.3%TOTAL ASIA 387 446 547 592 692 732 646 636 674 676 370 UP BY…. 9.5%Germany 57 60 76 78 68 73 51 51 46 57 22 DOWN BY… -22.8%Denmark 27 22 22 20 15 14 14 5 8 8 3 DOWN BY… -25.0%France 1 3 2 5 3 5 8 6 7 3 1 DOWN BY… -33.3%Italy 22 22 14 19 18 24 37 17 17 13 9 UP BY…. 38.5%Netherlands 24 20 28 28 38 45 48 61 44 41 20 STEADY…. -2.4%Spain 9 10 9 21 17 24 16 13 13 8 7 UP BY…. 75.0%Finland 4 3 6 7 5 8 5 2 3 7 1 DOWN BY… -71.4%Norway 15 16 12 22 25 34 34 18 22 39 22 UP BY…. 12.8%Turkey 7 4 6 7 16 11 18 11 18 18 10 UP BY…. 11.1%Poland 24 25 32 38 33 31 35 31 29 27 6 DOWN BY… -55.6%Ukraine 9 9 9 9 4 3 1 0 3 4 0 DOWN BY… -100.0%Croatia 6 9 4 14 5 11 11 10 11 17 6 DOWN BY… -29.4%Other Europe 33 39 59 57 52 50 42 48 31 35 14 DOWN BY… -20.0%TOTAL EUROPE 238 242 279 325 299 333 320 273 252 277 121 DOWN BY… -12.6%Brazil 9 8 7 7 2 3 0 2 1 1 4 UP BY…. 700.0%USA 6 5 5 10 24 66 43 29 19 32 6 DOWN BY… -62.5%Others 6 12 13 12 10 8 10 8 3 6 3 0.0%TOTAL OTHERS 21 25 25 29 36 77 53 39 23 39 13 DOWN BY… -33.3%GLOBAL TOTAL 646 713 851 946 1027 1142 1019 948 949 992 504 STEADY…. 1.6%*after a year indicates data are the latest year to date figures.Clarkson Research StudiesPage 15Jul-03
VLCC10.3%Orderbookby Year ofDelivery:Ro-Ro >5KDWT0.7%FPSO/FSO2.2%LNG13.8%No. Cgt2003 22 816,8082004 43 1,641,2162005 43 1,712,7552006 8 455,466Total 116 4,626,245Shipyard Capacity (1)Aframax16.7%Shipyard Feature:Spotlight on Samsung Ship Building, South Korea.• One of the largest single site shipyards in the world,Samsung currently holds the second largest orderbook at4.6m cgt, consisting of 116 vessels. In April 2002, whenwe last examined the Samsung orderbook, it was evenlybalanced between tankers and containerships. Theemphasis has now changed toward the containerships• The current orderbook comprises 42 containershipsof 291,201 teu, which is a 90% increase on the volume ofteu on order at the yard this time last year. In deadweightterms the containership portion of the Samsung orderbookhas grown from 22% in 2002 to 25%in 2003.• The tanker portion of the orderbook consists of 53vessels of 1.59m cgt, the majority being Aframax tankers.Suezmax7.3%20-60Kcu.m. LPG3%PostPanamax38.7%• The shipyard has a considerable amount of forwardorderbook with 8 vessels of 455,466 cgt on order in 2006Shipbuilder….. Capacity* Output in Orderbook forShipyard…. Dock Berth Lgth gt cgt 2002 JuneNumber m. (,000) (,000) No. dwt cgt No. dwt cgtHyundai H.I. Ulsan South Korea 9 - 640 176 2,395 49 5,631 1,956 131 13,950 4,720 1Samsung S.B. Koje South Korea 3 - 640 170 1,081 35 4,184 1,362 114 13,342 4,597 2Daewoo S.B. Okpo South Korea 2 - 530 235 1,365 36 5,086 1,276 89 9,987 3,817 3Hyundai Mipo Ulsan South Korea 4 4 380 40 87 24 788 479 89 3,662 1,733 4Hyundai Samho Samho South Korea 2 - 512 164 415 22 3,275 650 53 7,037 1,626 5Mitsubishi H.I. Nagasaki Japan 2 2 375 199 506 5 328 398 20 1,671 1,327 6STX Shipbuild. Chinhae South Korea 1 3 320 41 204 18 756 338 59 3,053 1,171 7Tsuneishi Zosen Numakuma Japan 1 2 266 88 387 18 1,328 367 58 4,595 1,147 8Hanjin H.I. Busan South Korea 4 4 302 94 264 10 535 254 28 1,849 1,064 9Stocznia Gdynia Gdynia Poland 2 - 380 92 201 11 322 257 28 1,104 1,009 10I.H.I. Kure Japan 3 7 488 234 334 8 1,371 358 22 3,565 931 11Kawasaki H.I. Sakaide Japan 2 - 450 203 368 5 428 181 16 1,418 884 12Kanasashi K.K. Toyohashi Japan 1 - 275 60 234 9 482 170 17 381 849 13Imabari S.B. Marugame Japan 2 - 290 73 402 18 1,232 419 29 1,676 845 14Hudong S/Yard Shanghai China P.R. - 10 280 67 178 6 399 109 33 2,231 819 15Oshima S.B. Co. Oshima Japan 2 - 535 73 316 25 1,382 401 49 2,723 813 16CSBC Kaohsiung Taiwan 2 - 950 232 271 11 936 276 28 1,920 780 17Universal S.B. Ariake Japan - - - 160 0 1 298 48 17 4,840 754 18Universal S.B. Tsu Japan - - - 160 0 0 0 0 22 4,347 735 19Fincantieri Monfalcone Italy 1 - 350 131 232 2 15 274 5 43 708 20Mitsui S.B. Chiba Japan 3 6 419 189 363 8 1,234 269 13 2,114 653 21Shin Kurushima Onishi Japan 2 - 276 75 237 11 366 276 30 1,159 610 22Shina S.B. Chungmu South Korea - 3 165 34 91 7 200 106 29 1,182 605 23Dalian New Yard Dalian China P.R. 1 2 365 161 184 4 421 85 18 2,374 548 24De l'Atlantique St. Nazaire France 1 - 900 261 254 3 20 293 5 74 510 25Szczecin. Nowa Szczecin Poland - - - 35 0 5 103 91 23 835 500 26Nantong S.B. Nantong China P.R. - - 360 160 16 5 514 140 21 1,501 481 27Jiangnan S/Yard Shanghai China P.R. 3 2 232 41 128 7 388 127 23 1,090 472 28Namura Zosensho Imari Japan 1 - 450 114 213 12 896 239 18 2,538 456 29Odense Lindo Lindo Denmark 3 - 415 167 236 5 482 271 9 782 454 30Brod. Uljanik Pula Croatia - 2 225 139 113 5 132 127 20 664 453 31Waigaoqiao S/Y Shanghai China P.R. - - - 0 0 0 0 0 16 2,609 441 32Fincantieri Marghera Italy 1 2 340 85 188 1 7 105 4 29 420 33Sasebo H.I. Sasebo Japan 5 - 370 154 223 5 640 131 18 1,702 419 34Dalian Shipyard Dalian China P.R. 2 3 230 72 171 7 262 143 21 875 406 35Mitsui S.B. Tamano Japan 2 5 386 72 161 7 380 106 24 1,457 405 36Koyo Dock K.K. Mihara Japan 1 5 378 86 227 6 425 270 12 768 400 37* Capacity output is defined as (1) the largest vessel built at the yard in gross tons (2) the maximum annual output for each yard in CGT since 1991. All DWT, GT and CGTfigures in this table are in ,000's. Ranking of shipyards in the table are based on the current orderbook measured in CGT.Clarkson Research StudiesPage 16Jul-03
Shipyard Capacity (2)Shipbuilder….. Capacity* Output in Orderbook forShipyard…. Dock Berth Lgth gt cgt 2002 JuneNumber m. (,000) (,000) No. dwt cgt No. dwt cgt RankNew Century S/Y Jingjiang China P.R. - - - 31 0 8 335 114 23 1,234 389 38Sanoyas Mizushima Japan 1 - 675 75 177 9 592 173 19 1,541 385 39Guangzhou Shpyd Guangzhou China P.R. 3 3 200 29 90 4 129 71 19 683 355 40Shanghai Shpyd. Shanghai China P.R. - 2 228 30 49 5 217 76 18 716 334 41Mitsubishi H.I. Kobe Japan - 3 292 80 225 4 300 203 8 275 326 42Onomichi Dockyd Onomichi Japan - 1 260 58 156 9 499 169 17 895 314 43Meyer Werft Papenburg Germany 1 - 370 91 193 3 20 256 4 21 311 44Sumitomo H.I. Oppama Japan 1 - 560 261 282 5 440 157 14 1,228 297 45Imabari S.B. Saijo Japan 2 - 420 160 0 5 835 152 10 1,649 285 46Tsuneishi Cebu Cebu Philippines - - - 30 47 5 256 79 18 941 274 47Brod. Split Split Croatia - 4 269 82 113 6 282 122 12 1,088 274 48Kvaerner Masa Turku Finland 2 - 365 137 257 1 10 172 2 15 265 49Sestri-Cantiere Genoa Italy 2 - 285 101 147 1 7 61 2 22 253 50Jiangdu S/yard Yangzhou China P.R. - - - 25 0 2 64 29 14 590 251 51Iwagi Zosen Iwagi Japan - 1 136 32 71 4 143 54 13 641 242 52Bohai Shipyard Hu Lu Dao China P.R. - - 195 29 75 1 46 21 11 858 240 53Izar P. Real Puerto Real Spain - - - 93 0 0 0 0 3 233 238 54Minami Nippon Usuki Japan - 1 178 57 163 6 260 104 5 96 238 55Guang. Wenchong Huangpu China P.R. 3 1 300 18 41 4 88 55 17 422 229 56Kvaerner Masa Helsinki Finland 1 - 280 86 185 2 16 215 2 14 215 57Fincantieri CastellammareItaly - 2 240 59 96 2 30 97 4 39 209 58Volkswerft Stralsund Germany 2 - 300 34 77 5 168 96 10 280 202 59I.H.I. Yokohama Japan - - - 117 0 2 14 73 9 467 199 60Eisa Shipyard Rio De JaneiroBrazil - 2 280 38 67 0 0 0 9 510 181 61Lloyd Werft Bremerhaven Germany 3 - 335 78 98 0 0 0 2 12 180 62ISOICO Bandar Abbas Iran - - - 26 0 0 0 0 9 392 173 63National Steel San Diego United States 1 10 305 111 41 1 34 41 5 770 173 64Flensburger S.B Flensburg Germany - 1 270 31 80 4 57 85 7 73 171 65J. J. Sietas Hamburg Germany 2 2 150 18 114 13 165 124 16 214 163 66Shikoku Dock. Takamatsu Japan - 1 160 22 42 4 106 46 13 381 162 67Kanda Zosensho Kawajiri Japan 3 2 181 20 102 9 250 107 14 450 162 68Xiamen Shipyard Xiamen China P.R. - - - 23 5 3 104 52 8 322 159 69Izar Sestao Bilbao/Sestao Spain - - - 93 0 0 0 0 4 199 159 70Jinling Shipyd. Nanjing China P.R. - - - 27 49 4 70 67 11 265 157 71Brod. 3 Maj Rijeka Croatia - 2 260 58 64 3 96 56 8 318 153 72Xingang S.Y. Tianjin China P.R. 2 1 212 21 56 3 73 31 12 401 150 73Mitsubishi H.I. Shimonoseki Japan - 2 180 30 183 4 25 82 7 38 148 74Saiki Hvy. Ind. Saiki Japan - 2 155 24 78 6 164 72 9 338 147 75Admiralty S.Y. St. Petersburg Russia 2 2 240 33 41 2 40 20 8 324 145 76Naikai S.B. Setoda Japan 3 7 230 34 127 4 128 72 9 256 144 77Barreras S.A. Vigo Spain - 6 180 28 51 3 19 69 7 33 137 78Zhou Shan S/Y Zhoushan China P.R. - - - 17 0 3 13 13 16 181 134 79Aker MTW Werft Wismar Germany 1 - 340 67 112 5 140 135 7 238 131 80Kv. Warnowwerft Warnemunde Germany 1 - 320 67 136 4 135 77 7 236 129 81Aker Finnyards Rauma Finland 1 - 250 50 62 4 12 130 2 32 123 82Imabari S.B. Imabari Japan - 1 247 53 106 5 125 55 10 256 121 83Lindenau Kiel Germany 2 1 185 22 25 2 67 35 7 230 121 84Usuki Zosensho Usuki Japan 3 - 180 19 31 5 66 50 10 184 120 85Zhejiang S/Yard Ningbo China P.R. - - - 4 11 2 31 23 11 293 120 86Watanabe Zosen Hakata Japan 1 2 160 30 41 3 26 28 10 187 117 87Stocznia Gdansk Gdansk Poland - 6 280 33 88 5 160 95 7 226 109 88Chengxi Shipyd. Jiangyin China P.R. - - - 7 5 1 8 10 7 343 108 89Universal S.B. Maizuru Japan - - - 39 0 1 70 22 5 355 106 90Jurong S/Yard Tanjong Kling Singapore 1 4 330 52 57 4 59 52 5 154 105 91Bender S.B. Mobile United States 3 9 251 9 27 3 9 22 14 59 103 92Jiangsu S/Yard Yangzijiang China P.R. - - - 18 11 6 90 54 9 156 102 93Chernomorskiy Nikolayev Ukraine - 2 289 32 66 1 45 25 4 182 100 94Weihai S/yard Weihai China P.R. - - - 13 11 0 0 0 11 148 100 95Hakodate Dock Hakodate Japan 2 1 184 128 55 5 193 65 9 288 99 96Volharding Eemshaven Netherlands - - - 8 0 6 45 40 11 118 97 97Varna Shipyard Varna Bulgaria 2 - 237 57 61 0 0 0 8 184 95 98Qingshan S.Y. Wuhan China P.R. - - - 12 19 2 24 18 14 114 91 99Peene Werft Wolgast Germany 1 - 165 14 30 4 71 51 7 129 90 100Vianayard Viana Castelo Portugal - 2 203 18 50 2 23 20 5 61 90 101Wuhu Shipyard Wuhu China P.R. - - 120 19 46 2 54 26 11 103 89 102* Capacity output is defined as (1) the largest vessel built at the yard in gross tons (2) the maximum annual output for each yard in CGT since 1991. All DWT, GT and CGTfigures in this table are in ,000's. Ranking of shipyards in the table are based on the current orderbook measured in CGT.Clarkson Research StudiesPage 17Jul-03
Shipyard Capacity (3)Shipbuilder….. Capacity* Output in Orderbook forShipyard…. Dock Berth Lgth gt cgt 2002 JuneNumber m. (,000) (,000) No. dwt cgt No. dwt cgt RankDamen Galati Galatz Romania - - - 24 11 3 67 38 12 111 88 103NG Avondale New Orleans United States - - - 85 0 2 176 79 3 425 88 104Schps. Bodewes Hoogezand Netherlands - - - 5 14 3 22 20 16 88 85 105Brod. Trogir Trogir Croatia 1 2 200 28 78 2 57 30 4 190 85 106Kitanihon Zosen Hachinohe Japan 2 - 140 19 53 3 54 43 6 146 84 107Jiangdong S/Y Wuhu China P.R. - - - 10 17 2 18 13 10 128 83 108Fincantieri Palermo Italy 6 - 286 59 46 0 0 0 2 50 82 109Jiangzhou S/Y Jiangxi China P.R. - - - 9 36 2 16 15 11 101 79 110Visentini Donada Italy 1 3 190 40 36 2 15 53 3 21 79 111Peters Schpsw. Kampen Netherlands - 4 110 3 15 3 14 14 17 68 76 112Shin Kochi H.I. Kochi City Japan - 2 168 19 72 7 73 49 7 158 74 113Fukuoka S.B. Fukuoka Japan - 1 110 12 59 5 65 42 7 107 72 114Hellenic S/Yard Skaramanga Greece - - - 21 0 0 0 0 2 4 72 115Kouan S.B. Taizhou China P.R. - - - 18 0 2 51 31 6 147 72 116Soc. Esercizio Viareggio Italy - 5 180 21 23 0 0 0 6 93 72 117Shin Kurushima Akitsu Japan - 2 131 17 111 5 98 61 6 105 71 118Damen Okean Nikolayev Ukraine - - - 10 0 0 0 0 10 88 69 119Izar Sevilla Seville Spain - - - 24 0 1 6 25 2 6 65 120Kyokuyo S/yard Shimonoseki Japan 1 - 134 22 46 4 34 38 8 95 64 121Volharding Harlingen Netherlands - - - 12 0 0 0 0 8 82 63 122Vulcano S.A. Vigo Spain - 2 158 14 24 1 17 12 4 70 59 123Jingjiang Sumec Jingjiang China P.R. - - - 7 0 1 6 5 9 78 58 124Itajai Shipyard Itajai Brazil - - 120 6 0 0 0 0 5 65 56 125Celiktekne Tuzla Turkey - - - 11 17 3 23 21 8 65 54 126Severnaya S.B. St. Petersburg Russia - 4 170 16 17 1 5 7 8 40 54 127Cant. Orlando Leghorn Italy - 2 140 24 38 0 0 0 2 27 53 128Krasnoy Sormovo Gorkiy Russia - - - 6 20 0 0 0 8 67 53 129Shanghai Edward Shanghai China P.R. - - 170 12 22 3 44 31 5 66 50 130ABG Shipyard Surat India - - - 6 8 1 1 6 12 10 46 131Braila Shipyard Braila Romania - 2 135 8 17 0 0 0 7 39 46 132Higaki Zosen Imabari Japan - 3 110 9 80 8 63 59 8 65 46 133Avondale Ind. New Orleans United States 2 3 900 85 59 0 0 0 1 34 45 13461 Kommunar Nikolayev Ukraine 1 3 134 14 41 0 0 0 4 38 45 135Rousse Shipyard Rousse Bulgaria - 12 138 4 6 2 9 8 11 50 45 136Dong Feng S/Y Hangzhou China P.R. - - - 0 0 0 0 0 8 101 44 137Jiangyang S.Y. Yangzhou China P.R. - - - 41 31 0 0 0 3 139 44 138Dae Sun S.B. Pusan South Korea - 3 173 9 21 4 37 36 5 45 44 139Kvaerner Phil. Philadelphia United States - - - 29 0 0 0 0 2 60 44 140Shanhaiguan S/Y Shanhaiguan China P.R. - - - 14 0 0 0 0 5 120 43 141Volgograd S.Y. Volgograd Russia - - 129 5 11 3 20 16 7 47 43 142North American Larose United States - - 80 4 42 4 17 34 6 26 42 143Fjellstrand A/S Omastrand Norway - - - 4 0 0 0 0 3 2 42 144Atsalakis S/Y Perama Greece - - - 7 0 0 0 0 2 3 42 145FELS-Setal Angra Dos Rei Brazil - - - 3 0 0 0 0 5 17 42 146Kraljevica Kraljevica Croatia - 3 125 15 0 0 0 0 5 37 42 147Cant. De Poli Venice Italy - - 130 12 15 1 17 12 6 44 42 148Asakawa S.B. Imabari Japan 1 - 125 10 28 4 55 33 4 49 41 149Kleven Floroe Floroe Norway - - - 33 0 2 80 42 2 80 40 150Okean Shipyard Nikolayev Ukraine 1 - 225 63 47 0 0 0 2 138 39 151Naval Gijon Gijon Spain 1 - 165 24 25 1 35 19 2 70 39 152Mutzelfeldt Cuxhaven Germany - - 100 10 16 0 0 0 4 58 38 153Bollinger S.Y. Lockport United States - - 58 3 6 6 4 15 7 15 38 154Rolandwerft Bremen Germany - - 115 10 33 2 17 15 3 14 38 155VT Halter Pascagoula United States - - - 0 0 0 0 0 1 13 37 156Daewoo-Mangalia Mangalia Romania - - - 16 5 0 0 0 4 38 37 157Zhonghua S/Yard Shanghai China P.R. - 2 107 22 45 3 31 41 3 34 37 158P.T. PAL Indon. Surabaya Indonesia 7 - - 26 31 1 45 16 3 94 35 159Yantai Raffles Yantai China P.R. - - - 30 0 2 2 12 5 20 34 160Bohai Sembawang Tianjin China P.R. - - - 20 0 0 0 0 2 58 34 161Est. Promar Rio De JaneiroBrazil - - - 2 0 1 3 6 5 17 34 162Shin Kurushima Hashihama Japan - 1 268 75 21 4 32 32 4 33 34 163Others 1,968 151 98,653 1,403 278 1,745 1,732TOTAL 20,045 897 45,385 19,301 2,454 134,885 55,382* Capacity output is defined as (1) the largest vessel built at the yard in gross tons (2) the maximum annual output for each yard in CGT since 1991. All DWT, GT and CGTfigures in this table are in ,000's. Ranking of shipyards in the table are based on the current orderbook measured in CGT.Clarkson Research StudiesPage 18Jul-03
2.001.751.501.251.000.750.500.250.00m. dwt19931994Trends of Losses at Sea19951996TankersGasCombos199719981999<strong>Vessel</strong>s Lost At Sea<strong>Bulk</strong>ersContainerOther20002001Source: Clarkson Research Studies20022003Summary• The 1980-built, 6,505 dwt “FORTUNE CARRIER”sank in the mouth of the Hooghly River atCalcutta/Kolcata, releasing part of its cargo of 1,700 giantlogs. Several are believed to have pierced the ship’s side,and both ship and logs pose a danger to shipping. The crewwere rescued by army hovercraft. There was no report ofpollution.• The 1977-built, 71,733 dwt bulker“PANTOKRATOR” blocked the port of Barranquilla inColumbia after grounding on a sandbank in the RiverMagdalena. Water in the navigation channel fell to 26 ftfollowing a build up of silt. The “PANTOKRATOR”draws 32 ft. Local tugs have been unable to remove her,and a salvage specialist has been sent for.• The forward section of the 1978-built 57,375 dwtProduct Carrier “EFXINOS” exploded after a ship-to-shipcargo transfer operation with the 1993 built 279,986 dwtVLCC “SEBU”. Four men died, and two are missing. Nopollution has been reported.<strong>Bulk</strong> <strong>Vessel</strong>Losses2000 2001 2002 Jun* 2000 2001 2002 Jun* 2000 2001 2002 Jun*VLCC > 200,000 0 1 0 0 0 24 0 0 0 122 0 0Suezmax 120-200,000 0 0 0 0 0 0 0 0 0 0 0 0Aframax 80-120,000 0 0 1 1 0 0 26 14 0 0 43 53Panamax 60-80,000 0 0 0 0 0 0 0 0 0 0 0 0Products 10-60,000 1 2 0 0 22 31 0 0 11 26 0 0Chemical 10-60,000 0 0 0 0 0 0 0 0 0 0 0 0Specialised 10-60,000 0 0 0 0 0 0 0 0 0 0 0 0Tankers > 10,000 1 3 1 1 22 28 26 14 11 148 43 53Tankers < 10,000 3 3 0 0 11 17 0 0 11 13 0 0Capesize > 80,000 2 2 0 0 21 16 0 0 137 161 0 0Panamax 60-80,000 2 1 2 1 20 17 19 8 79 35 69 39Handymax 40-60,000 1 1 1 0 17 24 18 0 32 31 25 0Handysize 10-40,000 9 2 0 1 20 17 0 21 138 39 0 7<strong>Bulk</strong>ers > 10,000 14 6 3 2 20 18 18 14 385 267 94 46Combos > 10,000 0 0 0 0 0 0 0 0 0 0 0 0Total <strong>Bulk</strong> <strong>Vessel</strong>s 18 12 4 3 18 20 20 14 407 427 137 98Special <strong>Vessel</strong>LossesAverage Age2000 2001 2002 Jun* 2000 2001 2002 Jun* 2000 2001 2002 Jun*LNG Carriers 0 0 0 0 0 0 0 0 0 0 0 0LPG Carriers 0 0 0 0 0 0 0 0 0 0 0 0Reefers 3 5 0 0 14 25 0 0 12 24 0 0Containers > 3,000 teu 0 0 0 0 0 0 0 0 0 0 0 0Containers < 3,000 teu 0 0 1 0 0 0 6 0 0 0 6 0Other Dry > 5,000 dwt 9 5 9 5 19 17 20 24 77 52 160 86Offshore & Others 5 4 5 2 28 22 24 14 5 12 14 4Cruise <strong>Vessel</strong>s 0 0 0 0 0 0 0 0 0 0 0 0Ro-Ro Ferries 0 0 0 0 0 0 0 0 0 0 0 0Total Special <strong>Vessel</strong>s 17 14 15 7 21 21 21 21 94 88 180 90Total All LossesNo. of <strong>Vessel</strong>sNo. of <strong>Vessel</strong>sNo. of <strong>Vessel</strong>sAverage AgeAverage Age,000 GT,000 GT,000 GT2000 2001 2002 Jun* 2000 2001 2002 Jun* 2000 2001 2002 Jun*All <strong>Vessel</strong>s Types 35 26 19 10 20 21 20 19 501 516 317 188* denotes data for year to date.Clarkson Research StudiesPage 19Jul-03
12.010.08.06.04.02.00.0<strong>Bulk</strong> <strong>Vessel</strong>DemolitionDemolition Sales by <strong>Vessel</strong> Type2002 Jun* 2002 Jun* 1999 2000 2001 2002 Jun* 2003 2004VLCC > 200,000 33 18 26.0 27.0 9.9 7.1 8.6 10.9 5.9 7.0 6.7Suezmax 120-200,000 11 8 26.0 25.0 3.1 2.5 4.0 1.6 1.1 2.3 1.7Aframax 80-120,000 17 13 25.0 26.0 2.5 1.7 1.4 1.5 1.2 2.4 1.6Panamax 60-80,000 6 5 25.0 28.0 0.2 0.3 0.4 0.4 0.3 1.1 0.3Products 10-60,000 68 34 27.0 29.0 0.7 2.2 1.0 2.3 1.1 2.5 2.3Chemical 10-60,000 10 6 27.0 30.0 0.1 0.1 0.1 0.3 0.2 0.1 0.2Specialised 10-60,000 2 1 43.0 25.0 0.0 0.0 0.1 0.1 0.0 0.1 0.1Tankers > 10,000 147 85 26.0 28.0 16.5 13.9 15.5 17.0 9.7 15.5 12.9Tankers < 10,000 20 17 29.0 31.0 0.0 0.0 0.0 0.1 0.1 0.1 0.0Capesize > 80,000 10 2 26.0 25.0 3.0 1.0 1.6 1.3 0.2 0.8 1.6Panamax 60-80,000 22 2 24.0 26.0 1.5 0.2 2.1 1.4 0.1 1.6 1.8Handymax 40-60,000 10 3 25.0 26.0 1.6 0.8 0.7 0.5 0.1 1.1 1.6Handysize 10-40,000 92 38 26.0 26.0 3.0 2.3 3.4 2.4 1.1 3.4 4.9<strong>Bulk</strong>ers > 10,000 134 45 26.0 26.0 9.1 4.3 7.8 5.6 1.5 6.9 9.9Combos > 10,000 12 5 24.0 22.0 1.0 0.6 0.8 1.2 0.5 0.5 0.2Total <strong>Bulk</strong> <strong>Vessel</strong>s 313 152 26.0 27.0 26.5 18.8 24.3 24.0 11.9 23.0 23.0Special <strong>Vessel</strong>Demolition2002 Jun* 2002 Jun* 1999 2000 2001 2002 Jun* 2003 2004LNG Carriers 0 0 0.0 0.0 0.0 0.0 0.0 0.0 0.0 0.0 0.0LPG Carriers 23 12 29.0 29.0 0.1 0.1 0.0 0.5 0.2 0.3 0.3Reefers 14 10 26.0 33.0 0.4 0.2 0.1 0.1 0.0 0.2 0.2Containers > 3,000 teu 1 1 29.0 1.0 0.0 0.0 0.1 0.0 0.1 0.1 0.1Containers < 3,000 teu 49 14 25.0 26.0 0.9 0.2 0.5 1.1 0.3 0.7 0.8Other Dry > 5,000 dwt 118 50 25.0 25.0 2.1 2.4 2.5 2.0 0.8 2.3 2.4Offshore & Others 13 10 29.0 28.0 0.5 0.4 0.1 0.4 0.0 2.3 2.4Cruise <strong>Vessel</strong>s 2 0 47.0 0.0 0.0 0.0 0.0 0.0 0.0 0.0 0.0Ro-Ro Ferries 5 0 26.0 0.0 0.0 0.0 0.0 0.0 0.0 0.3 0.3Total Special <strong>Vessel</strong>s 225 97 26.0 27.0 4.0 3.3 3.4 4.1 1.6 6.2 6.5TotalDemolitionQuarterly Demolitions (DWT)Tankers <strong>Bulk</strong>ers GasContainer Other4Q952Q964Q962Q974Q972Q984Q982Q994Q992Q004Q002Q014Q012Q024Q022Q03Source: Clarkson Research StudiesNo. end Average Age m. DWT, end:Forecast DemolitionNo. end Average Age m. DWT, end: Forecast DemolitionNo. end Average Age m. DWT, end: Forecast Demolition2002 Jun* 2002 Jun* 1999 2000 2001 2002 Jun* 2003 2004All <strong>Vessel</strong>s Types 538 249 26.0 27.0 30.6 22.1 27.6 28.1 13.5 29.2 29.5*after a month indicates data are the latest year to date figures. Average age is based on number of ships.Summary• So far this year 5.7m dwt of cargo vessels have beensold for demolition. The rate of scrapping has been kept ata low level by the generally firm freight markets in allsectors. India has declared that the gas-free clause will berigorously enforced. This has led to more ships going toChina, and a shortage of vessels for India. Owners are nowselling tankers to cash intermediaries, who take on the riskof “gas freeing” the ship.• Tanker rates, especially for VLCCs and Aframaxes,have been volatile during April. In the VLCC market therewas a suspicion that the rate correction may lastthroughout the summer. Scrap prices have been very firm,and it was natural that any owners contemplatingdemolition would take advantage of these prices.• In some cases the timing appears to be almostprefect. Hellespont was due to take delivery of a newULCC to replace an elderly turbine engine single hullVLCC. The replacement has arrived into a firm tankermarket, and the old ship was sold in a firm demolitionmarket.Clarkson Research Studies Page 20 Jul-03
Demolition Sales by <strong>Vessel</strong> Type<strong>Bulk</strong> <strong>Vessel</strong>Demolition 1995 1996 1997 1998 1999 2000 2001 2002 Jun* 2003 2004VLCC > 200,000 3.6 1.7 1.0 2.0 4.7 3.4 4.1 5.3 2.8 3.4 3.2Suezmax 120-200,000 0.6 0.5 0.1 0.7 1.6 1.3 2.0 0.8 0.6 1.2 0.9Aframax 80-120,000 0.3 0.3 0.4 0.1 1.3 0.9 0.8 0.8 0.6 1.3 0.9Panamax 60-80,000 0.1 0.0 0.0 0.1 0.1 0.1 0.2 0.2 0.2 0.6 0.2Products 10-60,000 0.7 0.3 0.2 0.2 0.4 1.3 0.6 1.3 0.6 1.4 1.3Chemical 10-60,000 0.0 0.1 0.0 0.0 0.1 0.1 0.0 0.2 0.1 0.1 0.1Specialised 10-60,000 0.0 0.0 0.0 0.0 0.0 0.0 0.0 0.0 0.0 0.1 0.1Tankers > 10,000 5.4 2.9 1.8 3.3 8.2 7.1 7.7 8.7 5.0 8.1 6.6Tankers < 10,000 0.0 0.0 0.0 0.0 0.0 0.0 0.0 0.1 0.1 0.1 0.0Capesize > 80,000 0.4 1.5 1.6 2.0 1.6 0.5 0.8 0.7 0.1 0.4 0.8Panamax 60-80,000 0.1 0.5 0.7 1.1 0.8 0.1 1.2 0.8 0.1 0.9 1.0Handymax 40-60,000 0.1 1.0 0.6 0.9 1.0 0.5 0.4 0.3 0.1 0.7 1.0Handysize 10-40,000 0.3 1.1 1.5 2.6 1.8 1.4 2.1 1.5 0.6 2.1 3.0<strong>Bulk</strong>ers > 10,000 0.9 4.0 4.4 6.7 5.2 2.5 4.5 3.3 0.9 4.1 5.9Combos > 10,000 0.9 1.2 0.4 1.0 0.5 0.4 0.5 0.7 0.3 0.3 0.1Total <strong>Bulk</strong> <strong>Vessel</strong>s 7.3 8.2 6.6 11.0 13.9 10.0 12.7 12.7 6.3 12.5 12.6Special <strong>Vessel</strong>Demolition 1995 1996 1997 1998 1999 2000 2001 2002 Jun* 2003 2004LNG Carriers 0.0 0.0 0.0 0.0 0.0 0.0 0.0 0.0 0.0 0.0 0.0LPG Carriers 0.0 0.0 0.1 0.0 0.1 0.1 0.0 0.4 0.2 0.3 0.3Reefers 0.2 0.2 0.1 0.2 0.4 0.2 0.1 0.1 0.0 0.2 0.2Containers > 3,000 teu 0.0 0.0 0.0 0.3 0.1 0.1 0.1 0.1 0.0 0.1 0.1Containers < 3,000 teu 0.2 0.4 0.4 1.3 0.8 0.2 0.5 1.1 0.3 0.7 0.8Other Dry > 5,000 dwt 0.5 1.2 1.7 1.6 1.5 1.9 1.9 1.6 0.6 1.8 1.9Offshore <strong>Vessel</strong>s 0.0 0.0 0.0 0.0 0.0 0.0 0.0 0.0 0.0 0.0 0.0Cruise <strong>Vessel</strong>s 0.0 0.0 0.1 0.0 0.0 0.0 0.0 0.0 0.0 0.0 0.0Ro-Ro Ferries 0.0 0.0 0.0 0.0 0.0 0.0 0.0 0.0 0.0 0.0 0.0Total Special <strong>Vessel</strong>s 0.9 1.8 2.4 3.4 2.9 2.4 2.7 3.2 1.3 3.1 3.3TotalMillion GTMillion GTMillion GTDemolition 1995 1996 1997 1998 1999 2000 2001 2002 Jun* 2003 2004All <strong>Vessel</strong>s Types 8.1 10.0 8.9 14.4 16.8 12.4 15.4 15.9 7.5 15.6 15.9* denotes data for year to date.Recent Ship Sales for DemolitionDate Type <strong>Vessel</strong> Name Flag Dwt Ldt Blt. Owner Breaker $/ldt $m.Jun-03 VLCC Tai Hung San SG. 233,759 34,269 1976 Ocean Tankers Pte. BangladeshJun-03 VLCC Folk II SA. 457,927 62,595 1978 Oceanic Trans Shpg. PRC 228.00 14.27Jun-03 VLCC Tian San SG. 357,127 42,363 1976 Ocean Tankers Pte. PRC 223.00 9.45Jun-03 Suezmax Miltiadis I M.I. 155,250 21,476 1976 Barclay Shpg. Ltd. Bangladesh 225.00 4.83Jun-03 Handy Prod Patriot PA. 37,410 7,489 1975 Ionia Mgmt. S.A. India 225.00 1.69Jun-03 Handy Prod Ray IT. 34,330 10,439 1975 Fullship S.r.l. India 230.00 2.40Jun-03 Handy Prod Tilemachos BS. 59,642 11,930 1976 Barclay Shpg. Ltd. India 228.00 2.72Jun-03 Handy Prod Fenerbahce I TU. 37,035 7,485 1976 Besiktas Denizcilik India 229.00 1.71Jun-03 Handy Prod Mormacsun AM. 39,862 8,427 1976 Marine Transport India 180.00 1.52Jun-03 Small/Spec Eltokaween PA. 8,697 2,631 1969 Cooke Navigation Ltd India 107.00 0.28Jun-03 Small/Spec Nikolas BL. 3,384 1972 Unknown Owner PakistanJun-03 5K DWHelikon TH. 20,717 1977 Thoresen & Co.Jun-03 Mapleglen CA. 26,214 7,450 1960 Parrish & Heimbecker UnknownForecast DemolitionForecast DemolitionForecast DemolitionClarkson Research Studies Page 21Jul-03
Oil TankerFleetFleet ForecastsNumbers, end m. DWT, end Forecast1999 2000 2001 2002 Jun* 1999 2000 2001 2002 Jun* 2003 2004Orderbook (end period) 308 411 585 656 758 37.5 50.7 61.8 58.9 69.3New Orders 104 283 300 276 257 12.0 34.7 25.2 20.8 25.5Newbuildings Delivered 210 180 127 206 155 20.2 21.4 14.2 23.7 15.1 31.7 25.1Sold for Scrap 116 145 116 147 85 16.5 13.9 15.5 17.0 9.7 15.5 12.9Losses 1 1 3 1 1 0.0 0.0 0.3 0.1 0.1 0.1Miscellaneous Additions 4 4 0.3 0.4Miscellaneous Removals 3 8 2 0.1 1.0 0.1 0.1Total Tanker Fleet 3,410 3,437 3,430 3,473 3,536 289.0 296.4 292.0 296.1 300.7 311.6 323.7% change 2.7% 0.8% -0.2% 1.3% 1.8% 1.2% 2.6% -1.5% 1.4% 1.6% 5.2% 3.9%of which:VLCC >200,000 425 441 428 428 428 123.8 129.0 125.7 125.2 125.0 129.3 131.5% change -0.9% 3.8% -2.9% -0.7% 4.2% -2.5% -0.4% -0.2% 3.4% 1.7%Suezmax 120-200,000 287 291 275 286 289 41.3 42.1 40.1 42.0 42.7 44.4 46.0% change -2.7% 1.4% -5.5% 4.0% 1.0% -2.0% 2.1% -4.7% 4.8% 1.5% 4.2% 3.5%Aframax 80-120,000 549 553 552 569 590 52.3 52.9 53.0 55.1 57.5 60.1 63.4% change 3.8% 0.7% -0.2% 3.1% 3.7% 4.9% 1.0% 0.2% 4.0% 4.5% 4.5% 5%Panamax 60-80,000 207 219 216 219 226 13.8 14.6 14.4 14.6 15.1 15.3 17.7% change 3.0% 5.8% -1.4% 1.4% 3.2% 3.0% 6.0% -1.6% 1.5% 3.5% 1.3% 15.5%Handy 10-60,000 1,942 1,933 1,959 1,971 2,003 57.9 57.9 58.8 59.1 60.4 62.4 65.2% change 4.1% -0.5% 1.3% 0.6% 1.6% 4.3% 0.0% 1.6% 0.5% 2.1% 3.3% 4.5%<strong>Bulk</strong> CarrierFleetNumbers, end m. DWT, end Forecast1999 2000 2001 2002 Jun* 1999 2000 2001 2002 Jun* 2003 2004Orderbook (end period) 462 533 369 442 521 33.4 35.3 24.3 30.3 37.0New Orders 331 252 145 296 169 22.8 15.1 9.5 20.1 12.4Newbuildings Delivered 198 184 310 223 90 12.7 13.3 20.5 14.1 5.8 11.4 15.0Sold for Scrap 198 115 188 134 45 9.1 4.3 7.8 5.6 1.5 6.9 9.9Losses 6 14 6 3 2 0.2 0.7 0.5 0.2 0.1 0.1Miscellaneous Additions 3 0.3Miscellaneous Removals 4 9 3 0.1 0.3 0.1Total <strong>Bulk</strong> Carrier Fleet 5,337 5,379 5,490 5,567 5,607 267.3 275.1 287.1 295.1 299.2 299.5 304.6% change -0.2% 0.8% 2.1% 1.4% 0.7% 1.2% 2.9% 4.3% 2.8% 1.4% 1.5% 1.7%of which:Capesize >80,000 527 558 576 591 602 82.5 87.3 90.7 93.5 95.5 97.1 101.1% change -0.2% 5.9% 3.2% 2.6% 1.9% 1.5% 5.8% 3.9% 3.1% 2.2% 1.7% 4.1%Panamax 60-80,000 901 949 1,028 1,059 1,067 62.2 65.8 72.0 74.5 75.2 74.6 77.1% change 4.9% 5.3% 8.3% 3.0% 0.8% 5.5% 5.8% 9.3% 3.5% 0.8% -0.8% 3.3%Handy 40-60,000 993 1,013 1,098 1,173 1,207 45.2 46.1 50.4 54.2 56.0 56.7 58.5% change 0.5% 2.0% 8.4% 6.8% 2.9% 0.4% 2.0% 9.4% 7.6% 3.3% 1.3% 3.1%Handysize 10-40,000 2,916 2,859 2,788 2,744 2,731 77.4 75.9 74.0 72.9 72.6 71.1 67.9% change -1.9% -2.0% -2.5% -1.6% -0.5% -1.7% -1.9% -2.5% -1.5% -0.5% -2.0% -4.5%CombinedCarrier FleetNumbers, end m. DWT, end Forecast1999 2000 2001 2002 Jun* 1999 2000 2001 2002 Jun* 2003 2004Orderbook (end period) - - 2 2 1 - - 0.2 0.2 0.1New Orders - - 2 - - - - 0.2 - -Newbuildings Delivered 4 - - - 1 0.4 - - - 0.1 0.2 -Sold for Scrap 8 6 8 12 5 1.0 0.6 0.8 1.2 0.5 0.5 0.2Losses - - - - - - - - - - -Miscellaneous Additions - - - 1 - - - - 0.1 -Miscellaneous Removals - - - 3 - - - - 0.4 -Total Combined Fleet 147 141 133 120 116 14.8 14.2 13.4 12.0 11.6 11.8 11.6% change -3% -4% -6% -10% -3% -4% -4% -6% -10% -4% -2.1% -1.7%LNG CarrierFleetNumbers, end m. cbm., end Forecast1999 2000 2001 2002 Jun* 1999 2000 2001 2002 Jun* 2003 2004Orderbook (end period) 18 26 47 56 55 2.3 3.4 6.3 7.4 7.3New Orders 5 20 22 19 3 0.7 2.6 3.0 2.5 0.4Newbuildings Delivered 7 12 1 10 4 1.0 1.5 0.1 1.4 0.6 2.0 2.8Sold for Scrap - 1 - - - - 0.0 - - - - -Losses - - - - - - - - - - -Miscellaneous Additions - - - - - - - - - -Miscellaneous Removals - - - - - - - - - -Total LNG Fleet 117 128 129 139 143 12.7 14.2 14.3 15.7 16.3 17.8 20.6% change 9.4% 0.8% 7.8% 2.9% 12.0% 1.0% 9.6% 3.5% 13.0% 15.9%N.B. All dwt measurements/size categories are now in metric tonnes. * orders, deliveries, scrapping, losses etc. are for the year to end of month indicated.Clarkson Research Studies Page 22Jul-03
LPG CarrierFleetFleet ForecastsNumbers, end m. cbm., end Forecast1999 2000 2001 2002 Jun* 1999 2000 2001 2002 Jun* 2003 2004Orderbook (end period) 41 45 51 41 42 1.1 1.3 1.5 1.5 1.5New Orders 14 34 36 14 14 0.2 0.8 0.9 0.4 0.5Newbuildings Delivered 30 30 30 24 13 0.4 0.6 0.7 0.5 0.5 1.1 0.4Sold for Scrap 9 10 7 23 12 0.1 0.1 0.1 0.7 0.3 0.3 0.4Losses 1 0.0Miscellaneous AdditionsMiscellaneous Removals 3 0.0Total LPG Fleet 944 963 986 983 984 12.9 13.5 14.1 13.9 14.0 14.7 14.7% change 2.1% 2.0% 2.4% -0.3% 0.1% 2.6% 4.0% 4.6% -1.6% 0.8% 5.8% 0.2%of which:> 60,000 cbm 93 98 105 103 104 7.2 7.6 8.1 8.0 8.1 8.7 8.8% change 3.3% 5.4% 7.1% -1.9% 1.0% 3.5% 5.5% 7.4% -1.5% 1.3% 7.9% 1.3%20-60,000 cbm 77 81 80 78 78 2.8 2.9 2.9 2.8 2.8 3.1 3.3% change -1.3% 5.2% -1.2% -2.5% -0.5% 2.0% -0.9% -3.9% 0.8% 11.8% 5.5%8-20,000 cbm 88 89 88 90 91 1.1 1.1 1.1 1.1 1.1 1.0 0.9% change 2.3% 1.1% -1.1% 2.3% 1.1% 2.4% 0.8% -0.8% -0.4% 0.1% -6.2% -12%< 8,000 cbm 686 695 713 712 711 1.9 1.9 2.0 2.0 2.0 1.9 1.7% change 2.2% 1.3% 2.6% -0.1% -0.1% 4.3% 2.8% 4.7% 0.8% -0.4% -6.1% -8.3%ContainershipFleetNumbers, end m. TEU, end Forecast1999 2000 2001 2002 Jun* 1999 2000 2001 2002 Jun* 2003 2004Orderbook (end period) 278 421 413 340 427 0.9 1.4 1.4 1.1 1.6New Orders 155 300 180 129 175 0.6 1.0 0.5 0.4 0.7Newbuildings Delivered 128 157 188 202 88 0.3 0.4 0.6 0.6 0.3 0.6 0.6Sold for Scrap 49 12 29 50 15 0.1 0.0 0.0 0.1 0.0 0.1 0.1Losses 3 1 0.0 0.0Miscellaneous AdditionsMiscellaneous Removals 3 2 1 0.0 0.0 0.0Total Containership Fleet 2,604 2,748 2,903 3,051 3,123 4.4 4.8 5.4 6.0 6.2 6.5 7.0% change 2.9% 5.5% 5.6% 5.1% 2.4% 4.9% 9.8% 12.1% 10.6% 4.2% 8.3% 8.5%of which:Post-P' max 4,000 &+ teu 104 138 201 246 266 0.6 0.8 1.1 1.4 1.5 1.6 1.9% change 15.6% 32.7% 45.7% 22.4% 8.1% 17.8% 35.2% 47.7% 24.1% 9.0% 16.9% 16.6%Panamax 3,000 &+ teu 342 365 382 425 443 1.3 1.4 1.4 1.6 1.7 1.8 2.0% change 2.4% 6.7% 4.7% 11.3% 4.2% 2.8% 7.8% 4.8% 12.6% 4.3% 8.7% 11.3%Handymax 2-2,999 teu 380 401 441 473 485 0.9 1.0 1.1 1.2 1.2 1.3 1.3% change 5.0% 5.5% 10.0% 7.3% 2.5% 4.8% 5.4% 10.1% 7.4% 2.7% 7.6% 4.4%Handy 1-1,999 teu 795 837 874 893 903 1.1 1.2 1.2 1.3 1.3 1.3 1.3% change 2.4% 5.3% 4.4% 2.2% 1.1% 2.9% 5.9% 4.4% 2.4% 1.1% 1.5% 0.3%Feeders < 1,000 teu 983 1,007 1,005 1,014 1,026 0.5 0.5 0.5 0.5 0.5 0.6 0.6% change 1.4% 2.4% -0.2% 0.9% 1.2% 2.0% 3.3% 0.3% 2.0% 1.6% 2.4% 1.7%ReeferFleetNumbers, end m. Cu.ft, end Forecast1999 2000 2001 2002 Jun* 1999 2000 2001 2002 Jun* 2003 2004Orderbook (end period) 20 12 8 8 8 9.3 5.2 3.9 3.1 3.1New Orders 4 4 - 2 - 1.2 1.5 0.4Newbuildings Delivered 22 12 4 2 - 10.0 5.6 1.3 1.3 2.2 0.7Sold for Scrap 54 17 14 14 10 17.4 6.6 4.5 4.9 2.0 0.5 0.2Losses 1 3 5 - - 0.0 0.6 1.1Miscellaneous Additions - - - - -Miscellaneous Removals - - 6 3 - 1.7 0.8Total Reefer Fleet 1,356 1,341 1,320 1,305 1,295 363.9 361.4 355.5 351.0 349.0 352.7 353.3% change -1% -2% -1% -1% -1% -2% -1% -1% 0.5% 0.2%Other Dry*Fleet >5,000 dwtNumbers, end m. DWT, end Forecast1999 2000 2001 2002 Jun* 1999 2000 2001 2002 Jun* 2003 2004Orderbook (end period) 256 206 196 208 249 3.2 2.9 2.7 2.9 3.2New Orders 100 123 83 102 78 1.1 1.8 0.9 1.4 0.9Newbuildings Delivered 156 174 94 90 37 1.8 2.1 1.1 1.2 0.6 1.7 1.2Sold for Scrap 141 164 156 118 50 2.1 2.4 2.5 2.0 0.8 2.3 2.4Losses 11 9 5 9 5 0.1 0.1 0.1 0.1 0.0 0.0Miscellaneous Additions - - 5 - - 0.2Miscellaneous Removals - - 9 - 39 0.2 0.4Total Other Dry Cargo Fleet 3,793 3,783 3,707 3,651 3,594 48.7 48.2 46.5 45.4 44.7 44.3 43.2% change -0.3% -2.0% -1.5% -1.6% -1.0% -3.4% -2.4% -1.5% -2.3% -2.6%* other dry fleet includes Multi-purpose, General Cargo Tramps and Liners and Ro-Ro vessels.Clarkson Research StudiesPage 23Jul-03
Shipbuilding FocusIce class – the next tanker opportunity?In September 1969 the 111,000 dwt1962-built crude oil tanker“MANHATTAN”, had to be rescuedfrom heavy polar ice by icebreakersduring an attempt to force a waythrough the Northwest Passage. Sheeventually reached the North Slope ofAlaska and loaded a symbolic singlebarrel of crude in Prudhoe Bay.The voyage showed that even with a43,000hp specially reinforced tanker,the need for icebreakers meantNorthwest Passage was not a commerciallyviable route for Alaskan oil.The decision was taken to pipe the oiloverland to Prince William Sound inthe south of Alaska.Arctic OilbergSimilar decisions are being taken todayover how best to exploit the hugeoil reserves of the Russian Arctic.Russian Arctic hypothetical recoverableoil reserves are estimated at 100billion tonnes, roughly five timesRussia’s non-Arctic demonstratedreserves and about three times thesize of Saudi Arabian demonstratedreserves. Based on the“MANHATTAN” experience, pipelinesseem to be the only option.However ship design and technologyhave improved enormously in the last30 years. In 1998 the Finnish 16,000viability. As can be seen from thechart, 41% of ice class orderbookconsists of Aframax tankers. Thegrowth in demand means that iceclassships make up a third of allAframax tankers on order. The currenttotal Aframax tanker orderbookis 25% the size of the fleet, so thenext few years will seen a significantinjection of ice-class vessels into theAframax fleet. Primorsk <strong>Shipping</strong> ishaving two 1A ice-class specificationAframax built at Brod. Split, and fiveothers at Hyundai HI. The Sovcomflottanker fleet is ice-class, and it hasfour 1B specification tankers on orderat Daewoo.Graph of the MonthThe Ice Class TankerOrderbook10-60kdwt43% Aframax41%Suezmax11%P'max5%Source: <strong>Clarksons</strong> Research Studiesdwt tanker “UIKKU”loaded oil at the RiverOb, deep inside theRussian Arctic. Thevoyage showed thosespecial ice-class tankers,capable of fast andtight manoeuvring inhard ice, could make apassage with minimumicebreaker assistance.Ice class swellingThe Graph of theMonth shows the currentice-class tankerorderbook. There are 93tankers on order of5.5m dwt. In the RussianArctic, cargo lotsof 50,000 tonnes areneeded for commercialMaximum resistanceFinland and Sweden are now pushingthe EU and IMO to adapt higher iceclassstandards on tankers transitingthe Baltic in winter to load at Russianand Estonian oil terminals. This couldcause supply problems. According tothe Clarkson database, there are only13 ice-class Suezmax in the fleet.Two are classed to 1A and two to 1C.The four ice class Suezmax on orderare also 1C, which is likely to be theminimum acceptable to the Finns.According to our brokers the premiumfor ice-class ranges from 15%extra for 1C to 40% extra for 1A. Forthe time being the ice-class tankerfleet is an exclusive club, with highmembership costs. But as the sourcesof oil move further north, the rewardsfor speculative contracting could behigh.World Shipyard Monitor, 23 July, 2003Editorial Board:Published by: Managing Director Martin StopfordClarkson Research Studies, Publisher Cliff TylerResearch & Publications Division, H. Clarkson & Co.Ltd. Research Services Stephen Gordon12, Camomile Street, Editor/Analyst Craig JallalLONDON EC3A 7BP, England Technician Richard WhiteProduction B. PurewalTelephone: (44) (020) 7283 8955 Newbuilding N. WoodFax: (44) (020) 7623 0539 Newbuilding Data P. EnglishTelex: 8812927 CLTNKA G Demolition A. FlynnDesignDavid WhickerE-mail: crs@clarksons.co.ukWeb site: http://www.clarksons.co.uk/researchWorld Shipyard Monitor is published 12 times a year. It monitors changes in thesupply of 16 different types of cargo ship. The centre sections contain listings ofthe orderbook by ship type and shipyard; the main pages contain “at a glance”tables, graphs and text analysing trends in the orderbook, ordering, deliveriesscrapping & losses, prices, shipbuilding market shares and capacity and fleetforecasts. It is available on subscription at a price of £450 a year plus postage.Whilst care has been taken in the production of this review, no liability can beaccepted for any loss incurred in any way whatsoever by any person who mayseek to rely on the information contained herein. The information in this reportmay not be reproduced without the written permission of Clarkson ResearchStudies.