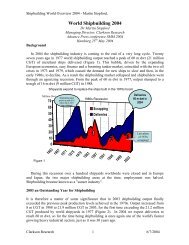
Bulk Vessel - Clarksons Shipping Intelligence Network
Bulk Vessel - Clarksons Shipping Intelligence Network
Bulk Vessel - Clarksons Shipping Intelligence Network

You also want an ePaper? Increase the reach of your titles
YUMPU automatically turns print PDFs into web optimized ePapers that Google loves.
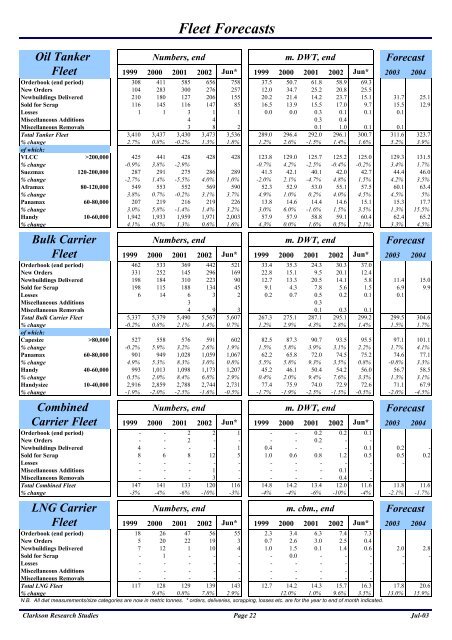
Oil TankerFleetFleet ForecastsNumbers, end m. DWT, end Forecast1999 2000 2001 2002 Jun* 1999 2000 2001 2002 Jun* 2003 2004Orderbook (end period) 308 411 585 656 758 37.5 50.7 61.8 58.9 69.3New Orders 104 283 300 276 257 12.0 34.7 25.2 20.8 25.5Newbuildings Delivered 210 180 127 206 155 20.2 21.4 14.2 23.7 15.1 31.7 25.1Sold for Scrap 116 145 116 147 85 16.5 13.9 15.5 17.0 9.7 15.5 12.9Losses 1 1 3 1 1 0.0 0.0 0.3 0.1 0.1 0.1Miscellaneous Additions 4 4 0.3 0.4Miscellaneous Removals 3 8 2 0.1 1.0 0.1 0.1Total Tanker Fleet 3,410 3,437 3,430 3,473 3,536 289.0 296.4 292.0 296.1 300.7 311.6 323.7% change 2.7% 0.8% -0.2% 1.3% 1.8% 1.2% 2.6% -1.5% 1.4% 1.6% 5.2% 3.9%of which:VLCC >200,000 425 441 428 428 428 123.8 129.0 125.7 125.2 125.0 129.3 131.5% change -0.9% 3.8% -2.9% -0.7% 4.2% -2.5% -0.4% -0.2% 3.4% 1.7%Suezmax 120-200,000 287 291 275 286 289 41.3 42.1 40.1 42.0 42.7 44.4 46.0% change -2.7% 1.4% -5.5% 4.0% 1.0% -2.0% 2.1% -4.7% 4.8% 1.5% 4.2% 3.5%Aframax 80-120,000 549 553 552 569 590 52.3 52.9 53.0 55.1 57.5 60.1 63.4% change 3.8% 0.7% -0.2% 3.1% 3.7% 4.9% 1.0% 0.2% 4.0% 4.5% 4.5% 5%Panamax 60-80,000 207 219 216 219 226 13.8 14.6 14.4 14.6 15.1 15.3 17.7% change 3.0% 5.8% -1.4% 1.4% 3.2% 3.0% 6.0% -1.6% 1.5% 3.5% 1.3% 15.5%Handy 10-60,000 1,942 1,933 1,959 1,971 2,003 57.9 57.9 58.8 59.1 60.4 62.4 65.2% change 4.1% -0.5% 1.3% 0.6% 1.6% 4.3% 0.0% 1.6% 0.5% 2.1% 3.3% 4.5%<strong>Bulk</strong> CarrierFleetNumbers, end m. DWT, end Forecast1999 2000 2001 2002 Jun* 1999 2000 2001 2002 Jun* 2003 2004Orderbook (end period) 462 533 369 442 521 33.4 35.3 24.3 30.3 37.0New Orders 331 252 145 296 169 22.8 15.1 9.5 20.1 12.4Newbuildings Delivered 198 184 310 223 90 12.7 13.3 20.5 14.1 5.8 11.4 15.0Sold for Scrap 198 115 188 134 45 9.1 4.3 7.8 5.6 1.5 6.9 9.9Losses 6 14 6 3 2 0.2 0.7 0.5 0.2 0.1 0.1Miscellaneous Additions 3 0.3Miscellaneous Removals 4 9 3 0.1 0.3 0.1Total <strong>Bulk</strong> Carrier Fleet 5,337 5,379 5,490 5,567 5,607 267.3 275.1 287.1 295.1 299.2 299.5 304.6% change -0.2% 0.8% 2.1% 1.4% 0.7% 1.2% 2.9% 4.3% 2.8% 1.4% 1.5% 1.7%of which:Capesize >80,000 527 558 576 591 602 82.5 87.3 90.7 93.5 95.5 97.1 101.1% change -0.2% 5.9% 3.2% 2.6% 1.9% 1.5% 5.8% 3.9% 3.1% 2.2% 1.7% 4.1%Panamax 60-80,000 901 949 1,028 1,059 1,067 62.2 65.8 72.0 74.5 75.2 74.6 77.1% change 4.9% 5.3% 8.3% 3.0% 0.8% 5.5% 5.8% 9.3% 3.5% 0.8% -0.8% 3.3%Handy 40-60,000 993 1,013 1,098 1,173 1,207 45.2 46.1 50.4 54.2 56.0 56.7 58.5% change 0.5% 2.0% 8.4% 6.8% 2.9% 0.4% 2.0% 9.4% 7.6% 3.3% 1.3% 3.1%Handysize 10-40,000 2,916 2,859 2,788 2,744 2,731 77.4 75.9 74.0 72.9 72.6 71.1 67.9% change -1.9% -2.0% -2.5% -1.6% -0.5% -1.7% -1.9% -2.5% -1.5% -0.5% -2.0% -4.5%CombinedCarrier FleetNumbers, end m. DWT, end Forecast1999 2000 2001 2002 Jun* 1999 2000 2001 2002 Jun* 2003 2004Orderbook (end period) - - 2 2 1 - - 0.2 0.2 0.1New Orders - - 2 - - - - 0.2 - -Newbuildings Delivered 4 - - - 1 0.4 - - - 0.1 0.2 -Sold for Scrap 8 6 8 12 5 1.0 0.6 0.8 1.2 0.5 0.5 0.2Losses - - - - - - - - - - -Miscellaneous Additions - - - 1 - - - - 0.1 -Miscellaneous Removals - - - 3 - - - - 0.4 -Total Combined Fleet 147 141 133 120 116 14.8 14.2 13.4 12.0 11.6 11.8 11.6% change -3% -4% -6% -10% -3% -4% -4% -6% -10% -4% -2.1% -1.7%LNG CarrierFleetNumbers, end m. cbm., end Forecast1999 2000 2001 2002 Jun* 1999 2000 2001 2002 Jun* 2003 2004Orderbook (end period) 18 26 47 56 55 2.3 3.4 6.3 7.4 7.3New Orders 5 20 22 19 3 0.7 2.6 3.0 2.5 0.4Newbuildings Delivered 7 12 1 10 4 1.0 1.5 0.1 1.4 0.6 2.0 2.8Sold for Scrap - 1 - - - - 0.0 - - - - -Losses - - - - - - - - - - -Miscellaneous Additions - - - - - - - - - -Miscellaneous Removals - - - - - - - - - -Total LNG Fleet 117 128 129 139 143 12.7 14.2 14.3 15.7 16.3 17.8 20.6% change 9.4% 0.8% 7.8% 2.9% 12.0% 1.0% 9.6% 3.5% 13.0% 15.9%N.B. All dwt measurements/size categories are now in metric tonnes. * orders, deliveries, scrapping, losses etc. are for the year to end of month indicated.Clarkson Research Studies Page 22Jul-03