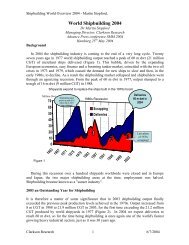
16.014.012.010.08.06.04.02.00.0Mar-96Sep-96Quarterly Deliveries (DWT)Tankers <strong>Bulk</strong>ers GasContainer OtherMar-97Sep-97Mar-98Sep-98Mar-99Sep-99Mar-00Deliveries by <strong>Vessel</strong> TypeSep-00Mar-01Sep-01Source: Clarkson Research StudiesMar-02Sep-02Mar-03Summary• So far this year (to the end of June) 26.3m dwt ofvessels, amounting to 504 ships, have been delivered..Tankers• The number of Aframax tankers delivered so far thisyear (38), has now surpassed the 36 deliveries for thewhole of 2002. In June Vela International took delivery ofthe 97,200dwt “ALDEBARAN STAR” from Daewoo SB.Dry <strong>Bulk</strong> Carriers• Potentially Capesize deliveries this year couldsurpass last year, having already reached 13 vessels.Containerships• It is unlikely >3,000 teu containership deliveries willovertake last year, even though so far 39 ships have beendelivered, compared to 59 vessel by the end of June 2002<strong>Bulk</strong> <strong>Vessel</strong>DeliveriesNo. end m.CGT, end: m. DWT, end:2002 Jun* 2002 Jun* 1999 2000 2001 2002 Jun* 2003 2004 2005VLCC > 200,000 39 19 1.9 0.9 9.0 12.3 7.8 12.3 5.9 11.4 8.9 7.2Suezmax 120-200,000 24 11 0.8 0.3 2.4 3.3 2.5 3.8 1.8 4.7 3.3 3.3Aframax 80-120,000 36 38 0.8 0.9 5.0 2.3 1.5 3.8 4.0 7.8 4.8 4.4Panamax 60-80,000 10 12 0.2 0.3 0.6 1.1 0.3 0.7 0.8 1.8 2.7 2.7Products 10-60,000 57 42 1.1 0.8 1.8 1.2 1.3 2.2 1.7 4.0 4.2 3.6Chemical 10-60,000 37 32 0.5 0.4 1.3 1.1 0.7 1.0 0.8 1.9 1.2 0.7Specialised 10-60,000 3 1 0.0 0.0 0.1 0.2 0.2 0.1 0.0 0.1 0.1 0.0Tankers > 10,000 206 155 5.4 3.7 20.2 21.4 14.2 23.7 15.1 31.7 25.1 21.8Tankers < 10,000 45 38 0.3 0.2 0.3 0.2 0.2 0.3 0.2 0.6 0.3 0.1Capesize > 80,000 25 13 0.6 0.3 4.3 6.1 5.4 4.1 2.2 4.5 5.6 4.9Panamax 60-80,000 56 11 1.1 0.2 4.7 4.0 8.3 4.2 0.8 1.7 4.3 3.0Handymax 40-60,000 86 37 1.3 0.6 1.9 1.8 5.1 4.3 1.9 3.6 3.3 2.5Handysize 10-40,000 56 29 0.6 0.3 1.8 1.4 1.6 1.5 0.8 1.7 1.7 0.7<strong>Bulk</strong>ers > 10,000 223 90 3.7 1.4 12.7 13.3 20.5 14.1 5.8 11.4 15.0 11.2Combos > 10,000 0 1 0.0 0.1 0.4 0.0 0.0 0.0 0.1 0.2 0.0 0.0Total <strong>Bulk</strong> <strong>Vessel</strong>s 474 284 9.5 5.5 33.7 34.9 35.0 38.1 21.2 43.9 40.3 33.1Special <strong>Vessel</strong>Deliveries2002 Jun* 2002 Jun* 2001 2000 2001 2002 Jun* 2003 2004 2005LNG Carriers 10 4 0.9 0.3 0.5 0.8 0.1 0.7 0.3 1.1 1.5 1.0LPG Carriers 24 13 0.3 0.3 0.3 0.5 0.5 0.3 0.3 0.8 0.3 0.3Reefers 2 0 0.0 0.0 0.2 0.1 0.0 0.0 0.0 0.1 0.0 0.0Containers > 3,000 teu 89 39 3.4 1.5 1.6 3.9 5.5 5.8 2.5 4.9 6.1 5.5Containers < 3,000 teu 113 49 1.6 0.7 1.9 2.0 2.5 2.5 1.0 2.3 1.7 0.7Other Dry > 5,000 dwt 90 37 1.6 0.7 1.8 2.1 1.1 1.2 0.6 1.7 1.2 0.7Offshore & Others 141 60 1.0 0.5 1.2 1.3 0.7 0.7 0.0 0.0 0.0 0.0Cruise <strong>Vessel</strong>s 14 6 1.4 0.3 0.1 0.1 0.1 0.1 0.0 0.1 0.1 0.0Ro-Ro Ferries 35 12 1.1 0.4 0.1 0.1 0.1 0.1 0.0 0.1 0.1 0.0Total Special <strong>Vessel</strong>s 518 220 11.4 4.7 7.7 10.9 10.7 11.5 4.8 11.1 11.0 8.1DeliveriesNo. endm.CGT, end:m. DWT, end:Total No. end m.CGT, end: m. DWT, end:Delivery TrendsDelivery TrendsDelivery Trends2002 Jun* 2002 Jun* 2001 2000 2001 2002 Jun* 2003 2004 2005All <strong>Vessel</strong>s Types 992 504 20.9 10.1 41.3 45.8 45.6 49.6 26.3 56.9 52.8 41.8N.B. Specialised ships deliveries in terms of other units of measurement (e.g. cbm, teu) are in the blue centre pages. * denotes data for year to date. Deliveries are those reportedClarkson Research Studies Page 6Jul-03
Deliveries by <strong>Vessel</strong> TypeType <strong>Vessel</strong> Name Flag Dwt Unit Delivery Builder OwnerVLCC Iran Damavand IR. 299,500 Jun 2003 Dalian New Yard Nat. Iranian TankerAframax Aldebaran Star M.I. 97,200 Jun 2003 Daewoo S.B. Vela InternationalPanamax Sunlight Venture H.K. 70,200 Jun 2003 Universal S.B. Wah Kwong Shpg.Handy Chem Petro Vario SG. 16,500 Jun 2003 Kyokuyo S/yard Petroships Pte.Handy Chem Chemroad Vega PA. 30,050 Jun 2003 Shin Kurushima Iino Kaiun KaishaHandy Chem Stenheim GB. 16,400 Jun 2003 Jiangnan S/Yard Stenersen A/SSmall/Spec Whitchampion BR. 4,500 Jun 2003 Gemak Shipyard Whitaker, John H.Small/Spec Bro Genius NE. 7,560 Jun 2003 Ferus Smit Erik Thun ABSmall/Spec Presto BE. 2,460 Jun 2003 Damen Shipyards Dagevos <strong>Shipping</strong>Small/Spec New Millennium H.K. 7,500 Jun 2003 Kurinoura Dock Unknown OwnerSmall/Spec Tasco Amata TH. 7,000 78,000 cbm Jun 2003 Shin Kurushima Tipco Maritime Co.VLGC LPG Gas Capricorn PA. 48,500 Jun 2003 Mitsubishi H.I. Nippon Yusen KaishaCapesize Aquacharm GR. 169,800 May 2003 Sasebo H.I. Carras HellasHandymax Eternal Athena H.K. 46,500 Jun 2003 Oshima S.B. Co. Libera CorporationHandysize IVS Viscount LI. 34,300 Jun 2003 Xingang S.Y. Dockendale Shpg Co.Handysize Infinite Wisdom PA. 12,500 3,607 TEU Jun 2003 Higaki Zosen Wisdom Marine LinesPanamax Barcelona Bridge PA. 37,230 2,495 TEU Jun 2003 Hyundai H.I. NVA NorddeutscheSub-Panamx CSAV Shenzhen PA. 33,000 1,728 TEU May 2003 Naikai S.B. Schepers & Co.Handy Robert Rickmers PA. 22,900 1,118 TEU Jun 2003 Szczecin. Nowa Rickmers ReedereiHandy Asian Island AT. 13,760 950 GT Jun 2003 Jiangdong S/Y W. BockstiegelOffshore Al Saqr UAE 650 690 GT Apr 2003 ABG Shipyard Al Mansoori Product.Offshore Zamil 21 PA. 900 8,100 GT Mar 2003 ABG Shipyard Zamil OperationsRo-Ro Ferries Lobo Marinho PO. 800 1,150 GT Apr 2003 Vianayard Porto Santo Line<strong>Bulk</strong> <strong>Vessel</strong>Deliveries1995 1996 1997 1998 1999 2000 2001 2002 Jun* 2003 2004 2005VLCC > 200,000 3.9 3.6 1.6 2.0 4.7 6.4 4.1 6.4 3.1 5.9 4.6 3.7Suezmax 120-200,000 0.6 0.7 0.9 1.7 1.3 1.8 1.3 2.0 0.9 2.4 1.7 1.7Aframax 80-120,000 0.7 0.8 1.0 2.0 2.8 1.3 0.9 2.1 2.2 4.3 2.6 2.4Panamax 60-80,000 0.1 0.1 0.0 0.0 0.4 0.6 0.2 0.4 0.5 1.0 1.5 1.5Products 10-60,000 0.7 1.0 0.5 0.8 1.1 0.7 0.8 1.4 1.1 2.5 2.6 2.2Chemical 10-60,000 0.2 0.4 0.5 0.7 0.8 0.7 0.4 0.6 0.5 1.2 0.7 0.4Specialised 10-60,000 0.1 0.2 0.1 0.1 0.1 0.1 0.1 0.1 0.0 0.1 0.1 0.0Tankers > 10,000 6.4 6.8 4.6 7.4 11.2 11.7 7.8 13.0 8.3 17.4 13.8 11.9Tankers < 10,000 0.2 0.2 0.2 0.3 0.2 0.1 0.1 0.2 0.2 0.4 0.2 0.1Capesize > 80,000 3.0 4.1 3.8 1.1 2.2 3.1 2.8 2.1 1.1 2.3 2.8 2.5Panamax 60-80,000 2.2 1.7 2.8 2.3 2.5 2.1 4.4 2.2 0.4 0.9 2.2 1.6Handymax 40-60,000 2.2 2.6 2.1 2.1 1.1 1.0 2.9 2.6 1.1 2.1 2.0 1.4Handysize 10-40,000 1.3 1.4 1.6 1.2 1.1 0.9 1.0 1.0 0.5 1.1 1.0 0.4Dry <strong>Bulk</strong> > 10,000 8.7 9.7 10.4 6.7 6.9 7.2 11.2 7.8 3.2 6.4 8.1 6.0Combos > 10,000 0.0 0.2 0.2 0.0 0.3 0.0 0.0 0.0 0.1 0.1 0.0 0.0Total <strong>Bulk</strong> <strong>Vessel</strong>s 15.3 16.9 15.4 14.3 18.6 19.0 19.2 21.0 11.7 24.3 22.1 17.9Special <strong>Vessel</strong>Deliveries1995 1996 1997 1998 1999 2000 2001 2002 Jun* 2003 2004 2005LNG Carriers 0.5 0.7 0.5 0.4 0.7 1.2 0.1 1.0 0.4 1.5 2.0 1.4LPG Carriers 0.2 0.4 0.3 0.2 0.3 0.4 0.4 0.3 0.3 0.7 0.2 0.2Reefers 0.0 0.1 0.2 0.2 0.2 0.1 0.0 0.0 0.0 0.1 0.0 0.0Containers > 3,000 teu 2.3 2.6 3.0 3.2 1.5 3.5 5.0 5.2 2.3 4.5 5.6 5.1Containers < 3,000 teu 1.6 2.1 2.9 2.9 1.5 1.5 2.0 1.9 0.8 1.8 1.3 0.5Other Dry > 5,000 dwt 1.2 1.0 1.3 2.4 2.8 3.2 1.7 1.7 0.8 2.3 1.9 1.4Offshore & Others 0.2 0.4 0.5 0.6 1.0 0.9 0.6 0.6 0.3 0.3 0.0 0.0Cruise <strong>Vessel</strong>s 0.4 0.6 0.4 0.7 0.6 0.7 0.8 1.1 0.2 1.1 0.9 0.2Ro-Ro Ferries 0.3 0.5 0.3 0.3 0.2 0.3 0.8 0.6 0.2 0.4 0.4 0.1Total Special <strong>Vessel</strong>s 6.8 8.3 9.3 10.9 8.7 11.8 11.4 12.5 5.3 12.6 12.5 8.9TotalDeliveriesRecent Shipbuilding DeliveriesMillion GTMillion GTMillion GTDelivery TrendsDelivery TrendsDelivery Trends1995 1996 1997 1998 1999 2000 2001 2002 Jun* 2003 2004 2005All <strong>Vessel</strong>s Types 22.0 25.2 24.7 25.2 27.3 30.7 30.6 33.5 17.0 37.8 35.3 26.9N.B. Specialised ships deliveries in terms of other units of measurement (e.g. cbm, teu) are in the blue centre pages. * denotes data for year to date. Deliveries are those reportedClarkson Research Studies Page 7 Jul-03