Bulk Vessel - Clarksons Shipping Intelligence Network
Bulk Vessel - Clarksons Shipping Intelligence Network
Bulk Vessel - Clarksons Shipping Intelligence Network

You also want an ePaper? Increase the reach of your titles
YUMPU automatically turns print PDFs into web optimized ePapers that Google loves.
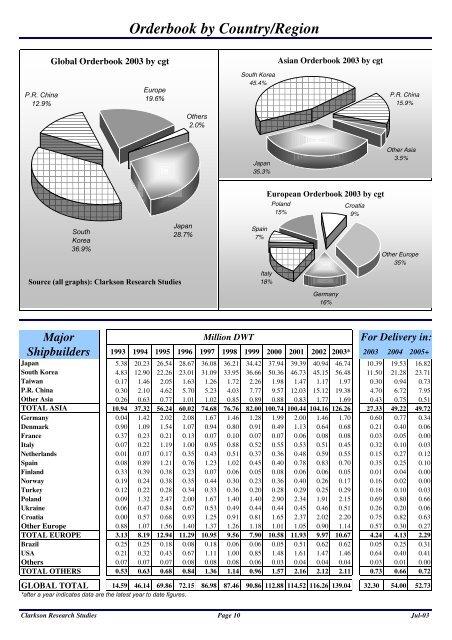
Orderbook by Country/RegionGlobal Orderbook 2003 by cgtAsian Orderbook 2003 by cgtP.R. China12.9%Europe19.6%South Korea45.4%P.R. China15.9%Others2.0%Japan35.3%Other Asia3.5%SouthKorea36.9%Source (all graphs): Clarkson Research StudiesJapan28.7%Spain7%Italy18%European Orderbook 2003 by cgtPoland15%Germany16%Croatia9%Other Europe35%MajorShipbuildersMillion DWTFor Delivery in:1993 1994 1995 1996 1997 1998 1999 2000 2001 2002 2003* 2003 2004 2005+Japan 5.38 20.23 26.54 28.67 36.08 36.21 34.42 37.94 39.39 40.94 46.74 10.39 19.53 16.82South Korea 4.83 12.90 22.26 23.01 31.09 33.95 36.66 50.36 46.73 45.15 56.48 11.50 21.28 23.71Taiwan 0.17 1.46 2.05 1.63 1.26 1.72 2.26 1.98 1.47 1.17 1.97 0.30 0.94 0.73P.R. China 0.30 2.10 4.62 5.70 5.23 4.03 7.77 9.57 12.03 15.12 19.38 4.70 6.72 7.95Other Asia 0.26 0.63 0.77 1.01 1.02 0.85 0.89 0.88 0.83 1.77 1.69 0.43 0.75 0.51TOTAL ASIA 10.94 37.32 56.24 60.02 74.68 76.76 82.00 100.74 100.44 104.16 126.26 27.33 49.22 49.72Germany 0.04 1.42 2.02 2.08 1.67 1.46 1.28 1.99 2.00 1.46 1.70 0.60 0.77 0.34Denmark 0.90 1.09 1.54 1.07 0.94 0.80 0.91 0.49 1.13 0.64 0.68 0.21 0.40 0.06France 0.37 0.23 0.21 0.13 0.07 0.10 0.07 0.07 0.06 0.08 0.08 0.03 0.05 0.00Italy 0.07 0.22 1.19 1.00 0.95 0.88 0.52 0.55 0.53 0.51 0.45 0.32 0.10 0.03Netherlands 0.01 0.07 0.17 0.35 0.43 0.51 0.37 0.36 0.48 0.59 0.55 0.15 0.27 0.12Spain 0.08 0.89 1.21 0.76 1.23 1.02 0.45 0.40 0.78 0.83 0.70 0.35 0.25 0.10Finland 0.33 0.39 0.38 0.23 0.07 0.06 0.05 0.08 0.06 0.06 0.05 0.01 0.04 0.00Norway 0.19 0.24 0.38 0.35 0.44 0.30 0.23 0.36 0.40 0.26 0.17 0.16 0.02 0.00Turkey 0.12 0.22 0.28 0.34 0.33 0.36 0.20 0.28 0.29 0.25 0.29 0.16 0.10 0.03Poland 0.09 1.32 2.47 2.00 1.67 1.40 1.40 2.90 2.34 1.91 2.15 0.69 0.80 0.66Ukraine 0.06 0.47 0.84 0.67 0.53 0.49 0.44 0.44 0.45 0.46 0.51 0.26 0.20 0.06Croatia 0.00 0.57 0.68 0.93 1.25 0.91 0.81 1.65 2.37 2.02 2.20 0.75 0.82 0.63Other Europe 0.88 1.07 1.56 1.40 1.37 1.26 1.18 1.01 1.05 0.90 1.14 0.57 0.30 0.27TOTAL EUROPE 3.13 8.19 12.94 11.29 10.95 9.56 7.90 10.58 11.93 9.97 10.67 4.24 4.13 2.29Brazil 0.25 0.25 0.18 0.08 0.18 0.06 0.06 0.05 0.51 0.62 0.62 0.05 0.25 0.31USA 0.21 0.32 0.43 0.67 1.11 1.00 0.85 1.48 1.61 1.47 1.46 0.64 0.40 0.41Others 0.07 0.07 0.07 0.08 0.08 0.08 0.06 0.03 0.04 0.04 0.04 0.03 0.01 0.00TOTAL OTHERS 0.53 0.63 0.68 0.84 1.36 1.14 0.96 1.57 2.16 2.12 2.11 0.73 0.66 0.72GLOBAL TOTAL 14.59 46.14 69.86 72.15 86.98 87.46 90.86 112.88 114.52 116.26 139.04 32.30 54.00 52.73*after a year indicates data are the latest year to date figures.Clarkson Research Studies Page 10Jul-03