Bulk Vessel - Clarksons Shipping Intelligence Network
Bulk Vessel - Clarksons Shipping Intelligence Network
Bulk Vessel - Clarksons Shipping Intelligence Network

Create successful ePaper yourself
Turn your PDF publications into a flip-book with our unique Google optimized e-Paper software.
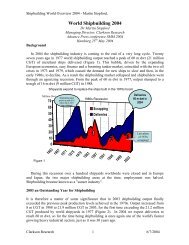
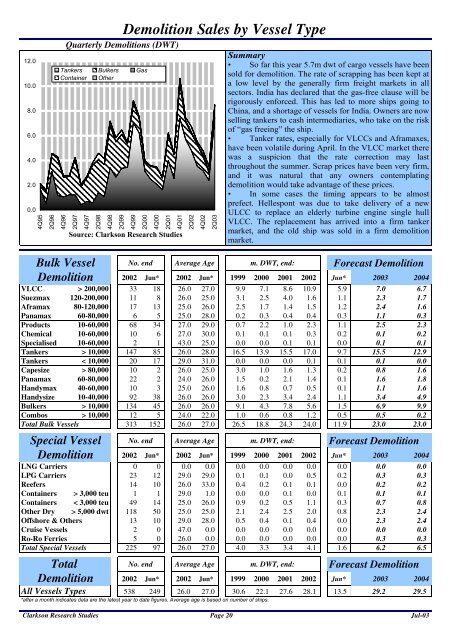
12.010.08.06.04.02.00.0<strong>Bulk</strong> <strong>Vessel</strong>DemolitionDemolition Sales by <strong>Vessel</strong> Type2002 Jun* 2002 Jun* 1999 2000 2001 2002 Jun* 2003 2004VLCC > 200,000 33 18 26.0 27.0 9.9 7.1 8.6 10.9 5.9 7.0 6.7Suezmax 120-200,000 11 8 26.0 25.0 3.1 2.5 4.0 1.6 1.1 2.3 1.7Aframax 80-120,000 17 13 25.0 26.0 2.5 1.7 1.4 1.5 1.2 2.4 1.6Panamax 60-80,000 6 5 25.0 28.0 0.2 0.3 0.4 0.4 0.3 1.1 0.3Products 10-60,000 68 34 27.0 29.0 0.7 2.2 1.0 2.3 1.1 2.5 2.3Chemical 10-60,000 10 6 27.0 30.0 0.1 0.1 0.1 0.3 0.2 0.1 0.2Specialised 10-60,000 2 1 43.0 25.0 0.0 0.0 0.1 0.1 0.0 0.1 0.1Tankers > 10,000 147 85 26.0 28.0 16.5 13.9 15.5 17.0 9.7 15.5 12.9Tankers < 10,000 20 17 29.0 31.0 0.0 0.0 0.0 0.1 0.1 0.1 0.0Capesize > 80,000 10 2 26.0 25.0 3.0 1.0 1.6 1.3 0.2 0.8 1.6Panamax 60-80,000 22 2 24.0 26.0 1.5 0.2 2.1 1.4 0.1 1.6 1.8Handymax 40-60,000 10 3 25.0 26.0 1.6 0.8 0.7 0.5 0.1 1.1 1.6Handysize 10-40,000 92 38 26.0 26.0 3.0 2.3 3.4 2.4 1.1 3.4 4.9<strong>Bulk</strong>ers > 10,000 134 45 26.0 26.0 9.1 4.3 7.8 5.6 1.5 6.9 9.9Combos > 10,000 12 5 24.0 22.0 1.0 0.6 0.8 1.2 0.5 0.5 0.2Total <strong>Bulk</strong> <strong>Vessel</strong>s 313 152 26.0 27.0 26.5 18.8 24.3 24.0 11.9 23.0 23.0Special <strong>Vessel</strong>Demolition2002 Jun* 2002 Jun* 1999 2000 2001 2002 Jun* 2003 2004LNG Carriers 0 0 0.0 0.0 0.0 0.0 0.0 0.0 0.0 0.0 0.0LPG Carriers 23 12 29.0 29.0 0.1 0.1 0.0 0.5 0.2 0.3 0.3Reefers 14 10 26.0 33.0 0.4 0.2 0.1 0.1 0.0 0.2 0.2Containers > 3,000 teu 1 1 29.0 1.0 0.0 0.0 0.1 0.0 0.1 0.1 0.1Containers < 3,000 teu 49 14 25.0 26.0 0.9 0.2 0.5 1.1 0.3 0.7 0.8Other Dry > 5,000 dwt 118 50 25.0 25.0 2.1 2.4 2.5 2.0 0.8 2.3 2.4Offshore & Others 13 10 29.0 28.0 0.5 0.4 0.1 0.4 0.0 2.3 2.4Cruise <strong>Vessel</strong>s 2 0 47.0 0.0 0.0 0.0 0.0 0.0 0.0 0.0 0.0Ro-Ro Ferries 5 0 26.0 0.0 0.0 0.0 0.0 0.0 0.0 0.3 0.3Total Special <strong>Vessel</strong>s 225 97 26.0 27.0 4.0 3.3 3.4 4.1 1.6 6.2 6.5TotalDemolitionQuarterly Demolitions (DWT)Tankers <strong>Bulk</strong>ers GasContainer Other4Q952Q964Q962Q974Q972Q984Q982Q994Q992Q004Q002Q014Q012Q024Q022Q03Source: Clarkson Research StudiesNo. end Average Age m. DWT, end:Forecast DemolitionNo. end Average Age m. DWT, end: Forecast DemolitionNo. end Average Age m. DWT, end: Forecast Demolition2002 Jun* 2002 Jun* 1999 2000 2001 2002 Jun* 2003 2004All <strong>Vessel</strong>s Types 538 249 26.0 27.0 30.6 22.1 27.6 28.1 13.5 29.2 29.5*after a month indicates data are the latest year to date figures. Average age is based on number of ships.Summary• So far this year 5.7m dwt of cargo vessels have beensold for demolition. The rate of scrapping has been kept ata low level by the generally firm freight markets in allsectors. India has declared that the gas-free clause will berigorously enforced. This has led to more ships going toChina, and a shortage of vessels for India. Owners are nowselling tankers to cash intermediaries, who take on the riskof “gas freeing” the ship.• Tanker rates, especially for VLCCs and Aframaxes,have been volatile during April. In the VLCC market therewas a suspicion that the rate correction may lastthroughout the summer. Scrap prices have been very firm,and it was natural that any owners contemplatingdemolition would take advantage of these prices.• In some cases the timing appears to be almostprefect. Hellespont was due to take delivery of a newULCC to replace an elderly turbine engine single hullVLCC. The replacement has arrived into a firm tankermarket, and the old ship was sold in a firm demolitionmarket.Clarkson Research Studies Page 20 Jul-03