Bulk Vessel - Clarksons Shipping Intelligence Network
Bulk Vessel - Clarksons Shipping Intelligence Network
Bulk Vessel - Clarksons Shipping Intelligence Network

You also want an ePaper? Increase the reach of your titles
YUMPU automatically turns print PDFs into web optimized ePapers that Google loves.
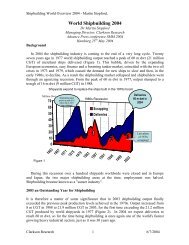
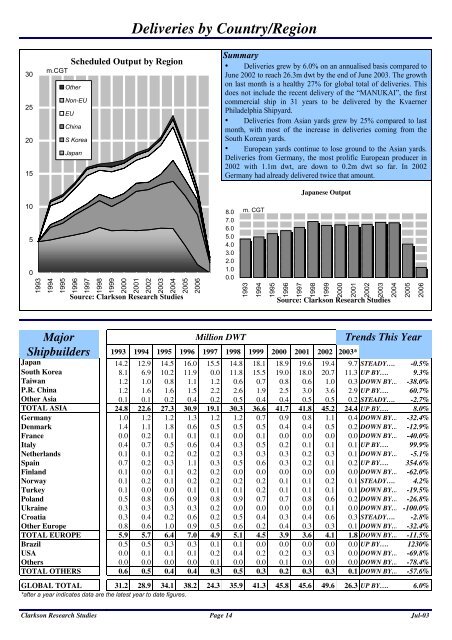
Deliveries by Country/Region30252015m.CGTScheduled Output by RegionOtherNon-EUEUChinaS KoreaJapanSummary• Deliveries grew by 6.0% on an annualised basis compared toJune 2002 to reach 26.3m dwt by the end of June 2003. The growthon last month is a healthy 27% for global total of deliveries. Thisdoes not include the recent delivery of the “MANUKAI”, the firstcommercial ship in 31 years to be delivered by the KvaernerPhiladelphia Shipyard.• Deliveries from Asian yards grew by 25% compared to lastmonth, with most of the increase in deliveries coming from theSouth Korean yards.• European yards continue to lose ground to the Asian yards.Deliveries from Germany, the most prolific European producer in2002 with 1.1m dwt, are down to 0.2m dwt so far. In 2002Germany had already delivered twice that amount.Japanese Output1050199319941995199619971998199920002001200220032004Source: Clarkson Research Studies200520068.07.06.05.04.03.02.01.00.0m. CGT19931994199519961997199819992000200120022003Source: Clarkson Research Studies200420052006MajorShipbuildersMillion DWTTrends This Year1993 1994 1995 1996 1997 1998 1999 2000 2001 2002 2003*Japan 14.2 12.9 14.5 16.0 15.5 14.8 18.1 18.9 19.6 19.4 9.7 STEADY…. -0.5%South Korea 8.1 6.9 10.2 11.9 0.0 11.8 15.5 19.0 18.0 20.7 11.3 UP BY…. 9.3%Taiwan 1.2 1.0 0.8 1.1 1.2 0.6 0.7 0.8 0.6 1.0 0.3 DOWN BY… -38.0%P.R. China 1.2 1.6 1.6 1.5 2.2 2.6 1.9 2.5 3.0 3.6 2.9 UP BY…. 60.7%Other Asia 0.1 0.1 0.2 0.4 0.2 0.5 0.4 0.4 0.5 0.5 0.2 STEADY…. -2.7%TOTAL ASIA 24.8 22.6 27.3 30.9 19.1 30.3 36.6 41.7 41.8 45.2 24.4 UP BY…. 8.0%Germany 1.0 1.2 1.2 1.3 1.2 1.2 0.7 0.9 0.8 1.1 0.4 DOWN BY… -32.4%Denmark 1.4 1.1 1.8 0.6 0.5 0.5 0.5 0.4 0.4 0.5 0.2 DOWN BY… -12.9%France 0.0 0.2 0.1 0.1 0.1 0.0 0.1 0.0 0.0 0.0 0.0 DOWN BY… -40.0%Italy 0.4 0.7 0.5 0.6 0.4 0.3 0.5 0.2 0.1 0.1 0.1 UP BY…. 99.9%Netherlands 0.1 0.1 0.2 0.2 0.2 0.3 0.3 0.3 0.2 0.3 0.1 DOWN BY… -5.1%Spain 0.7 0.2 0.3 1.1 0.3 0.5 0.6 0.3 0.2 0.1 0.2 UP BY…. 354.6%Finland 0.1 0.0 0.1 0.2 0.2 0.0 0.0 0.0 0.0 0.0 0.0 DOWN BY… -62.0%Norway 0.1 0.2 0.1 0.2 0.2 0.2 0.2 0.1 0.1 0.2 0.1 STEADY…. 4.2%Turkey 0.1 0.0 0.0 0.1 0.1 0.1 0.2 0.1 0.1 0.1 0.1 DOWN BY… -19.5%Poland 0.5 0.8 0.6 0.9 0.8 0.9 0.7 0.7 0.8 0.6 0.2 DOWN BY… -26.8%Ukraine 0.3 0.3 0.3 0.3 0.2 0.0 0.0 0.0 0.0 0.1 0.0 DOWN BY… -100.0%Croatia 0.3 0.4 0.2 0.6 0.2 0.5 0.4 0.3 0.4 0.6 0.3 STEADY…. -2.8%Other Europe 0.8 0.6 1.0 0.9 0.5 0.6 0.2 0.4 0.3 0.3 0.1 DOWN BY… -32.4%TOTAL EUROPE 5.9 5.7 6.4 7.0 4.9 5.1 4.5 3.9 3.6 4.1 1.8 DOWN BY… -11.5%Brazil 0.5 0.5 0.3 0.3 0.1 0.1 0.0 0.0 0.0 0.0 0.0 UP BY…. 1230%USA 0.0 0.1 0.1 0.1 0.2 0.4 0.2 0.2 0.3 0.3 0.0 DOWN BY… -69.8%Others 0.0 0.0 0.0 0.0 0.1 0.0 0.0 0.1 0.0 0.0 0.0 DOWN BY… -78.4%TOTAL OTHERS 0.6 0.5 0.4 0.4 0.3 0.5 0.3 0.2 0.3 0.3 0.1 DOWN BY… -57.6%GLOBAL TOTAL 31.2 28.9 34.1 38.2 24.3 35.9 41.3 45.8 45.6 49.6 26.3 UP BY…. 6.0%*after a year indicates data are the latest year to date figures.Clarkson Research Studies Page 14 Jul-03